
Common Core State Standards (CCSS) have been adopted as the reading and math standards of more than 40 states. All but a few states scheduled full implementation of the standards, including assessments, by the end of the 2014-15 school year. Three states (Indiana, Oklahoma, and South Carolina) have rescinded previous adoptions of the Common Core, and others have made minor revisions. This section of the Brown Center Report (BCR) will exploit the variation in state implementation of CCSS to look at the association of the standards with reading and mathematics performance in grades four and eight, the two grades tested by the National Assessment of Educational Progress (NAEP).
Previous BCRs introduced two models for assessing the effects of CCSS. The models use different indicators and sources of data to create implementation indexes. The indexes sort states into three groups: nonadopters of CCSS, medium implementers, and strong implementers. The 2011 index (IMP11) is based on a 2011 survey of state agencies’ use of federal Recovery Act funds to implement CCSS.1 States were categorized as “strong” implementers if they reported joining a CCSS test consortium and spending money on professional development and new instructional materials (nineteen states). The 2013 index (IMP13) is based on a 2013 survey of state agencies, requesting their timeline for when CCSS would be fully implemented. The states that planned to achieve “classroom implementation of ELA-CCSS” by the end of the 2012-2013 school year were categorized as strong implementers.
Related Content


The analytical approach has both strengths and weaknesses. A strength is modeling data longitudinally, allowing each state to serve, in a sense, as its own control. Analyses of cross-sectional data, as opposed to longitudinal data, are particularly vulnerable to producing spurious correlations. A second strength, especially important in interpreting NAEP gains and losses in 2015, is that the indexes were constructed years prior to the release of the 2015 scores. Advocates and critics of CCSS have labored mightily to present the disappointing 2015 NAEP scores in the most favorable light for their cause. Making up rules for explaining test scores after the scores are known introduces the usual pitfalls of post hoc analysis, and to do so while participating in a political debate should raise alarm bells about the indifference of the analysis.
As reported in the 2015 BCR, analyses employing the two indexes indicated that states engaged in strong implementation of CCSS registered a one to one and one-half point advantage in NAEP gains from 2009-2013 compared to nonadopters of CCSS. Both indexes were constructed based on the perspectives of state policy authorities, the elites of implementation efforts. They also only reflect the earliest stages of CCSS implementation. This year’s study goes deeper by examining reports from teachers and principals on changes occurring inside schools. The data come from surveys conducted as part of NAEP.
Please note that the following analysis does not investigate whether changes in particular practices have caused gains or losses in student achievement. The practices examined here are simply being used as markers for indicating the degree to which CCSS recommendations have penetrated schools and classrooms. The 2011 and 2013 implementation indexes are based on information provided by state policymakers as to the breadth and ambitiousness of state implementation plans. The objective now is to see whether those indexes correspond with reports from practitioners on how CCSS implementation is actually proceeding in schools and classrooms. Scholars of public policy have long known that frontline implementers (sometimes referred to as “street level bureaucrats”) can profoundly shape the end results of top-down initiatives.2 In the following analysis, responses of teachers and principals to NAEP questionnaires are aggregated to the state level to measure each state’s implementation of CCSS. Before examining the state-level data, let’s examine national trends.
The question is whether teachers will readily abandon the lesson plans they’ve spent years honing through trial and error.
But it appears change is happening; the dominance of fiction is waning. Figures 1-1 and 1-2 display the percentage of fourth and eighth grade students with teachers saying they emphasize fiction and nonfiction to a “great extent.” The relative importance of fiction is clear until 2011, when it begins to slip. In fourth grade, the 25 percentage point gap favoring fiction in 2011 declines to 15 percent in 2013 and to eight percent in 2015. In eighth grade, the 34 percent emphasis favoring fiction declines to 24 percent in 2013 and to 16 percent in 2015. Teachers in 2015 were less likely to embrace the superiority of fiction in reading instruction than in the past, and the change is evident in both fourth and eighth grades after 2011.
Fourth and Eighth Grade Reading: The Dominance of Fiction Wanes
Fiction has long dominated reading instruction. The Common Core standards in English Language Arts (ELA) urge teachers to strike a greater balance between fiction and nonfiction. CCSS-ELA recommends that informational texts, including texts studied in classes other than English, should command 70 percent of students’ reading materials by the end of high school. The recommendation proved to be quite controversial, with an extended debate breaking out in 2012.3 Mark Bauerlein and Sandra Stotsky pointed out that research does not support the superiority of studying nonfiction in improving reading skills. Moreover, as an implementation issue, the recommendation runs headlong into deeply entrenched practice. The question is whether teachers will readily abandon the lesson plans they’ve spent years honing through trial and error—and give up the texts on which those lessons are focused.


But it appears change is happening; the dominance of fiction is waning. Figures 1-1 and 1-2 display the percentage of fourth and eighth grade students with teachers saying they emphasize fiction and nonfiction to a “great extent.” The relative importance of fiction is clear until 2011, when it begins to slip. In fourth grade, the 25 percentage point gap favoring fiction in 2011 declines to 15 percent in 2013 and to eight percent in 2015. In eighth grade, the 34 percent emphasis favoring fiction declines to 24 percent in 2013 and to 16 percent in 2015. Teachers in 2015 were less likely to embrace the superiority of fiction in reading instruction than in the past, and the change is evident in both fourth and eighth grades after 2011.
Fourth Grade Math: Less Emphasis on Data Analysis and Geometry
The main NAEP was first administered in 1990 in math and 1992 in reading. Most state mathematics frameworks were modeled after the 1989 standards of the National Council of Teachers of Mathematics (NCTM), with the basic structure of math curriculum stable until adoption of the Common Core. Content was organized by five domains (or strands): number and operations; algebra; measurement; geometry; and data analysis (which includes statistics and probability). The NCTM standards envisioned these five math domains—even algebra—being taught every year from kindergarten through twelfth grade. To this day, NAEP has a similar five-strand structure and awards each strand a different weight.4
Common Core takes a more restricted view of mathematics than the five strand approach. That means fewer topics. David Coleman, leader of the Common Core project, has described CCSS as focusing on whole number arithmetic from kindergarten through fourth grade.5 Jason Zimba, one of the lead writers of the CCSS math standards states that they “revise the previous ‘strand model’ of mathematics content in order to emphasize arithmetic, algebra, and the connections between them.”6
A change occurred in four key practices related to curriculum and instruction.
Teachers appear to be responding to the new focus. Fourth grade teachers do not teach as much data and geometry as they once did. Table 1-1 reports the percentage of teachers saying that they heavily emphasize geometry and data in the math curriculum. The proportions stayed fairly steady until 2011, when they began to decline. Neither domain received as much attention in 2015 as in 2011 or prior years.
Eighth Grade Math: A Shift in Course Taking
The first decade of the 21st century witnessed a dramatic change in the math courses taken by eighth graders. An “algebra for all in eighth grade” movement was bolstered by the rising belief that middle school students should take more rigorous math classes. Enrollment in advanced courses—mainly Algebra I, but also geometry and other forms of algebra—steadily increased. Enrollment in general eighth grade math courses fell. As shown in Table 1-2, general math was the dominant course in 2000, with a 38 percent to-27 percent enrollment advantage over advanced math. In the following decade, enrollment in advanced classes boomed. Advanced math courses held a 47 percent to 25 percent advantage in 2011.

But something happened around 2011. From 2011 to 2013, the relative growth of advanced courses stopped dead in its tracks. Then, from 2013 to 2015, enrollment in advanced math declined from 48 percent to 43 percent. Enrollment increased from 26 to 32 percent in general math.
Common Core supports this recent trend by delineating a single eighth grade math course for all students. Options for accelerating mathematically precocious middle school students by compacting three years into two are discussed in an appendix to CCSS, but the standards themselves lay out a single eighth grade math course that all eighth graders are expected to take. As noted in the study of tracking and Advanced Placement in this report, opponents of tracking have lauded, as a step towards equity, placing all eighth graders in the same math course.
Is Common Core Related to Changes in Practice?
These national trends indicate that, concurrent with CCSS’s implementation, a change occurred in four key practices related to curriculum and instruction. By itself that does not constitute convincing evidence that CCSS is connected to the trends, but additional evidence strengthens the case. Let’s start with the obvious: CCSS endorses all of these particular changes in practice. Moreover, three of the changes—the shift away from fiction at both fourth and eighth grades and the movement away from advanced math classes in eighth grade—have provoked widespread public debate. In those debates, policymakers stated that the changes were compelled by Common Core.
The California State Board of Education, for example, rescinded its policy promoting universal eighth grade algebra when it adopted the CCSS math standards.7On the 2013 NAEP, 73 percent of California eighth graders were enrolled in advanced math courses, a number that plummeted to 45 percent in 2015. In 2013, only seven percent of students were enrolled in a general eighth grade math class. In 2015, the share of students in general math jumped to 32 percent. EdSource, a California publication devoted to education topics, dubbed the trend, “Retreat from Universal 8th Grade Algebra.”8
Table 1-39 displays the changes in practice in light of the BCR’s 2013 implementation model. To calculate the data, first, state-level changes in the four practices were standardized by conversion to z-scores, with a mean of 0.00 and a standard deviation of 1.00. The base year for each period of change reflects the point in time when, as indicated in the charts above, a reversal in the prevailing national trend occurred. For eighth grade math courses, changes occurring from 2013 to 2015 are reported. For the other three practices, 2011 to 2015 is the time period under scrutiny.
Curriculum and instruction are changing at the ground level of schooling.
Because a z-score of 0.00 represents change in the average state, the signs of the values in the table are important. Positive scores indicate movement in accord with CCSS, and negative scores indicate change in practice contrary to CCSS recommendations. The z-score of -0.31 in the first column, for example, indicates that fourth grade teachers in non-CCSS states were, relative to the average state, less likely to de-emphasize fiction in favor of nonfiction. They went against Common Core. States with medium (0.03) and strong (0.11) implementation of CCSS, on the other hand, were slightly more likely than the average state to place a greater emphasis on nonfiction.
The two math practices clearly differentiate the states. The fourth grade nonadopters (z= -0.76) are reluctant to de-emphasize geometry and data, whereas the strong implementers are more likely to do so (0.32). The eighth grade nonadopters are more likely to continue offering advanced math classes (-0.61) while the strong implementers of CCSS are increasingly favoring a single, general math class (0.33).
Related Books


Take note of differences among the table’s rows. Changes in these four key practices differentiate the nonadopters from states embracing CCSS, but they are not as successful in drawing a contrast between strong and medium implementers. The eighth grade reading practice (emphasis on fiction vs. nonfiction) is particularly weak in this regard, with strong implementers looking more like nonadopters than medium implementers. In a way, this makes sense. When the brouhaha over nonfiction erupted in 2012, defenders of the Common Core argued that the recommendation applied to reading materials taught in all middle and high school classes—history, science, and art—and not only to those taught by language arts teachers. Perhaps ELA eighth grade teachers in strong CCSS states do not feel the same urgency to use nonfiction texts as their fourth grade counterparts who, after all, typically teach all subjects in a self-contained class. The decision to give nonfiction texts greater prominence in the fourth grade curriculum affects the fourth grade teacher alone.
Are Changes in NAEP Scores Associated with CCSS Implementation?
Tables 1-4 and 1-5 present changes in NAEP fourth grade reading scores with states categorized by implementation status. Table 1-4 sorts the states using the IMP11 model and Table 1-5 uses Imp13. The last column in the tables presents data covering the six year period, 2009-2015. Regardless of implementation status, states made only slight progress in reading. The medium implementers made the largest gains (2.15) in IMP11 and the nonadopters made the largest gains in IMP13 (2.52). The gains for all three implementation categories fall within a single NAEP scale score point of each other. The standard deviation (sd) of the 2015 NAEP fourth grade reading scores is 37 points. One point is less than 0.03 sd units. That is a miniscule difference, especially if taking six years to emerge. The NAEP fourth grade reading assessment has experienced other six-year intervals of underperformance, most notably from 1992 to 1998, when scores were flat.
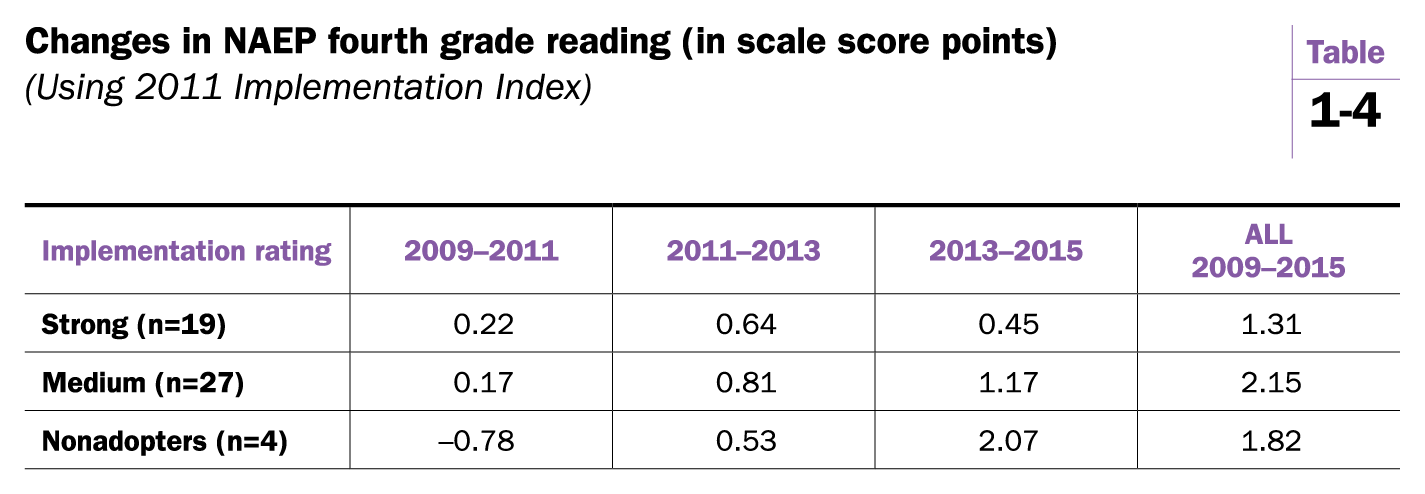
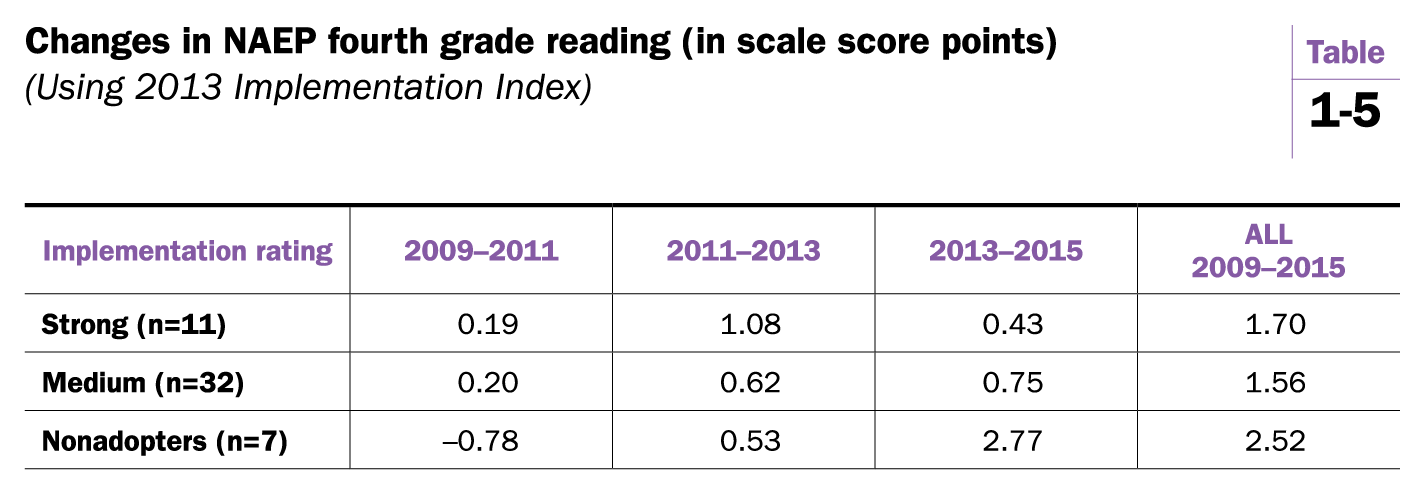
It is interesting that CCSS’s implementers and nonadopters have experienced different periods of superior performance. In the early years of CCSS implementation (2009-2011 and 2011-2013), both strong and medium implementers made larger gains than the nonadopters in fourth grade. In 2013-2015, the nonadopters made larger gains, two points or more in the 2013 model. NAEP changes that occur in a single two-year interval can easily evaporate, so whether this potential trend continues in 2017 NAEP data will be important. The discussion below returns to this question.
Regardless of CCSS implementation status, states made only slight progress in reading.

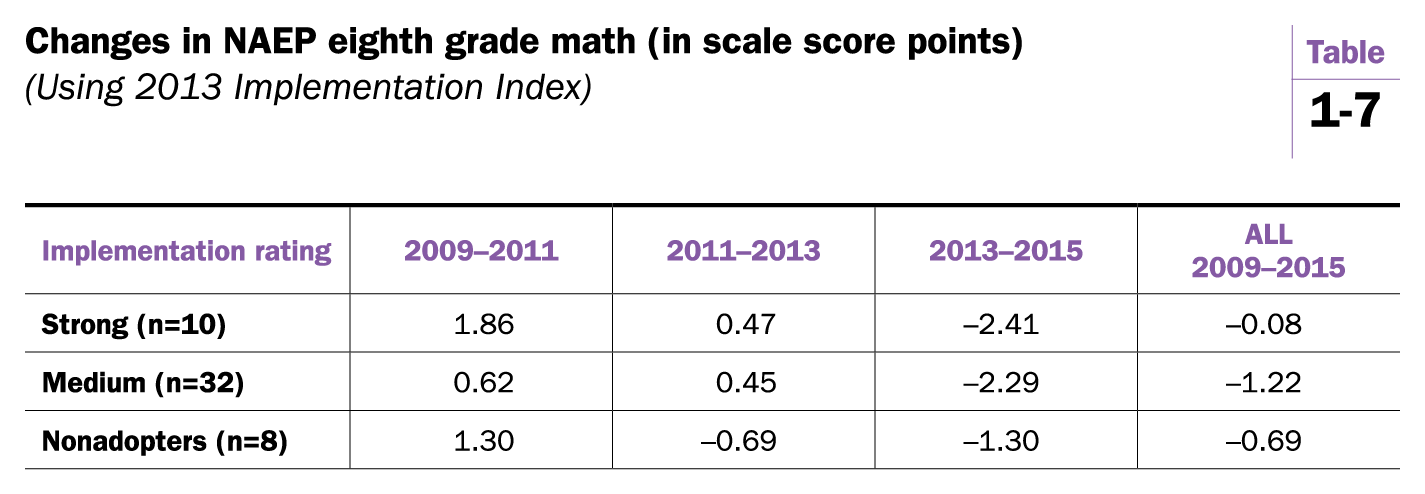
Tables 1-6 and 1-7 examine NAEP scores in eighth grade math. Again, the states are grouped by implementation status as defined by the 2011 and 2013 implementation models. The three implementation categories all experienced small declines in NAEP performance from 2009-2015. To put this event in context, the smallest gain in any previous six year period on the eighth grade NAEP test in math has been four points. A loss has never happened before. Nonadopters register the smallest loss in the 2011 model (-0.37) and strong implementers in the 2013 model (-0.08). As in reading, different periods of superiority are evident. Medium or strong implementers notched larger gains from 2011-2013; nonadopters outpaced medium implementers in 2009-2011. The 2013-2015 interval may be a turning point, with nonadopters’ scores declining but declining less than the scores of CCSS states. Future NAEP scores will tell the tale.
Whatever is depressing NAEP scores appears to be more general than the impact of one set of standards or another.
Summary and Conclusion
This section of the Brown Center Report investigated the Common Core. Recent trends in four practices were charted using NAEP data—the teaching of nonfiction in both fourth and eighth grades, the amount of emphasis given to data and geometry in fourth grade math, and course enrollments in eighth grade math. The CCSS takes a position on all four activities. The data collected from teachers and principals on NAEP indicate that these four practices have recently begun trending in the direction recommended by the CCSS: teachers are giving greater emphasis to nonfiction texts at both fourth and eighth grades; data and geometry are receiving less attention in fourth grade math; and at eighth grade, enrollments are falling in advanced math courses and rising in general math courses. Curriculum and instruction are changing at the ground level of schooling.
States vary on how they look individually on the CCSS reforms. Previous installments of the Brown Center Report introduced models for evaluating the implementation of CCSS. The models sort states into three groups: nonadopters of CCSS, medium implementers, and strong implementers. As one would expect, the nonadopters appear more resistant to the CCSS curricular and instructional changes compared to states categorized as having either medium or strong CCSS implementation. The strong implementers were the states most likely to embrace CCSS reforms, with the exception of placing a greater emphasis on nonfiction texts in eighth grade. The medium implementers were the states most accepting of that reform.
The implementation models were used to analyze NAEP scores from 2009-2015. The models show that CCSS implementation is associated with a change of no more than a single point (plus or minus) in NAEP for both fourth grade reading and eighth grade math scores. Here’s how that finding was calculated. Dividing the CCSS adopters into two groups allows for two separate comparisons with the non-adopters. For the eight comparisons produced for 2009-2015, the largest advantage for CCSS adopters is +.61 (Table 1-7, comparing strong implementers with nonadopters on eighth grade math scores). The largest advantage for nonadopters is +0.96 (Table 1-5, comparing nonadopters with medium implementers on fourth grade reading scores). A change of one NAEP scale score point is trivial—and especially so over six years.
This study’s analytical approach has weaknesses. It cannot determine causality. States engage in a lot of policymaking when it comes to education, so declaring that CCSS or any other singular policy caused a change in NAEP scores is unwarranted. Grouping the states by strength of implementation helps mitigate the effect of other polices (assuming that non-CCSS policies are distributed randomly over groups). But the nonadopter group is too small—only four states in 2011 reading—to have confidence in the assumption. Using changes in NAEP scores over two year intervals helps control for demographic changes—demographic influences should be baked into baseline scores and not change much over two years—but such influences could bias calculations for the six-year interval of 2009-2015.10 The approach is also statistically unsophisticated. Future evaluations of CCSS will probably take a similar approach, modeling variation among states (and maybe districts), then calculating test score changes over time. But they also may collect richer data sets and employ methods that go beyond the current study’s simple comparisons of group means.
An intriguing finding from the study pertains to implementation. Adopters and nonadopters of CCSS appear to have experienced different periods of superiority on NAEP. The adopters registered larger NAEP gains early in the implementation process, 2009-2013, whereas the nonadopters look better in the most recent interval, 2013-2015 (in the case of math, by registering smaller losses). Many advocates of CCSS have a theory of implementation that believes these standards are so new, so revolutionary, so different from what teachers have experienced previously that Common Core won’t bear fruit for many years. Professional development, new textbooks, teaching that targets “deeper learning,” and all the other accoutrements of CCSS take time to unfold. Just wait, good things will happen, proponents say. Michael Kirst, chair of the California State School Board, probably gave the most honest statement of this theory by saying it will take at least another five years (meaning 2020), a full decade after California’s 2010 adoption of CCSS, before the state knows if Common Core “works.”11
The data above support a competing hypothesis. Maybe CCSS has already had its best years and additional gains will be difficult to attain. Major top-down reforms can have their strongest effects when first adopted, whether it’s the NSF-funded science and math curricula of the 1960s, including New Math, or the more recent No Child Left Behind Act. Policy elites rally around a new policy, advocates trumpet the benefits that will occur, a public relations campaign is launched to garner support, and local educators respond enthusiastically to the new reforms. New Math started with a bang, but as criticism grew and teachers’ support dissipated, the materials fell out of use.12
The 2015 NAEP scores were a political disaster for Common Core. Eighth grade math scores, for example, fell for the first time in NAEP’S 25 year history (down three points). Some observers were quick to point a finger at CCSS. That’s probably unfair. The analysis above indicates that, yes, nonadopters performed better than CCSS states, but only by declining less, not through improved performance. None of the states are setting the world on fire. Whatever is depressing NAEP scores appears to be more general than the impact of one set of standards or another.
Part II: Tracking and Advanced Placement »
Table of contents
Authors

-
Footnotes
- The survey asked state education agencies if they had adopted the CCSS and 1) provided, guided, or funded professional development on CCSS, 2) provided curriculum or instructional materials for the CCSS; and 3) worked with a consortium to develop assessments aligned with CCSS.
- Michael Lipsky (1980). Street Level Bureaucracy: Dilemmas of the Individual in Public Services (Russell Sage Foundation).
- Catherine Gewertz, “Scale Tips Toward Nonfiction Under Common Core,” Education Week. (November 13, 2012).
- On the 4th grade NAEP assessment, data analysis and geometry are targeted to comprise 25% of items, and in 2015, they actually represented 28% of items. National Center for Education Statistics, National Assessment of Educational Progress (NAEP), Distribution of Mathematics Questions: 2015, https://nces.ed.gov/nationsreportcard/mathematics/distributequest.aspx
- “What We’re Watching: David Coleman on the Common Core Standards,” Education Next. (July 11, 2011). Available at: http://educationnext.org/what-were-watching-davidcoleman-on-the-common-core-standards/
- Jason Zimba, “The Common Core and the Potential for Mathematicians to Improve the Teaching of School Mathematics,” Notices of the AMS, vol. 63, no. 2 (February, 2016,), pp. 154-158.
- Sharon Noguchi, “California abandons algebra requirement for eighth-graders,” San Jose Mercury News. (February 2, 2013).
- John Fensterwald, “Districts must ensure equity in rules for accelerating students in math,” EdSource. (December 14, 2015).
- State implementation ratings are fixed in IMP11. Ratings are dynamic in IMP13, changed for each NEAP interval to reflect policy changes. Based on policy changes from 2013 to 2015, three states that rescinded CCSS were reclassified as nonadopters (Indiana, Oklahoma, South Carolina) and one state, Georgia, that revised its standards was reclassified from strong to medium. Minnesota is classified as a nonadopter in math and a medium (IMP11) and strong (IMP13) implementer in reading. Alaska, a nonadopter, has no data on eighth grade course enrollments and is not included for those calculations.
- Free and reduced lunch statistics have historically been used as measures of socioeconomic status, but changes in that program’s rules for eligibility cast doubt on their continued reliability.
- “The real test of Common Core is about to begin,” The Sacramento Bee. (January 17, 2015).
- Tom Loveless (2001). “A Tale of Two Math Reforms: The Politics of the New Math and the NCTM Standards,” in The Great Curriculum Debate: How Should We Teach Reading and Math? (Brookings Institution Press), pp. 184-209.