
The 2020s are beginning on the heels of a decade that saw considerable demographic stagnation, highlighting important implications for immigration, congressional apportionment, and the country’s future.
The nation’s population growth from 2018 to 2019 grew by a mere 0.48%, according to newly released Census Bureau estimates. This is the lowest annual growth rate since 1918, and caps off a decade that should show the slowest 10-year population growth since the first census was taken in 1790.
The new numbers update annual population statistics through July 1, 2019, nine months before the 2020 census is to begin. They provide for a final projection on what the census will show for 2010-20 state growth, as well as the likely reapportionment of congressional seats. Additionally, they provide a series of annual estimates that allow one to track the trends accounting for the decade’s shifts, some of which are likely to continue.
The decade’s patterns reveal a nation with unprecedented growth stagnation, an absolute decline in its under-18 youth population, higher growth for states in the Mountain West and Southeast, low growth in the Midwest and Northeast, and population loss in four states. Moreover, declining growth in California could lead to its first-ever loss of a congressional seat.
2010-20 will show the smallest decade growth in U.S. history
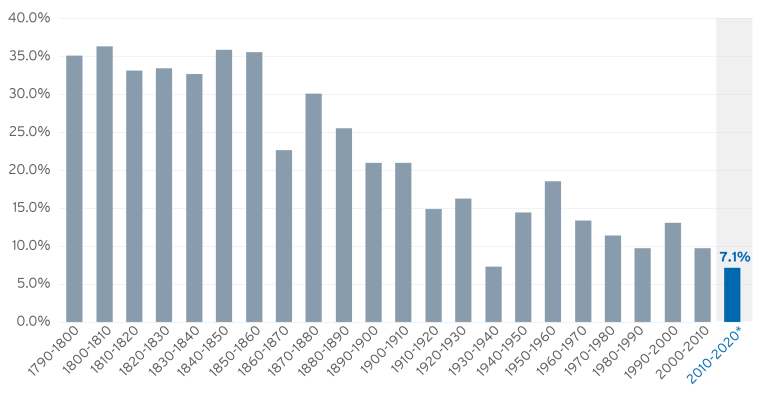
Figure 1 displays population growth rates for 10-year periods between the first U.S. census (taken in 1790) through projected results for the 2020 census.1
The projected growth of 7.1% between 2010 and 2020 is lower than any previous decade, including the 1930s Great Depression years, when the nation registered 7.3% growth. It is not much more than half the growth rate of the 1990s, a period of rising immigration and millennial births.
Figure 1: US population growth for decades: Censuses 1790 to 2020 (projected)
*Projected
Source: William H Frey analysis of U.S. decennial censuses 1790–2010, and author’s projection to April 1, 2020.
The 2010s was a decade of fewer births, more deaths, and uneven immigration. (download Table A) The 2018-19 period had an exceptionally low growth rate of 0.48%, with immigration declining to 595,000 people—the lowest level since the 1980s—and a drop in natural increase to below 1,000,000. (download Table B) While immigration may have been unusually low due to recent federal restrictions which led to a decline in the noncitizen foreign-born, relatively low natural increase levels are likely to persist due to the aging of the population.
One symptom of the aging population is the decade-wide loss in young people under age 18. Between 2010 and 2019, the nation sustained an absolute decline of 1.14 million youth. Some of this change can be attributed to lower fertility rates and the aging into adulthood of the last of the millennial population, though census projections show older populations—especially those over age 65—will display far higher rates of growth than youth.
Thirty states experienced decade-wide declines in youth population, led by California, with a loss of 400,000. In contrast, Texas, a state with high migrant gains over the period, added more than 500,000 young people. (Download Table C)
The decade’s growth favored the West and South
The projected state growth levels over the 2010-20 decade show distinct regional variations which favor the West and South.2 Despite low national growth, seven states and the District of Columbia should grow by more than 15%. Five of these—Utah, Idaho, Nevada, Colorado, and Arizona—are located in the Mountain West. Southern growth magnets Texas and Florida round out this group.
Two West Coast states (Washington and Oregon) and three Southeastern states (North Carolina, South Carolina, and Georgia) each show a 10% gain over the course of the decade, as does one Midwestern outlier: North Dakota, which profited from an early-decade energy boom. Each of these states benefitted from domestic in-migration throughout the decade, though the growth of Idaho, Nevada, and Arizona rose during the end of the decade in particular. (Download Table D)
…
Map 1: Projected State Population Growth, Census 2010 to Census 2020
…
Source: William H Frey projections based on 2010 US Census and 2018 and 2019 census estimates released Dec 30, 2019
A middle tier of states, growing between 5-10%, are located in several regions: Massachusetts in New England; Virginia, Tennessee, and Oklahoma in the South; South Dakota, Minnesota, and Nebraska in the Midwest; and Montana and California in the West.
California, the largest state, saw diminished growth and increased domestic out-migration over the decade. This led to larger late-decade gains in other states, especially in the West, where housing and labor markets picked up as they recovered from the Great Recession.
The remainder of the states—mostly in the nation’s middle and Northeast—showed either modest growth or population declines. Four states—West Virginia, Illinois, Connecticut, and Vermont—are projected to show absolute population losses over the decade. West Virginia exhibited losses for seven years running through the end of the decade; Illinois and Connecticut did so for six years, and New York for four years. (Download Table D)
By the last few years of the decade, three large states—California, New York, and Illinois—saw the biggest domestic out-migration to other states, signaling a population shift from pricey, highly urbanized locales to other parts of the country as the national economy improved.
Winners and losers in congressional reapportionment
The constitutionally mandated purpose for the decennial census is to apportion members of the U.S. House of Representatives across the different states based on population—some states gain seats and some states lose them. Map 2 displays projections for these changes based on an extrapolation of the recent census estimates to April 2020. (Download Table E)
Map 2: Projected Change in Congressional Representation, 2010-2020
…
Source: William H Frey projections based on 2010 US Census and 2018 and 2019 census estimates released Dec 30, 2019
This projected redistribution shows gains for rapidly growing states, and losses for more slow-growing or declining states. Two states, Texas (+3) and Florida (+2), would gain multiple seats, while five others, all in the West (Arizona, Colorado, Oregon, Montana) and South (North Carolina) gain one.
Ten states are projected to lose one seat each. The most noteworthy of these is California, which has never lost a House seat via reapportionment. Other states projected to lose seats are located in the Midwest (Minnesota, Illinois, Michigan, Ohio), the Northeast (Pennsylvania, New York, Rhode Island) and slow-growing parts of the South (West Virginia, Alabama).
Because this reapportionment also affects the Electoral College, it might be seen as favoring Republicans, given that states gaining more seats voted for President Trump in 2016. However, a good part of recent population growth in Texas, Florida, Arizona, and North Carolina should continue to be from the Democratic-leaning voting blocs of Latinos or Hispanics, African Americans, and Asian Americans, as well as white college graduates moving from blue states such as California and New York. Thus, it is difficult to predict the decade-long political ramifications of the 2020 census’s congressional reapportionment.
The 2020s and beyond
The new Census Bureau estimates spotlight the tepid growth of the nation’s population. Over the next decade, two factors which contributed to the slow growth of the 2010s—low fertility and an increase in deaths—will continue, as both are associated with an aging population.
Moreover, as the still-large baby boomer population ages into retirement, their dependency on the youth population will increase—and the greatest source of youthful growth will accrue from immigrants and their children. The Census Bureau projects that after 2030, immigration will account for more than half of the nation’s population growth.
What this means is that immigration will become an increasingly important contributor to America’s health moving forward. As the country faces continued population stagnation, the 2020s will become a crucial period for understanding the role of immigrants in our economy and society.
Authors

-
Footnotes
- The projected April 1, 2020 national population extends the growth between the Census Bureau’s January 1, 2019 to January 1, 2020 U.S. population data released on December 30, 2019
- The projected 2020 state populations is determined by extending the July 1, 2018 to July 1, 2019 growth rates—from the new Census Bureau state population data—through April 1, 2020