
After two decades defined by growing integration, the global economy appears to be at an inflection point. This judgment has been prompted both by structural changes in the global economy, especially since the Great Recession, and political events over the past year illustrative of a backlash against past integration. Following one such event—the U.K.’s Brexit vote in June—The Economist magazine reported, in a funereal tone, that globalization now seems to be receding, inspiring comparisons with the rise and fall of globalization a century ago.1
Globalization’s first wave, which lasted from 1870 to 1914, is viewed today as the embodiment of the liberal open economic paradigm. This period saw the spread of international trade, built on the exchange of Western manufactures for developing economies’ primary commodities along low-tariff corridors. The production of those commodities was financed mainly by the West and supported by a stable global exchange rate regime so that capital flowed freely from where it was plentiful to where it was scarce and could reap the highest returns. For instance, around half of all British savings were channeled abroad over this period, while half of Argentina’s entire capital stock was foreign owned by 1914. Migration was virtually unrestricted, with the exodus of Europeans across the Atlantic mirrored by even larger flows of laborers and merchants through North, South, and East Asia.
The retreat from globalization’s first wave was decisive and ruinous. The passage of the Smoot-Hawley Tariff act in the U.S. against the backdrop of the Great Depression set off a retaliatory backlash among the world’s major economies that crippled global trade. A moratorium on the repayment of war debts and reparations saw a drying up of private international lending. Many Western economies imposed controls on the exports of capital, while a number of developing economies defaulted on their liabilities. Economic hardship triggered anti-immigrant sentiment and governments responded by imposing drastic restrictions on newcomers for the first time.
The breaking of globalization’s first wave is proof that the forces of global economic integration are neither irresistible nor irreversible.
The breaking of globalization’s first wave is proof that the forces of global economic integration are neither irresistible nor irreversible. But can we be sure that we are at another turning point?
The essence of globalization is the movement of goods, money, and people across international borders. In this brief, we develop three series that capture this phenomenon over the past 150 years (Figure 1).
Those proclaiming globalization’s demise fall into two camps. Some argue that the process is already underway. Others argue that globalization has reached unsustainable levels as it did a century ago and so a backlash is inevitable.2 Our three series allow us to verify whether globalization’s retreat has begun or not, and to gauge the degree of today’s global economic integration measured against the peak of the early 20th century.
Figure 1.
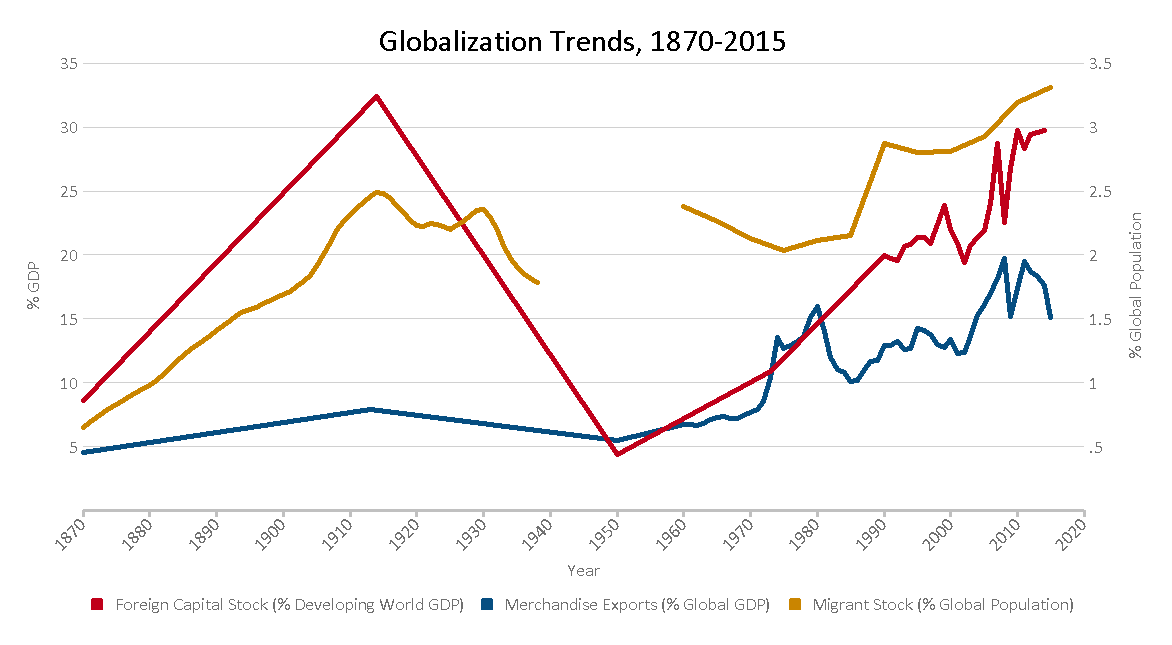
Authors’ calculations based on IMF 2015, Lane and Milesi-Ferretti 2013, Maddison 2001, the Maddison Project 2015, McKeown 2004, McKeown 2010, Riley 2009, U.N. 1999, U.N. 2015a, U.N. 2015b, UNCTAD 2015, U.S. Census Bureau 1975, World Bank 2015, World Bank 2016, and WTO 2016. Merchandise exports and foreign capital stock are expressed in market dollars as a share of global income expressed in international dollars, and will therefore differ with those cited elsewhere.
We find that, while the process of economic integration has slowed, there is only limited evidence so far of an absolute decline. In addition, today’s level of integration matches or exceeds the heights of globalization’s first wave. This could equally imply that globalization has reached unsustainable levels or that no such levels exist.
Generating any global data series over a century and a half is a complicated task. Few data series have complete coverage over space, incorporating all the world’s countries, which raises challenges about representativeness and scaling. Even fewer series have complete coverage over time, so incomplete ones have to be spliced together, which raises issues of comparability. Our results therefore come with numerous, often significant, caveats.
Two specific caveats should be highlighted from the outset—both of which are necessitated by the availability of data and the objective of maximizing comparability within each series. First, one of our three series (goods) is a measure of flows, whereas the other two (money and people) are measures of stocks. The latter provide moderately lagging indicators of globalization’s trajectory. Second, our series for goods and money are expressed in terms that differ from contemporary measures cited in economic reports and the media. Care is therefore required when interpreting the levels reported in our three series.
While these caveats impose limits on what can be reliably inferred from direct comparisons of the two waves of globalization, the process of assembling the three data series is itself illuminating. Each series can be understood as the aggregation of multiple underlying trends whose trajectories vary. Analyzing these trajectories helps explain the factors that are shaping globalization today and provides insights into its likely future.
In the following section, we look at the three series in turn. In each case, we begin by explaining how the series was generated and describing its caveats. We then assess the process of recent integration and the evidence that we are at an inflection point.
Goods
Our series for the international movement of goods is the most straightforward of the three to develop. Historical estimates of the dollar value of global merchandise exports for select years are provided by Angus Maddison. These are spliced together with annual estimates drawn from the World Trade Organization’s contemporary dataset of trade flows beginning in 1960, which covers the vast majority of the world’s countries.3 The series is weighted by global gross domestic product (GDP), expressed in international dollars.4
This last point warrants further elaboration. By presenting export values expressed in market dollars as a share of global income expressed in international dollars, we generate percentages that are out of step with those reported in standard analyses of trade. This unorthodox approach follows that of Maddison and ensures consistency and comparability across historical and contemporary estimates.
At the end of the first wave of globalization in 1913, merchandise exports peaked at 7.9 percent of global GDP.5 That peak was surpassed as early as 1970, when tariff reductions under the General Agreement on Tariffs and Trade were still at an early stage, the standardization of shipping containers was being established, and the rise of export manufactures from the developing world had yet to occur. Goods exports have since been propelled to far greater heights, reaching 19.7 percent of global income in 2008.
That share stood at 15.1 percent in 2015, having declined continuously for the previous four years. Underpinning this decline is a slowdown—not a reversal—in the growth of merchandise trade volumes, combined with low commodity prices and a stronger dollar.
The recent slump in trade growth has not gone unnoticed and has been extensively researched. Both cyclical and structural factors are at work.
The recent slump in trade growth has not gone unnoticed and has been extensively researched. Both cyclical and structural factors are at work. The latter include the exhaustion of gains from both the incorporation of previously-closed economies into global markets and the fragmentation of value chains across borders—commonly referred to as the second unbundling. When cyclical factors reverse, many analysts expect trade growth to resume and the merchandise exports’ share of GDP to stabilize.6
The potential for future trade growth in services, which are excluded from our long-term series, is further reason to doubt that trade’s role in the global economy is bound to diminish. While trade in services is considerably smaller than trade in goods,7 its value as a share of global GDP has doubled in the past 30 years and has proved more resilient during the recent trade slowdown, standing today at record levels (Figure 2).8
Concerns regarding the sustainability of global trade have been heightened by the inability of policymakers to advance multilateral and regional trade agreements. Some advocates of those agreements insist that closing new deals is crucial to unlocking trade growth, especially in services, where the largest barriers remain. In reality, modern trade agreements have become increasingly concerned with how the spoils of trade are distributed rather than with the volume of trade itself. Further trade integration will likely depend as much on technology as policy.
Figure 2.
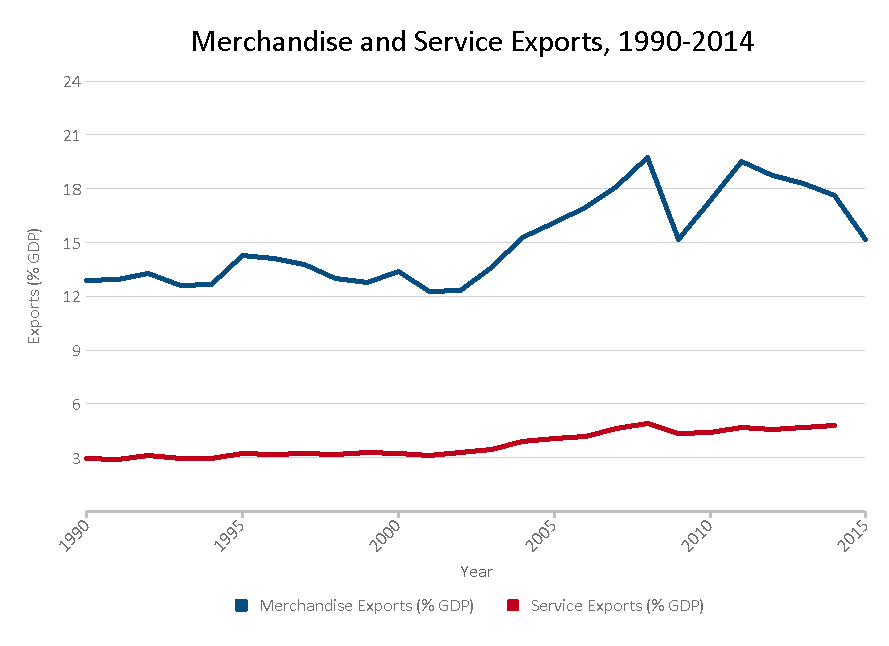
Authors’ calculations based on the Maddison Project 2015, World Bank 2016, and WTO 2016. Merchandise and service exports are expressed in market dollars as a share of global income expressed in international dollars, and will therefore differ with those cited elsewhere.
A more serious concern for trade growth than the failure to agree new trade agreements is the trend towards creeping protectionism using non-tariff barriers. In the absence of improved global growth, that trend could worsen. This risk is real, but for now remains speculative. Although it is possible to envision circumstances under which trade’s share continues to decline, there is more reason to be optimistic as cyclical factors reverse and service exports rise.
Money
Our series for the international movement of money again starts with Maddison. He provides historical estimates of the value of the foreign capital stock in the developing world for a selection of years, based on an assessment of countries’ gross external liabilities.9 Contemporary annual estimates from 1990 onward are built at the country level from independent estimates of external debt, foreign direct investment (FDI), and portfolio equity stocks. These are drawn from a number of independent sources: external debt from the World Bank; FDI from United Nations Conference on Trade and Development; and portfolio equity from the “External Wealth of Nations” dataset developed by Philip Lane and Gian Maria Milesi-Ferretti, and supplemented in the most recent years from the IMF.10 In keeping with the approach for merchandise exports, the series is weighted by developing world GDP, expressed in international dollars. The levels of international capital reported will therefore differ with those cited elsewhere.
Four caveats are immediately worth noting. First, the group of countries that constitute the developing world is held constant across the series in accordance with Maddison’s historical estimates.11 Thus, the series does not attempt to control for rising income levels and includes a small number of countries that are today classified as high-income. Sixteen percent of the group’s GDP is accounted for by high-income countries in 2014. Second, the developing world aggregates are assembled independently for each type of capital based on the available country coverage of each dataset. Of the three types of capital, external debt suffers the most from incomplete coverage.12 Third, estimates of FDI and portfolio stocks do not accurately capture the divergent performance—and value—of these assets over time.13 Fourth, we exclude both remittances and foreign assistance in the form of grants—both important sources of foreign capital for the poorest economies—from our measure to ensure consistency with Maddison’s historical estimates.
Our focus on foreign capital in the developing world only is compelled by the availability of historical estimates, but has the advantage of concentrating our attention on the availability of money in areas where it is relatively scarce. The capital flowing from Western Europe to the New World and the colonies was crucial to the first wave of globalization, and similar dynamics are at play today.14
During the first wave of globalization, the developing world’s foreign capital stock peaked at 32.4 percent of GDP in 1914. The series is honing in on that peak today. Despite falling precipitously during the Great Recession, the foreign capital stock share has since rebounded, and at 30.1 percent, is at its highest level in a century.
Underlying the impressive recent growth of the foreign capital stock are changes in the composition of that stock. In Figure 3, we look beyond the total foreign capital stock share and trace the trajectory of the different types of capital separately.
Related Content


FDI’s rise is a defining component of globalization’s second wave and is synonymous with the growing role of international finance beyond traditional areas such as railways and extractive industries into new sectors including commerce and industry. The value of FDI stock as a share of developing world income has risen almost continuously for the past 25 years, although the rate of growth has diminished since 2012, reflecting lower FDI inflows.15
The growth of foreign-held portfolio equity since 1990 is similarly pronounced but limited to more mature developing economies; the foreign-held portfolio stock as a share of low-income country GDP remains negligible at only 0.4 percent in 2014. In contrast to FDI, foreign-owned portfolio investment in the developing world was hit hard by the Great Recession and has yet to return to its pre-crisis peak.
While foreign capital in the form of FDI and portfolio equity have become an increasingly prominent part of many developing economies, the role of external debt has markedly diminished. This is especially the case for low-income countries where the debt stock as a share of GDP has fallen by two-thirds since 1990. Two factors lie behind this: debt relief, and the nurturing of domestic debt markets through the issuance of debt denominated in domestic currency and the encouragement of purchases by local financial institutions. While in a literal sense these factors reduce the extent of global economic integration and interdependency, they are rightly perceived as a mark of progress in reducing unnecessary exposure and risk.
Concerns about the de-globalization of foreign capital since the Great Recession have centered on a different phenomenon: the reduction in inter-bank lending.16 Its causes are believed to include regulatory changes, weakened bank balance sheets, and reduced access to wholesale funding. The fall has been largely limited to banks in advanced economies and so is not captured by our series. While this is certainly an example of international capital becoming less prominent, it should not overshadow the increasing role of foreign capital in other parts of the world.
Based on our review, the clearest evidence we have of global capital being in retreat is limited to examples of globalization’s excesses being curbed. Elsewhere, the data suggest that the pace of global integration has slowed but not reversed.
Figure 3.

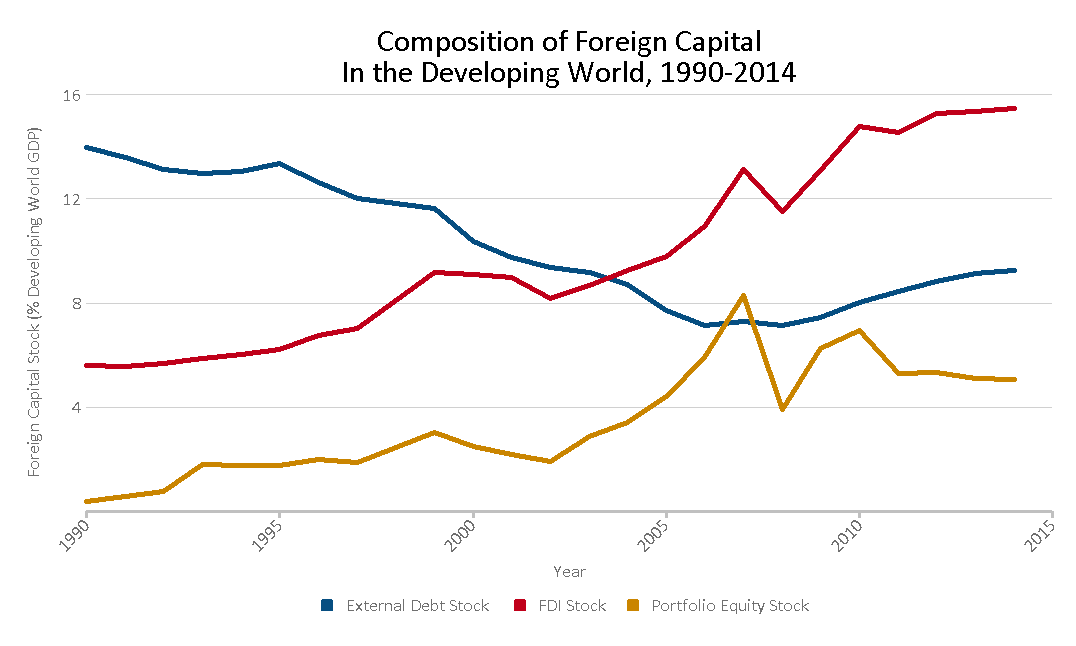
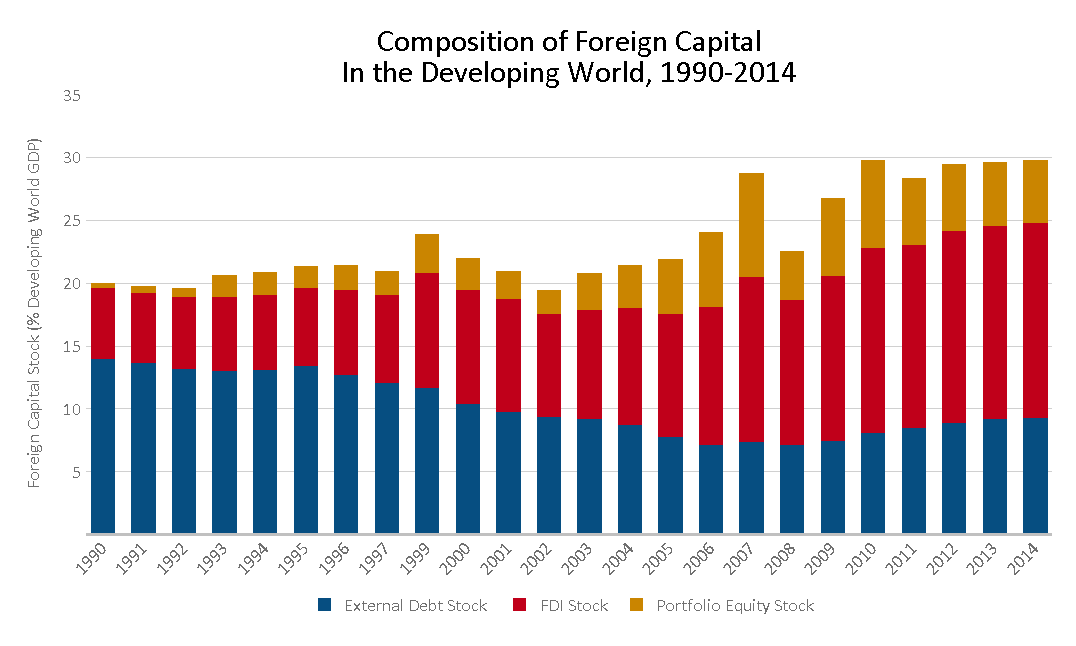
Authors’ calculations based on IMF 2015, Lane and Milesi-Ferretti 2013, Maddison 2001, UNCTAD 2015, and World Bank 2015. Debt, FDI, and portfolio equity stock are expressed in market dollars as a share of global income expressed in international dollars, and will therefore differ with those cited elsewhere.
Migration
Our series for the international movement of people is the most problematic of the three to assemble.
Contemporary data on migration since 1960 are compiled by the U.N. and built from estimates of migrant stocks from national censuses. These estimates are notoriously weak, with censuses differing not just in terms of quality, but in their definition of a migrant. Additionally, estimates likely suffer from downward bias, as restrictions on immigration create incentives for migrants to avoid being counted.
Historical records of migration introduce a different set of problems. Flows—as opposed to stocks—of long-distance migration along certain routes are well documented from ports and customs statistics. Other routes, especially those overland, are not formally recorded. Accounts of short-distance migration are missing altogether for most of the world. Adam McKeown provides the most comprehensive and well-documented estimates of historical migration flows at a global level between 1850 and 1940. His estimates, which are provided for each five-year period, are based solely on known instances of international travel and include some long-distance travel within the same colonial jurisdiction which is not strictly cross-border.
To establish our series, we attempt to convert McKeown’s historical estimates of global migratory flows into stocks so that these can then be compared with contemporary U.N. estimates. This conversion adds together consecutive estimates of migrant inflows adjusting for the age at which migrants migrate, their life expectancy, and their return rate, which we obtain using the best available benchmarks taken from the period. Our benchmark for age at migration is the median age at entry of migrants to the U.S. each year, drawn from official U.S. records. Our benchmark for migrant’s life expectancy is U.S. life expectancy for the respective age, gender, and year of U.S. migrants, obtained again from U.S. records, and discounted by the ratio of U.S. life expectancy at birth to global life expectancy at birth.17 Our benchmark for the migratory return rate is drawn directly from McKeown who reports separate return rates for Chinese migrants, Indian migrants, and European migrants to the U.S.18
Our resulting series of the global migrant stock, which is marked by a gap between 1940 and 1960 when no records of global migration are available, provides an admittedly rough but illustrative account of the movement of people during the past 150 years. At the end of globalization’s first wave in 1914, the global migrant stock is estimated to have peaked at 2.5 percent of the global population, although it stayed close to this level into the 1930s before beginning its descent. The share began to climb again in the 1970s and surpassed its previous peak for the first time in 1988. It rose further in the 2000s and today stands at 3.3 percent. Given the possibility that our historical estimates of the global migrant stock are underestimated, a judicious assessment is that the share of global migrants today has only recently exceeded the levels reached a century ago.19
While contemporary migration at a global level may be comparable to that of a century ago in terms of proportional size, migratory patterns differ vastly across countries and regions. Migrants today come from an increasingly diverse set of origin countries, but over the last half century have concentrated in a shrinking pool of prime destination countries. Migration has therefore “globalized” from the perspective of destination countries but not from that of origin countries.20
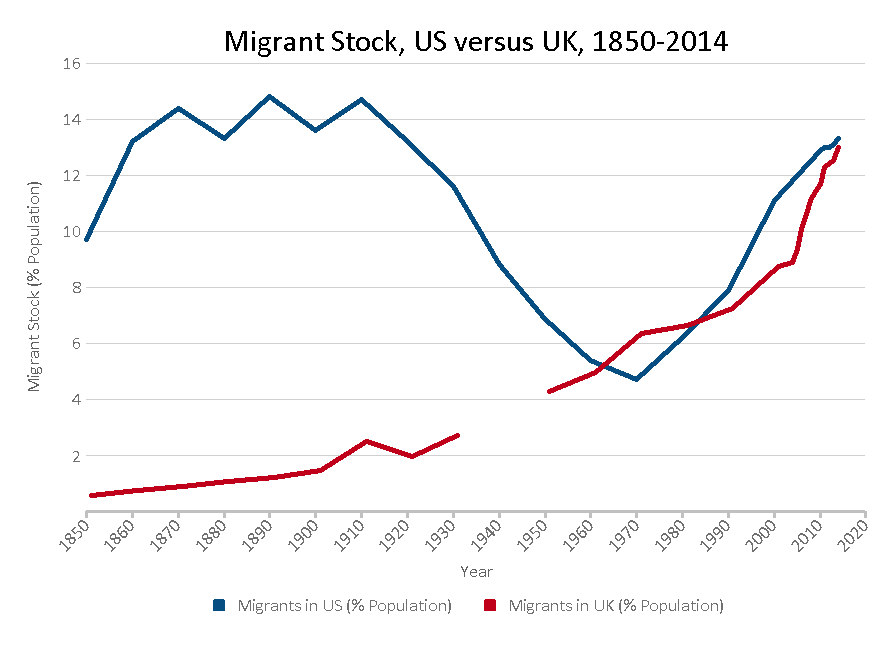
Two popular destinations for migrants—the U.S. and the U.K.—have extensive migration records that allow us to track the size of the migrant stock since the 19th century, and compare across globalization’s two waves, without resorting to statistical manipulations (Figure 4).
The U.S. migrant stock hovered at close to 14 percent of its population throughout globalization’s first wave before falling precipitously. That share has rebounded since 1970 and in 2015 stands a fraction short of its historical high at 13 percent. As a result, the U.S. is the top destination for migrants from some 60 sending countries and is home to one-fifth of the world’s migrants. By contrast, the U.K., which was an important source of migrants in globalization’s first wave, has only emerged as a significant destination for migrants in the post-war era. Its migrant share has risen especially sharply in the last decade and now stands at almost exactly the same level as the U.S.
Much commentary on global migration reinforces the notion that migration is growing unsustainably, driven by formidable emigration pressure from source countries, and that anti-migrant rhetoric will soon lead to anti-migrant policies.21 While our series shows that the share of the global population accounted for by migrants is at an all-time high, it does not corroborate this broader narrative.
Figure 4.
Based on preliminary estimates for 2015, growth of the global migratory stock as a share of the world population has slowed over the past five-year period, especially in the West. Moreover, while the global migrant stock is still rising, it would be wrong to assume this reflects ever increasing flows of migrants. Estimates of migratory flows derived from the U.N.’s migratory stock data suggest that both the absolute number and global share of migration flows has remained relatively stable in the past two decades.22 That means the increasing migrant stock must instead be explained by migrants’ characteristics: a lower age of migration, longer life expectancy for migrants, and/or lower return rates. As for the demand to migrate, modelling exercises up to 2025 forecast diminishing demand from Latin America and Asia, while emigration pressure from Africa will rise.23
This gap between rhetoric and reality is in part because the most visible migrant flows are often not the largest. Refugees, for example, accounted for just 8 percent of the global migrant stock in 2015.24
Of course, the likelihood of a clampdown on migration depends on perceptions of migratory trends—especially those at a national level—not their reality. If recent history is any guide, however, governments are more likely to strengthen their selectivity of migrants than impose absolute restrictions. Over the past 25 years, migration policies have become more discerning of migrants’ skills, class, and nationality while simultaneously allowing for a greater volume of migrants overall.25 If the political backlash against migration ultimately focuses on restricting small but highly visible flows, then we should not expect global migration as a whole to decline.
Conclusion
Table 1 summarizes the results from our three series, comparing the degree of global integration across globalization’s two waves. On two of the three measures, the degree of globalization is continuing to rise based on the most recent available data, contrary to the claim that globalization is receding. And on two of our three measures, the global economy is more globalized today than during the peak of the early 20th century. Whether that implies globalization has reached unsustainable levels, or that no such levels exist, remains to be seen.
Table 1: Benchmarking globalization across two waves
 Authors’ calculations based on IMF 2015, Lane and Milesi-Ferretti 2013, Maddison 2001, the Maddison Project 2015, McKeown 2004, McKeown 2010, Riley 2009, U.N. 1999, U.N. 2015a, U.N. 2015b, UNCTAD 2015, U.S. Census Bureau 1975, World Bank 2015, World Bank 2016, and WTO 2016. Merchandise exports and foreign capital stock are expressed in market dollars as a share of global income expressed in international dollars, and will therefore differ with those cited elsewhere.
As global economic integration continues, the composition of globalized stocks and flows evolves. The shifts in trade growth from goods to services, in foreign capital away from debt to FDI and portfolio equity, and in migration towards a more diverse set of origin countries concentrated in a shrinking pool of prime destination countries, represent defining features of the modern global economy.
While globalization is not yet in retreat, it seems likely that globalization is at an inflection point. The past two decades have been described as an era of hyper-globalization during which both the level and rate of global integration was judged as having intensified. Based on our analysis, it is reasonable to conclude that this period is over. The debate then is what will emerge next. Our speculative assessment is that the coming years will be characterized either by stabilization in the level of globalization, or further growth in the degree of integration but at a more modest pace than in the past.
Authors

-
Footnotes
- The Economist, 2016a.
- The Economist, 2016b.
- Country coverage from the WTO dataset accounts for 99.7 percent of global GDP in 2015. For countries where a very small number of years are missing data, data points are filled in through interpolation or extrapolation. New countries are included from the year in which they achieved independence.
- Historical GDP estimates, published by Maddison, are expressed in international dollars based on the 1990 ICP. Contemporary GDP estimates, published by the World Bank, are expressed in international dollars based on the 2011 ICP. Our confidence in the comparability of the two series is boosted by the fact that the two sources generate very similar estimates of global GDP for 1990: $27.1 trillion using Maddison’s series and $27.6 trillion using the World Bank series (both expressed in current prices). An advantage of using Maddison’s historical trade estimates, among several alternative sources available, is it means we rely on a common data source for trade and GDP.
- It is possible that this share was greater in 1929 when the value of global trade was 35 percent above that in 1913 (Federico and Tena-Junguito 2016). But, without an estimate of global income, we are unable to verify this. For the same reason, the extent of the subsequent withdrawal from global trade in the early 1930s is not captured by our series.
- See, for instance, Hoekman 2015.
- The share of trade in services in GDP is considerably larger (both in absolute terms and relative to trade in goods) when measured in value added terms, since services are increasingly embodied in the production of traded goods. See discussion in Subramanian and Kessler 2013.
- Data coverage for service exports is especially limited for earlier years. The global service exports data presented in Figure 2 incorporate countries from the first year their data becomes available.
- These estimates are therefore not concerned with external assets such as outward investments and foreign currency reserves.
- The External Wealth of Nations dataset on portfolio equity stocks ends in 2011. Estimates of net portfolio equity flows are available from 2012 onward from the IMF’s Balance of Payments Statistics. To estimate portfolio equity stocks after 2011, subsequent years’ data flows are added onto 2012 stock levels, after discounting stocks by an estimated rate of depreciation. This depreciation rate is imputed from a comparison of stocks and flows data between 2000 and 2010. For countries that are missing from the IMF statistics, the portfolio equity stock as a share of GDP is assumed to remain unchanged after 2011.
- The group consists of all countries in Africa, Latin America, and Asia, excluding Japan.
- The developing world aggregates for each type of capital are assembled from all countries that have complete estimates between 1990 and 2014. For countries where a very small number of years are missing data, data points are filled in through interpolation or extrapolation. Countries for which external debt estimates are missing account for 19 percent of developing world GDP in 2014.
- In the case of portfolio stocks, Lane and Milesi-Ferretti assume that their value grows and declines in line with the domestic stock market. There is no consistent approach for capturing changes in the value of FDI stock in UNCTAD’s estimates. See discussion in Fujita 2009. The unmeasured divergence in asset value, known as dark matter, accounts for the inability to reconcile stock and flow data in current account statistics, and, in part, the existence of persistent global imbalances. See Hausmann and Sturzenegger 2007.
- One important difference today is the role of capital from other developing countries, which our measure captures.
- See discussion in IMF 2016 which reports a lower inflow of capital into emerging economies in the post-crisis period.
- Forbes 2014.
- Global life expectancy at birth estimates are obtained from Riley 2009.
- Return rates are published in McKeown 2010 and applied to migratory flows in McKeown 2004.The return rate for European migrants to the US is applied to all transatlantic migration. The return rate for Chinese and Indian migrants is applied to their respective countries. A weighted average of the return rate for all three groups is applied to North Asian migration. The returnees counted in return rates are believed to include both migrants and their offspring born in the destination country. We assume migrants have children at a rate consistent with global population growth in this period. See U.N .2009.
- The fact that migrants make up a greater share of the global population today than they have in the past does not immediately imply that a greater share of people are now migrating per year. Global life expectancy is dramatically higher than a century ago which means that the ratio of migrant stocks to flows is likely much larger.
- Czaika and de Haas 2015.
- See, for instance, Skidelsky 2016.
- Abel and Sander 2014. Preliminary modeled estimates indicate that the number of global migrant flows dropped by 20 percent between 2005-10 and 2010-15. See Abel 2016.
- Hatton and Williamson 2009.
- UN 2015a.
- de Haas, Natter and Vezzoli 2016.