Current proposals in Congress to overhaul our nation’s immigration system include changes to our temporary foreign worker programs. In this arena—one of the most contentious aspects of reform—the challenge is to balance the legitimate needs of employers for a reliable, flexible workforce with protections for both native and foreign workers. In our current system, temporary workers can be high skilled, such as those who enter on the well-known H-1B visa, or lower skilled, such as those who enter as seasonal workers in agriculture, hospitality, recreation, or landscaping. Proposed changes to the law add fraud and abuse prevention measures as well as worker protections while simultaneously increasing the number of workers allowed to enter. The Senate has also proposed a new program that would admit workers with less than a bachelor’s degree to work in year-round jobs with the option to become permanent residents if sponsored by an employer.
This analysis—part of our “Immigration Facts” series— presents data on the numbers, occupations, and geographical distribution of temporary workers, along with a look at proposed policy changes.
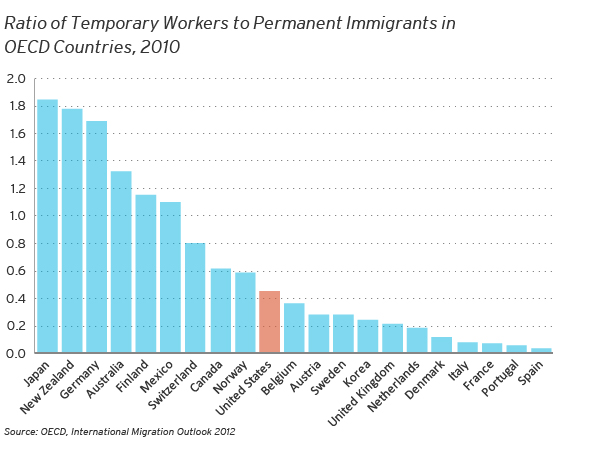
1. The United States receives a relatively low ratio of temporary foreign workers to permanent immigrants compared to other developed countries.
Many countries around the world have temporary foreign worker programs (also called guest worker programs) to help fill gaps in their labor markets. These workers are often brought in to do physically demanding jobs, such as those in factories, construction, or agriculture. Among OECD countries, the United States ranked in the middle for its ratio of temporary foreign workers to permanent immigrants who arrived in 2010, about 4 to 10. Japan, New Zealand, Germany, Australia, Finland, and Mexico admitted more temporary workers than permanent immigrants, while other OECD countries saw more permanent immigrants arrive than temporary workers.
2. About 600,000 visas were given to temporary workers and their families in 2012. This is compared to about 1 million individuals who were granted legal permanent residency.
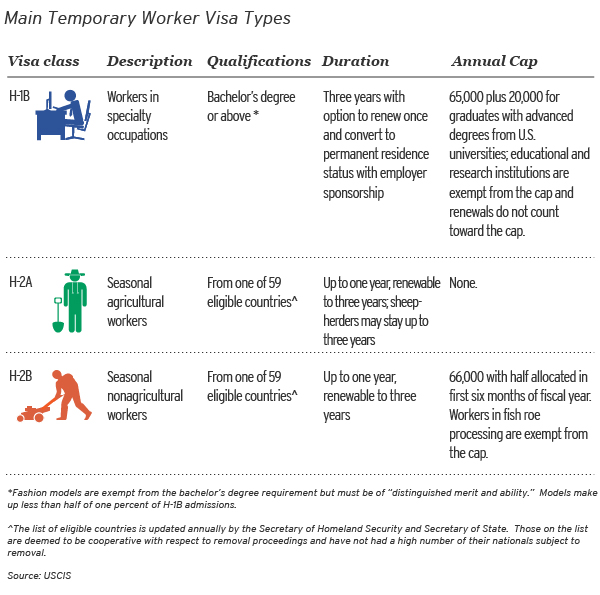
Current United States immigration policy allows for the issuance of visas for a variety of temporary workers: athletes and entertainers, religious workers, intra-company transferees, treaty traders, foreign media workers, those in specialty occupations, and agricultural and seasonal workers. Among the plethora of temporary worker visa types, this analysis will focus on the major category for temporary workers, the H visa. Its three subtypes—H-1B, H-2A, and H-2B, explained below—are receiving the most focus in the current reform debate and together accounted for 54 percent of all visas issued for temporary workers in 2012.
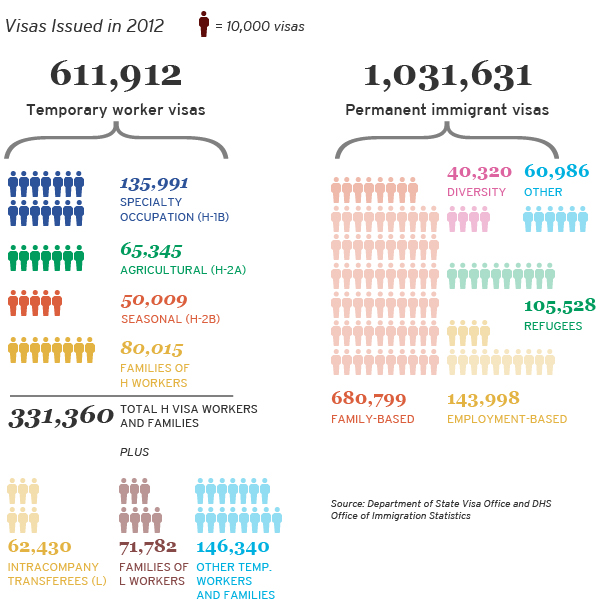
Among the approximately one million people who obtain permanent residency each year, about two-thirds gain admission based on family ties, while about 13 percent—some 140,000 people—are sponsored by employers. Five percent are admitted under the diversity visa program (given to immigrants from historically under-represented countries) while refugees and asylees make up about ten percent of those gaining green cards. The link between temporary and permanent immigration is strong: in 2012, 53 percent of green cards were given to individuals who were already living in the U.S. in some kind of temporary status.
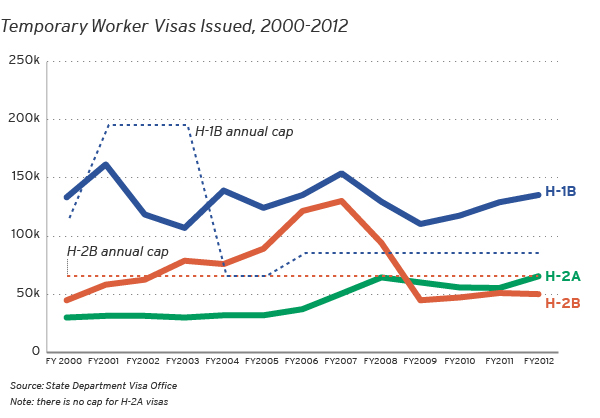
3. Since 2000, among the three main temporary worker visa programs, H-1B visa issuance has been the highest, equivalent to the number of visas issued for H-2A and H-2B visas combined.
H-1B visa issuance has fluctuated with economic trends. Between 2001 and 2003—during the height of the dot-com boom—Congress temporarily raised the H-1B cap from 65,000 to 195,000. Following the dot-com bust, H-1B issuance dipped and has since fluctuated with the economic cycle. Agricultural employers have notoriously shunned the H-2A program, citing its high cost and burdensome red tape. Only ten percent of farm jobs are estimated to be filled through the H-2A program, while 55 percent of farm workers are estimated to be working without legal status. Thus, despite there being no cap on H-2A workers, visa issuance remained the lowest of the three H visa classes up through 2008, after which the decline in H-2B issuance led to H-2A surpassing its non-agricultural cousin. H-2A usage began a steady climb after 2006, perhaps due in part to increased enforcement at the U.S.-Mexico border reducing the supply of unauthorized farm laborers from Mexico and Central America. At the same time, prices for some crops rose, which may have motivated employers to build worker housing to comply with the H-2A program requirements. H-2B visa issuance started out the decade significantly lower than the annual cap of 66,000, but grew steadily during good economic times. For three years (2005–2007) returning H-2B workers were not counted against the annual cap, which allowed their numbers to climb. The expiration of this provision, combined with the onset of the Great Recession in 2008 triggered a drop in H-2B usage, and it has remained steady since then.

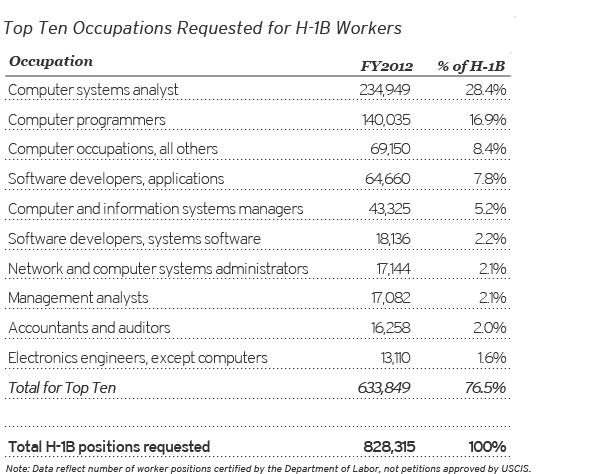
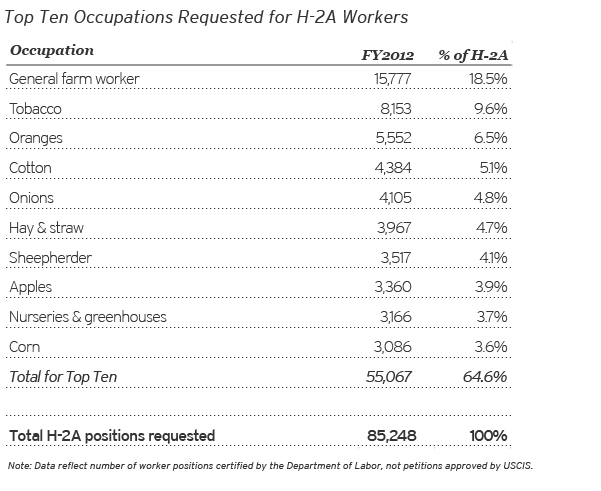
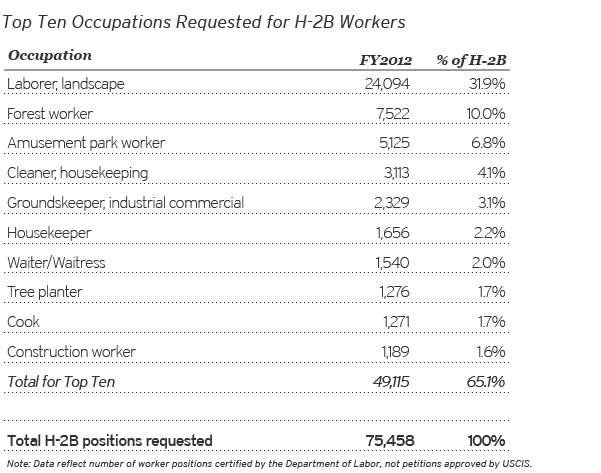
4. Demand for H-1B workers is heavily concentrated in computer occupations, while H-2B workers are recruited for jobs in landscaping, forestry, amusement parks, and housekeeping. The top crops for H-2A workers are tobacco, oranges, cotton, and onions.
Currently, in order to hire an H-1B worker, an employer must first file an application with the Department of Labor, listing the occupation, job location, and number of workers requested. In 2012, the top ten occupations requested by employers for H-1B workers made up three quarters of all requests. Computer-related occupations dominated, comprising over 70 percent. Management analysts, accountants, and electronics engineers were also among the top ten occupations.
The ten most requested occupations for H-2A workers comprised 65 percent of all requests in 2012. Almost one in five H-2A requests were for general farm laborers, while others specialized in particular crops. The crops with the most H-2A workers reflect the geographic pattern of H-2A usage across states (see next section).
The top ten requested occupations for H-2B workers comprised almost two-thirds of all H-2B requests in 2012. Given the seasonal or intermittent nature of the work for which the H-2B program was designed, the most commonly requested occupations are for outdoor work or other jobs in the leisure and hospitality industries.
5. The geographic distribution of temporary workers in the U.S. varies by type.
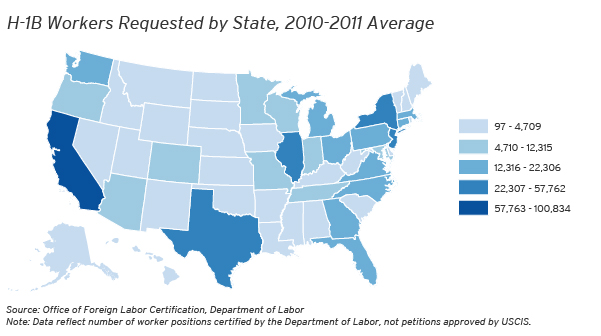
H-1B worker requests are the most concentrated, with 17 percent coming from employers in California. Almost two-thirds (65 percent) of H-1B requests come from ten states spread across the country: California, New York, Texas, New Jersey, Illinois, Massachusetts, Pennsylvania, Florida, Ohio, and Washington. Each of these states ranks 14 or higher for its total population; seven are among the ten most populous, and three others (New Jersey, Massachusetts, and Washington) are home to high-tech hubs.
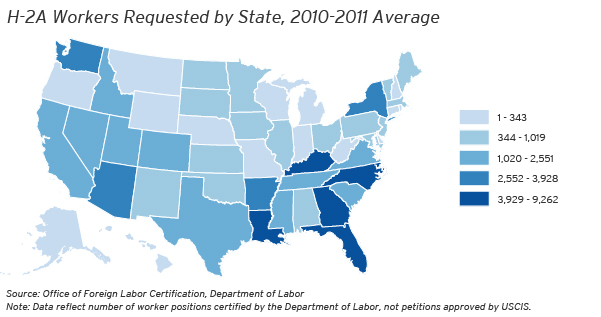
Sixty-one percent of H-2A workers are requested by employers in ten states, mostly in the Southeast: North Carolina, Louisiana, Georgia, Florida, Kentucky, New York, Arizona, Washington, Arkansas, and Virginia, with North Carolina alone accounting for 12 percent of requests. In these states, agriculture plays an important role but employers may not have easy access to a supply of unauthorized workers who make up the majority of agricultural workers nationwide and particularly in states like California and Texas.
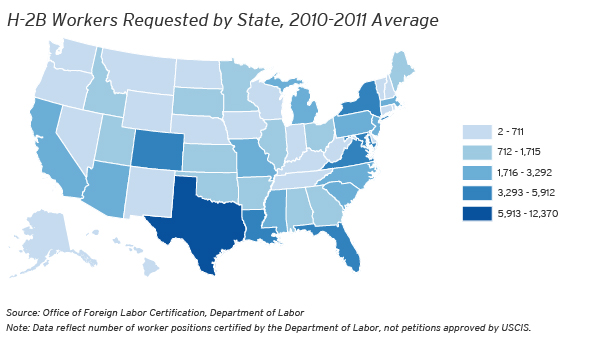
Fifteen percent of H-2B workers requested went to Texas in 2010-2011, with the top ten states accounting for 56 percent of all requests: Texas, Florida, Louisiana, Virginia, Maryland, Colorado, New York, Pennsylvania, North Carolina, and Massachusetts. The type of work requested by employers varies by location. In Texas, Colorado, and Pennsylvania, for example, requests for landscapers and groundskeepers predominate, while Massachusetts and Florida employers request H-2B workers mainly for jobs in hospitality. Lifeguard and pool service workers rank among the top occupations requested in Maryland and Virginia, while crab meat processers rank high in North Carolina. Meat trimmers (including seafood) rank high in Louisiana, Virginia, Maryland, and North Carolina. Among New York employers’ top requests were animal caretakers and stable attendants
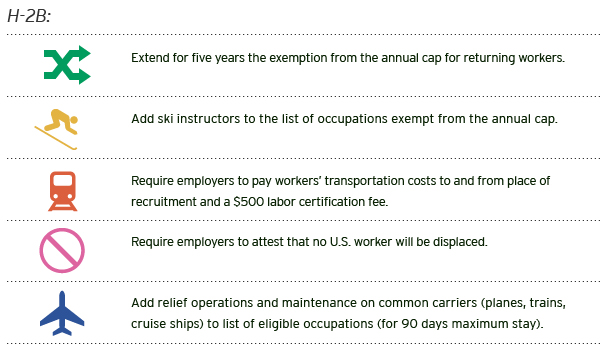
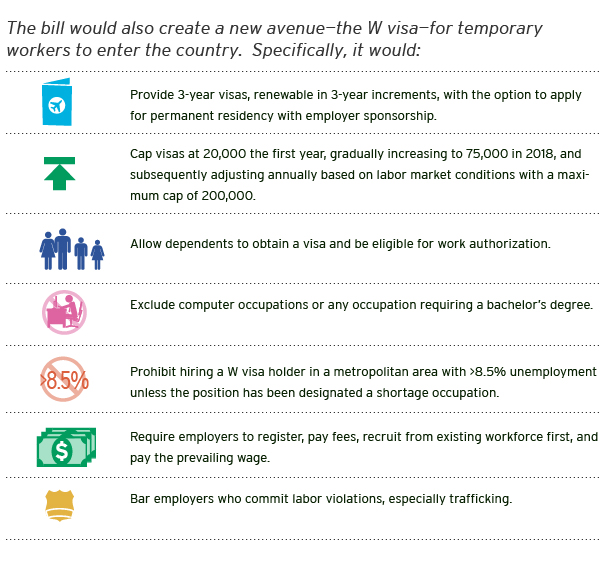
6. Immigration reform proposals now under Congressional consideration would make significant changes to the nation’s temporary worker programs.
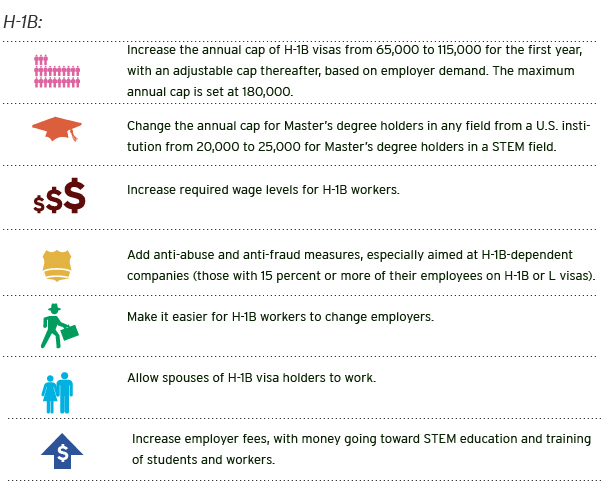
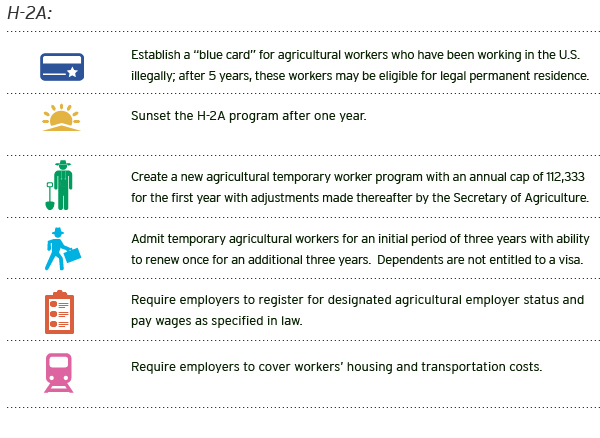
The amended Senate bill (S.744) would make changes to the three H visa programs:
Graphics by Christopher Ingraham
Related Content


Related Books