
Exports increased in most of metro America in 2017 amidst rising uncertainty in national trade policy
Even as the largest economy in the world, the United States must continue to export goods and services to take advantage of the fact that 85 percent of economic growth will occur abroad over the next five years.
Local economies—whether large metropolitan areas, smaller cities and towns, or rural areas—also depend on exports to support growth and well-paying jobs. Since 2010, the Brookings Export Monitor has estimated goods and services exports as part of a Global Cities Initiative, which seeks to strengthen the international competitiveness and connections of cities and metro areas. In this latest installment, we examine recent exporting trends across the country as well as take a deeper dive into the connection between politics and national trade policy; in particular, we analyze how local economies are implicated in the recent round of Chinese tariffs on U.S. exports.
To view or download export data at the county, metro, state, or national level, please click here.
Exports grow in 2017, especially in energy metro areas
In 2017, the U.S. economy exported nearly $2 trillion in goods and services, which accounted for 10.3 percent of GDP and supported 12.7 million total jobs or 8.4 percent of U.S. employment. Exports increased by 2.3 percent from 2016 to 2017, slightly below overall GDP growth of 2.4 percent. The country’s 2017 export intensity has still not surpassed its peak of 11.8 percent of GDP in 2011 but is higher than it was in 2003 (7.9 percent).

Oil and gas and manufacturing exports accounted for most of U.S. export growth in 2017, which reflects a bounce back from a poor manufacturing year in 2016. At a regional level, the South grew exports at the fastest clip (4.7 percent) relative to the West (0.7 percent), Midwest (0.8 percent), and Northeast (1.6 percent). Exports of oil and gas and manufacturing products primarily drove southern export growth, accounting for $13 billion and $12 billion, respectively. Incredibly, exports in these sectors from the South alone accounted for 58 percent of the nation’s export growth.
Most exporting occurs in the nation’s metropolitan areas. Of the 12.7 million export-related jobs, 11 million concentrate in metro areas. And, like the nation, exports grew in the nation’s metro areas, although export intensity remains below its 2013 peak of 11.5 percent at 10.0 percent. Three-quarters of the nation’s 381 metro areas experienced positive export growth in 2017, including 77 of the nation’s 100 largest metropolitan areas.
Energy-intensive metropolitan areas expanded exports in 2017 at the fastest rate, including New Orleans (12.5 percent annual export growth), Houston (9.6 percent), and Baton Rouge (6.2 percent). Each of those metro areas are among the most export-intensive in the nation.
By contrast, metro areas that specialize in aircraft, travel and tourism, and pharmaceuticals exports showed much slower growth. The steepest annual export declines occurred in Toledo (-4.1 percent), Wichita (-4.1 percent), Seattle (-3.5 percent), and Honolulu (-3.8 percent).
Overall, notwithstanding the bounce-back year for manufacturing exports and the energy export surge, the trade profiles of the nation’s 100 largest metropolitan areas continue to evolve toward services. From 2003 to 2017, the services share of exports in these markets increased from 38 to 47 percent. Meanwhile, manufacturing accounts for 55 percent of national exports overall, but over the longer term manufacturing exports have not been expanding at the same rate as sectors like finance, technology, tourism, and education and medical services.
Politics and trade, inextricably linked
These industrial transitions are central to understand the trade policy dynamics at play under the Trump administration.
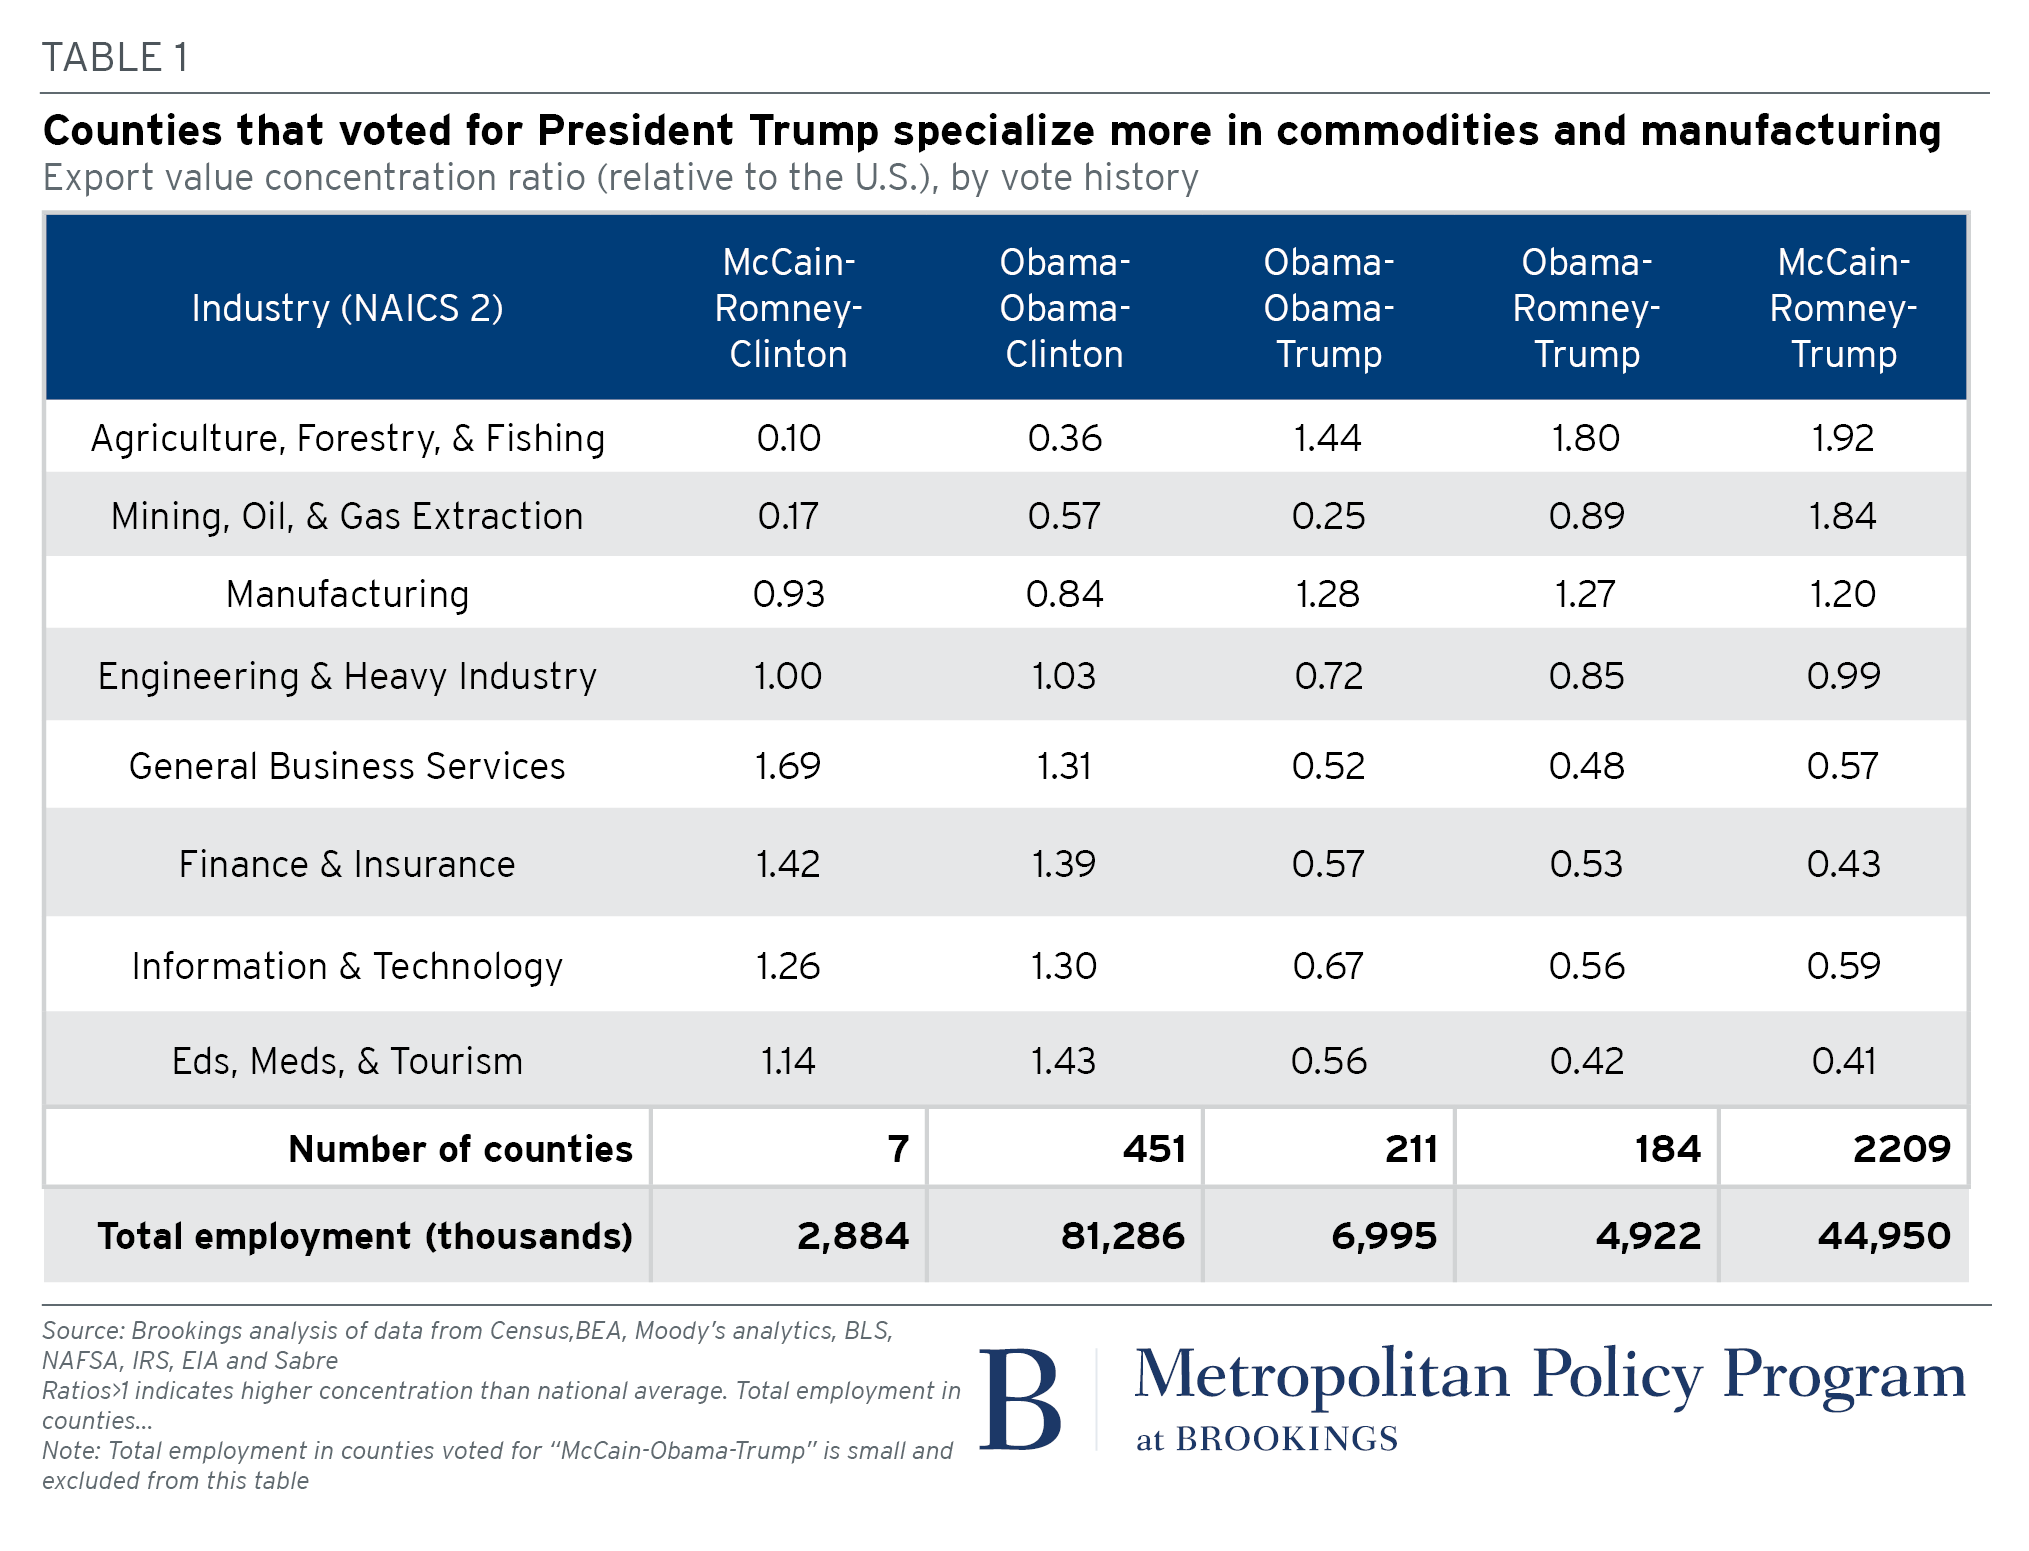
Table 1 illustrates how the industrial structure of communities aligns with voting patterns in the most recent presidential elections. Republican voters, in general, are much more likely to live in counties that specialize in commodities and manufacturing, while Obama and Clinton voters are much more likely to live in counties specializing in services.
President Trump put trade front and center of his campaign agenda, drawing support from voters whose local communities most intensely bore the brunt of trade-related job losses.
Trump swing counties—meaning those counties that voted for President Obama in 2008 and 2012, and then flipped to President Trump in 2016—have a 44 and 28 percent higher export concentration in agriculture and manufacturing, respectively, than the nation as a whole. These sectors were more exposed to trade competition than advanced services such as finance, tech, and education and medical services. Moreover, Trump swing counties happen to host industries most severely harmed by the last 40 years of unfavorable exchange rates for exporters and offshoring (issues that he directly acknowledged during his campaign).
Our conclusion is not that the economic and industrial circumstances in their communities was the only, or even the primary, reason voters supported President Trump. However, the patterns above provide some striking relationships between voter behavior and the industrial makeup of their surrounding counties. And it is not illogical to conclude that campaign promises to negotiate better trade deals likely resonated with these voters given the industries that drive job growth (or job decline) in their communities.
U.S.-China trade war: Which communities are on the front lines?
Which brings us to the present moment. Campaign promises around trade have evolved into specific proposals to introduce higher tariffs on select products from major trading partners, most prominently China.
China has responded by threatening import tariffs on 234 products. Recently, our colleagues examined where the industries that produce those commodities concentrate, noting that there were about 2 million jobs in those industries nationwide. But not all those jobs are tied to trade nor are they tied to trade with China.
To extend that analysis, we converted the 234 products to four-digit NAICS industry definitions and examined the share of overall U.S. exports in tariff-affected commodities among each four-digit industry going to China. For instance, aircraft were included in China’s tariff list, so we estimated the share of total U.S. aircraft exports that go to China using national trade data. We then assigned that national ratio to each U.S. county.

Based on this method, we estimate that there are about 150,000 direct export jobs that are affected by the Chinese tariffs. But those jobs support an additional 150,000 jobs, which means that there are a little under 300,000 jobs that are directly implicated by the Chinese tariffs. The difference between this estimate and the 2 million estimate from our colleagues is that our analysis attempts to isolate those jobs that are dependent on exports to China in those industries.
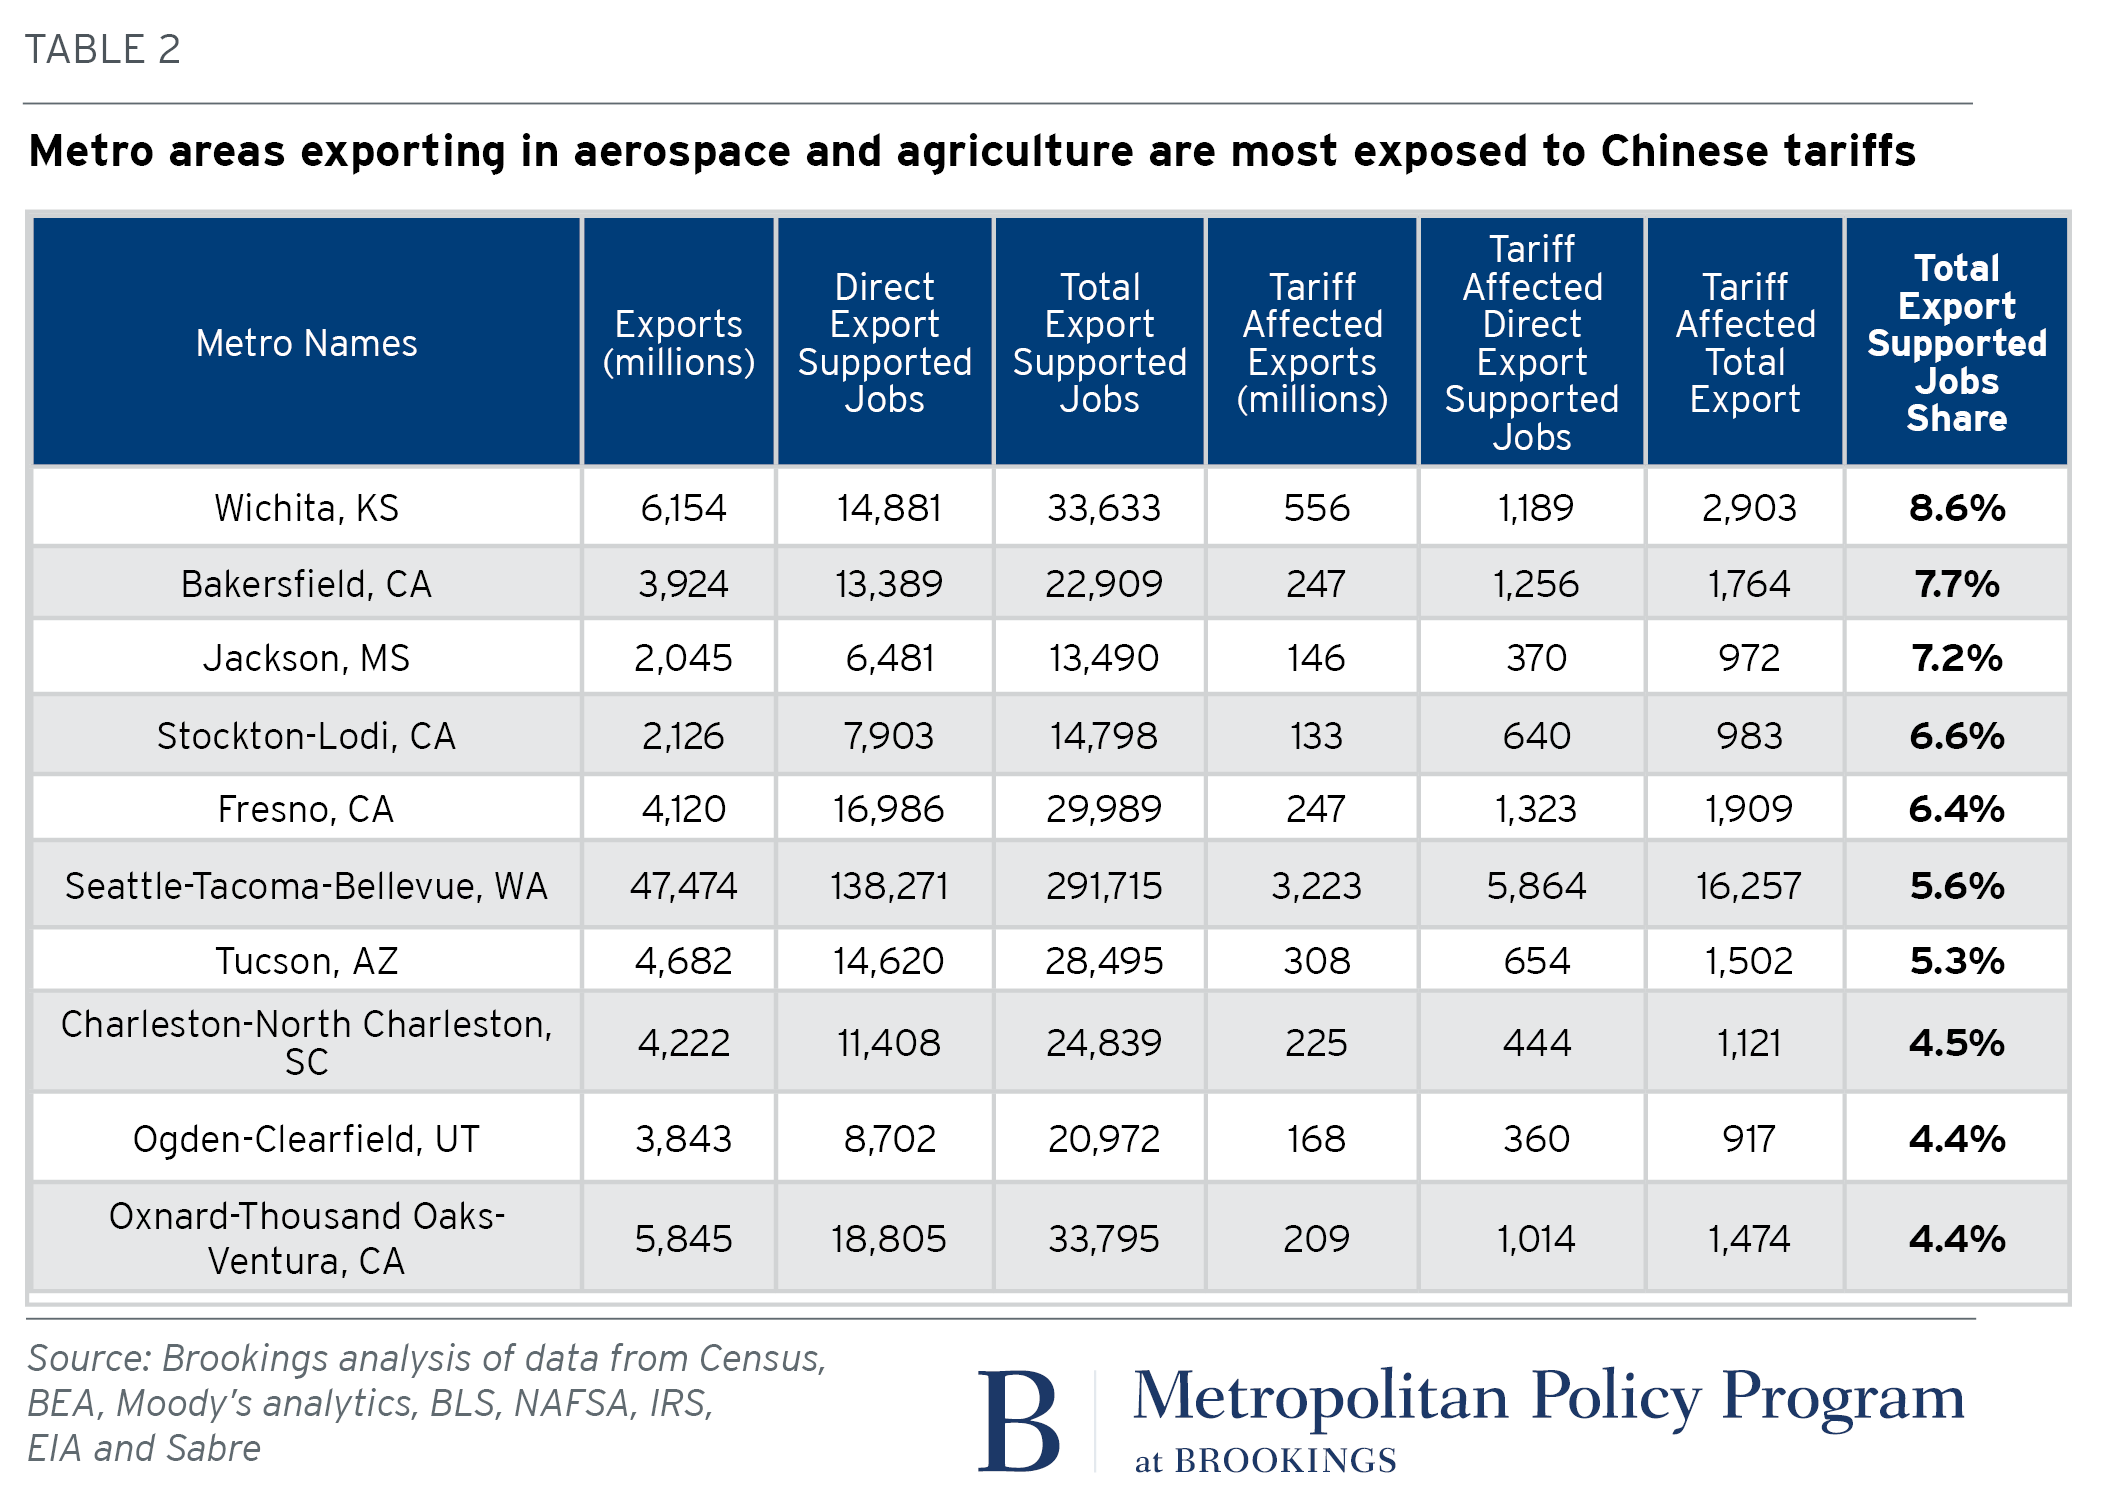
Metropolitan areas that specialize in agriculture, aerospace, and automotive manufacturing are most exposed to the Chinese tariffs. The metro areas with the largest share of tariff-affected export jobs are Wichita, Kan. (8.6 percent of export-supported employment, 2,900 jobs), Bakersfield, Calif. (7.7 percent, 1,800 jobs), Jackson, Miss. (7.2 percent, 1,000 jobs), and Stockton, Calif. (6.6 percent, 1,000 jobs). Seattle has, by far, the highest total number of jobs at risk, with just over 16,000.
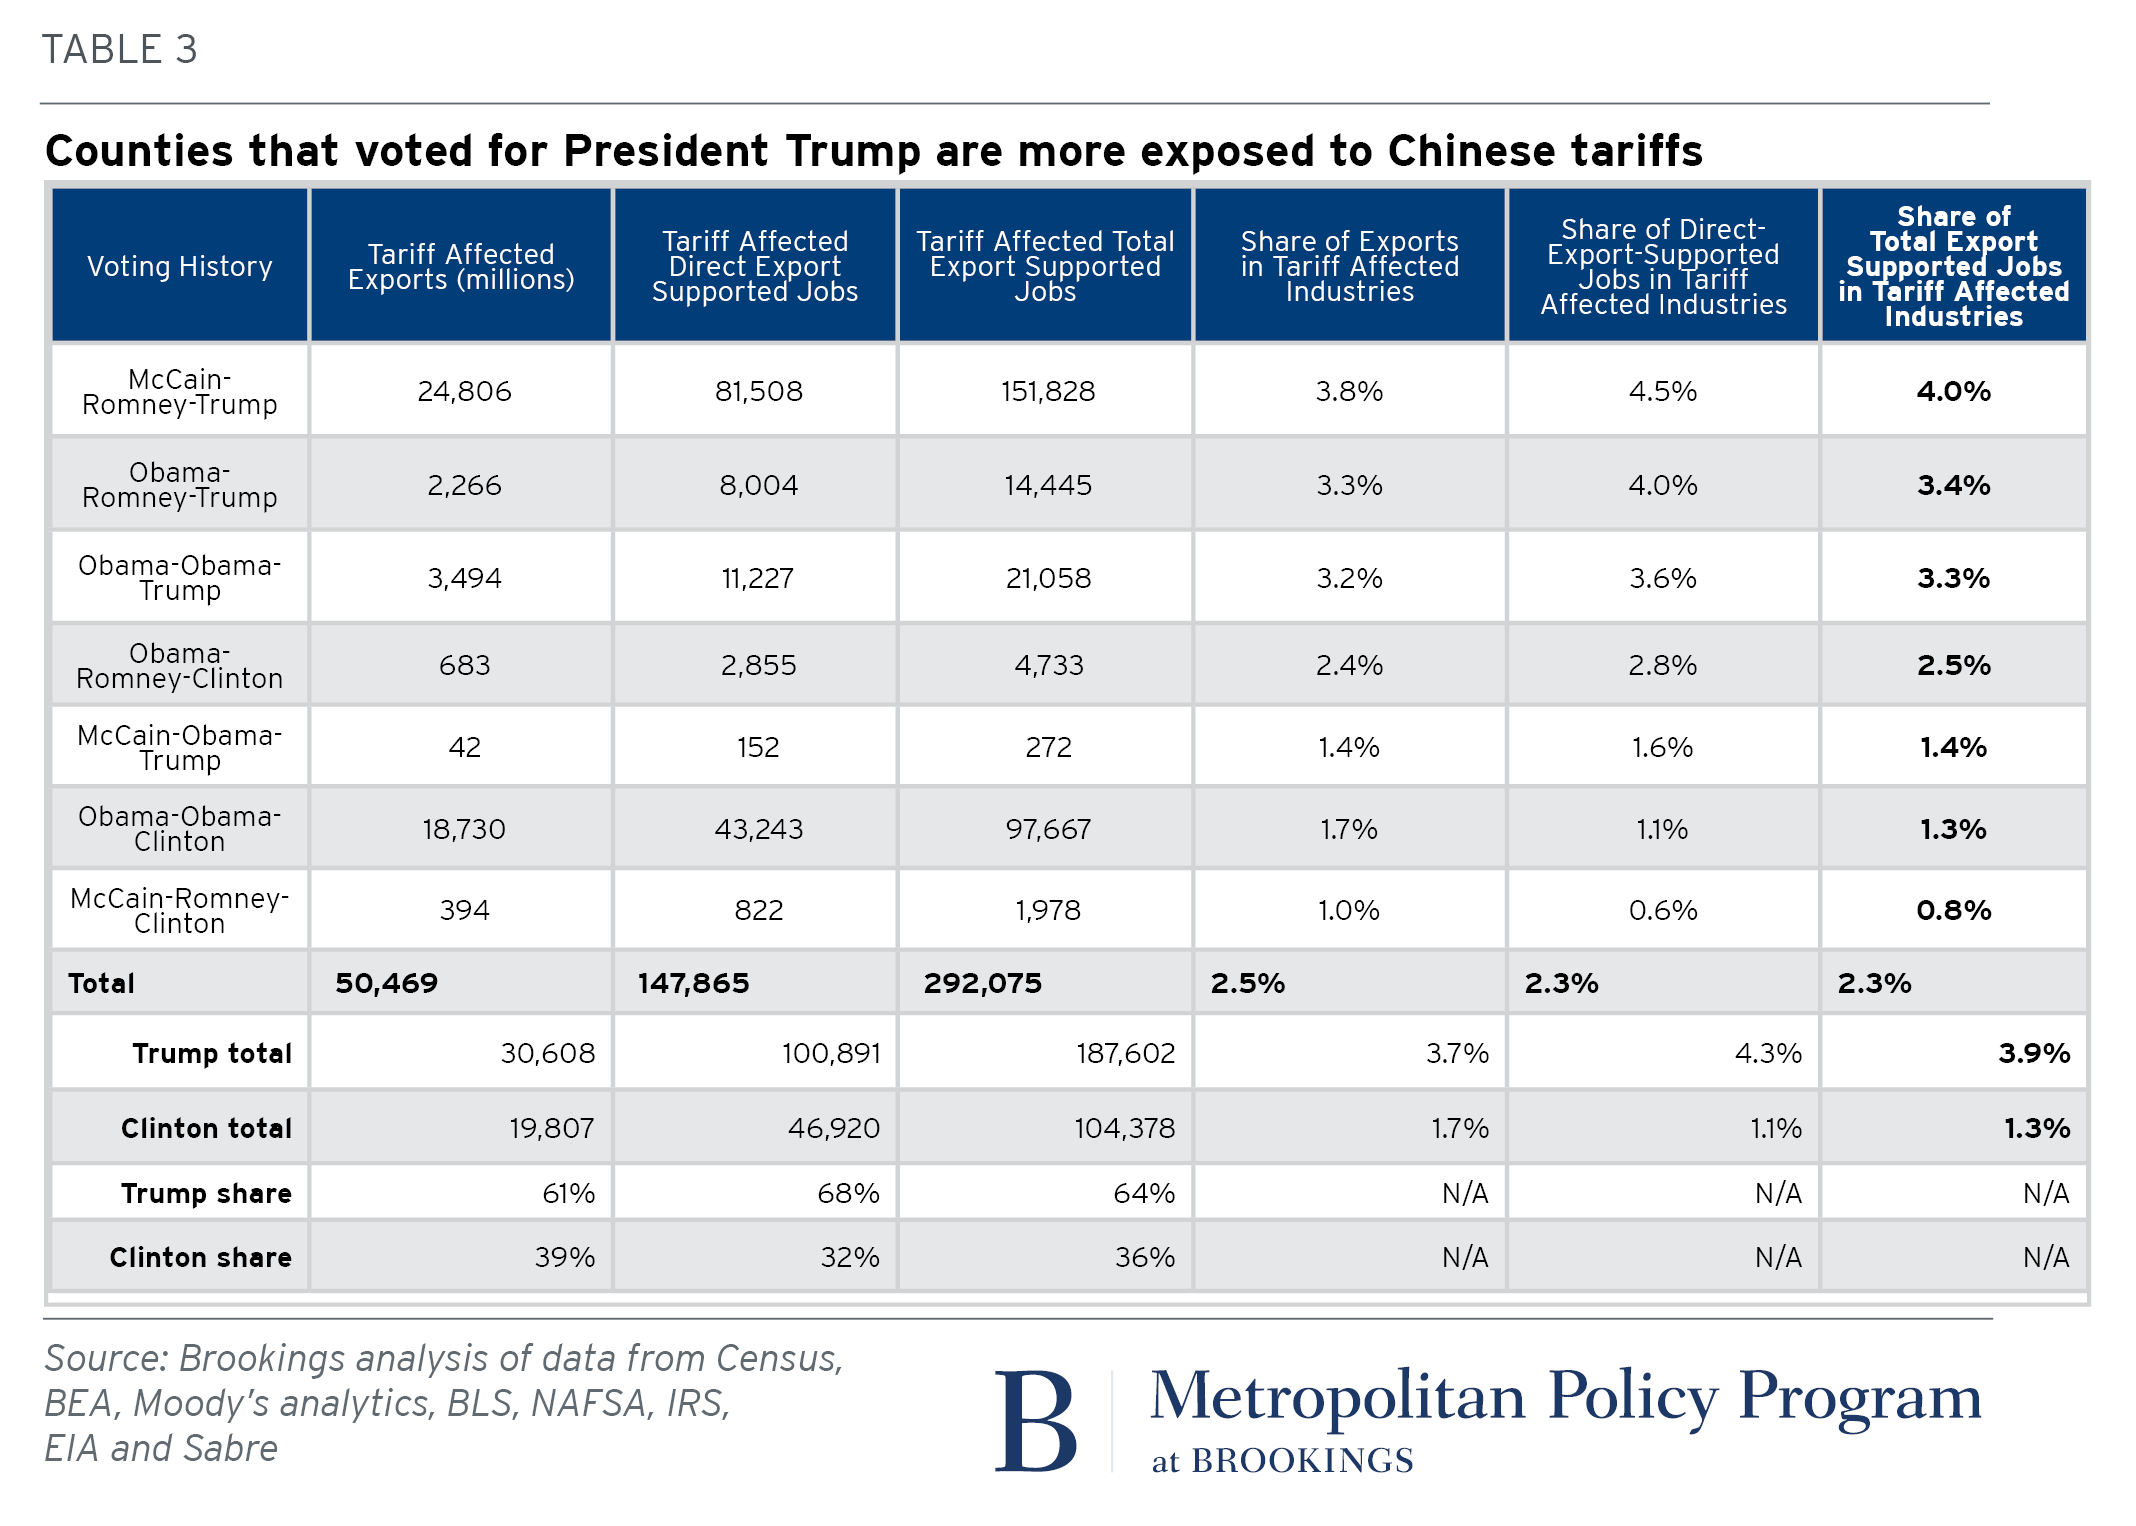
The metro areas listed above represent a cross-section politically—from redder parts of the South and Midwest to bluer districts in metro areas in California and Washington. While a diversity of places will be implicated, counties that voted for President Trump are more exposed to the Chinese tariffs, as measured by the share of exports in tariff-affected industries (3.9 percent) and the direct and indirect jobs those exports support (187,600). Comparatively, in counties that voted for Clinton, 1.7 percent of exports are in tariff-affected industries, which support 104,000 direct and indirect jobs. Moreover, Trump counties will bear the brunt of the tariff costs accounting for 60 percent of the export value at risk, 68 percent of direct export supported jobs at risk, and 64 percent of total export supported jobs at risk.
This analysis of metro-level exports comes at a time of great trade policy uncertainty. Currently, the relatively short product list means that the impact of the U.S.-China imbroglio is not yet widespread enough to inflict significant economic damage. Yet, our analysis suggests that the result of the Trump administration’s tariffs on China are countervailing measures by the Chinese that would disproportionately target the export base of communities that elected the president. While not yet a full-fledged trade war, the rumblings between the world’s two largest economies is yet another signal of a new era in U.S. trade policy, one that local and state leaders ought to be watching closely.
The authors thank Max Bouchet and Sifan Liu for research assistance.
The Export Monitor is made possible by the Global Cities Initiative, a joint project of Brookings and JPMorgan Chase to help metropolitan leaders grow their regional economies by strengthening international connections and competitiveness. GCI activities include producing data and research to guide decisions, fostering practice and policy innovations, and facilitating a peer-learning network. Brookings recognizes that the value it provides is in its absolute commitment to quality, independence and impact, and makes all final determinations on its own scholarly activities, including the research agenda and products. To learn more about the Global Cities Initiative, visit the homepage here.
Related Content


Authors