

The idea of equal pay for equal work—that workers should be compensated equally for performing work of the same substance and quality—underpins the long struggle against workplace discrimination in the United States. In a recent public address at Brookings, Senator Kirsten Gillibrand said that “On average, a woman earns 77 cents on every dollar a man earns and even less for women of color. African-American women earn 69 cents on a dollar; Latinas earn 58 cents on the dollar.”
Equal pay for equal work is an idea that surely has widespread acceptance, despite vigorous debate about how to accurately measure whether different peoples’ work is truly equal and the appropriate role of public policy in ensuring equal pay for that work. The field of public education has a checkered history on the subject; women in this line of work were paid less than men for many years.[i] The pay increase given to teachers with a master’s degree was originally part of the compromise by which an organization representing predominantly male high school teachers (many of whom had master’s degrees) agreed to merge with organizations representing mostly female elementary teachers to form New York City’s United Federation of Teachers in 1960.[ii]
The discriminatory impact of this compromise lessened as the gender gap in master’s degree attainment narrowed, and more subtle means of discrimination were hampered by nearly universal adoption of the uniform salary schedule, with teachers’ pay based only on experience and education. It’s easy to argue that the current system provides equal pay for unequal work, as two teachers with the same education and experience can vary widely in their effectiveness in the classroom. Likewise, it also provides unequal pay for equal work, because teachers with different levels of experience and education can work just as hard and be just as effective. But, in general, salaries within a given school system should not systematically favor teachers from some demographic groups over others.
Like in most professional occupations, the compensation of teachers includes more than just a base salary. The retirement benefits of teachers, and of other public employees, have received increased scrutiny in recent years over concerns about the fiscal sustainability of defined-benefit pension plans and the peculiar incentives they create. Teachers do not earn pension benefits equally over their careers. In many states, teachers receive very little benefit for most of their careers, with huge increases later on, followed by decreases for those who remain in the profession beyond a certain point.
Do these pension systems run counter to the goal of equal pay for equal work? The answer to this question with regard to gender is not obvious. On one hand, women live longer than men, on average, and therefore tend to collect their pension benefits for more years. On the other hand, pension systems disproportionately reward very long-term employees, which may disadvantage women if they are more likely than men to spend time out of the workforce.
The ideal dataset to address this question would track teachers from the beginning of their careers through retirement, and include information on their demographics (including gender) and public school employment for each year. To my knowledge, no such dataset is publicly available. I instead undertook a simulation exercise based on: estimated workforce participation histories in a nationally representative dataset; and the features of Ohio’s pension plan for teachers. I chose Ohio because the details of its plan are well documented in previous research, and its features are fairly typical of defined-benefit plans in many states. The simulation estimates the retirement benefits that would accrue to Ohio teachers if they were to have careers that look like college-educated respondents in the national dataset. The details of the data and methodology, which is based on work by Costrell and Podgursky, are explained in the appendix below.
This simulation allows me to measure, for a given group of workers, how average benefits might differ between men and women. My primary measure is the pension benefit teachers earn as a percentage of their lifetime earnings. It is important to divide by lifetime earnings in order to adjust for different career lengths. If I just looked at the pension benefit on its own, it might look larger for a given group of teachers simply because they worked for more years. Comparing the pension benefit as a percent of earnings of men and women allows me to see whether they receive equal pay for equal work, where equal work is measured as having the same lifetime earnings.
The results are displayed in the figure below, which shows the pension benefit rate for each age of separation (when the employee stops working, if they are still working at that point) for men and women. Benefit rates are fairly similar through the early 50s, but the spike at age 55 (when Ohio teachers become eligible for early retirement) is significantly greater for men than it is for women. The simulation indicates that the average man who retires at 55 will receive a pension benefit worth 23 percent of his lifetime earnings, as compared to 19 percent for the average woman.
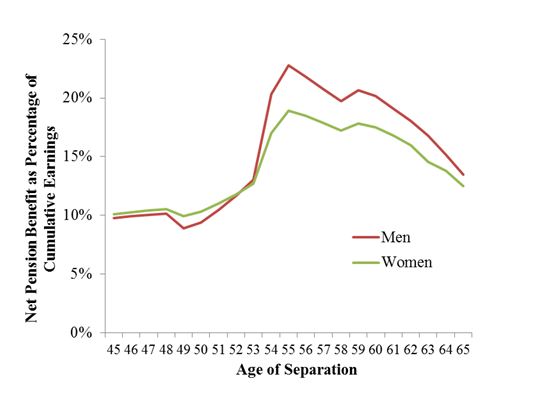
A difference of four percent may not seem like much, but it is substantial because it is expressed in terms of lifetime earnings. The simulation indicates that if women were to receive an additional four percent of lifetime earnings in pension benefits, it would be worth roughly $70,000 in 2014 dollars—more than the maximum annual teacher salary in the typical Ohio school district.
Another way to put it is that the average woman who retires at age 55 receives 85 cents in pension benefits for each dollar received by the average man. This difference narrows in subsequent years, but retirement benefits decline as gains from additional years of teaching are more than offset by the reduction in the number of years benefits will be received. Women who retire at age 60 receive 87 cents on the dollar in pension benefits, a total penalty of just under $60,000. For those who work until age 65, the penalty falls to $26,000, but the overall benefit rate also decreases significantly.
Why do teacher pensions appear to fail the equal pay for equal work test? The main reason is that women are more likely to spend time out of the workforce than men, and defined-benefit pension plans like the one in Ohio tend to punish teachers who fail to meet specific targets, such as 30 years of service. In my dataset, the average man was working for 96 percent of the included years, as compared to 75 percent for the average woman.[iii] Teachers who leave the workforce often cannot make up the lost benefits because benefit increases from additional years of work are offset by fewer years of benefit receipt.
An important caveat to my results is that the simulation is based on several assumptions. For example, I assume that teachers’ careers resemble those of the typical college-educated worker. In reality, teachers may find it easier to balance their job and a family, and thus spend less time out of the workforce, or may enjoy more flexible family leave policies, and thus spend more time at home. How the specific working conditions of teachers differentially impact the careers of men and women is unclear.
The gap in workforce participation between men and women in my analysis, which followed workers beginning when they were age 25 in 1982-1989, may well have declined in more recent years. But it is worth highlighting the differences in pension benefit rates not just across groups, but also within groups. Consider two hypothetical women: one worked every year beginning at age 25 and the other worked most years but spent seven years out of the labor force.[iv] If both women retire at age 55, the first will receive a pension benefit worth 40 percent of her total earnings, whereas the second’s will only be worth 26 percent (equivalent to 65 cents on the dollar). The second woman can never catch up to the first—the best she can do is work until age 61, when her benefit rate tops out at 32 percent of total earnings. It is hard to argue that these two teachers received equal pay for equal work.
Public pension systems have received a lot of bad press based largely on shortfalls in funding brought about by political mismanagement and a bad economy. But the truth is that many of these systems are fundamentally unfair in their treatment of different employees. Efforts to fix these systems are badly needed, both to ensure that they are still there for future retirees and to provide benefits in a way that is fair to all employees. There are no easy solutions, but the principle of equal pay for equal work should be front and center in any responsible reform effort.
Methodology Appendix
My analysis is a simulation of pension benefits based on the parameters of Ohio’s defined-benefit pension plan for teachers (as described by Costrell and Podgursky) applied to workforce participation histories in the National Longitudinal Survey of Youth (NLSY). I restrict my extract of the NLSY data to respondents who had at least a bachelor’s degree in 1988 (when they were 25-31 years of age) and responded to all survey waves (throughout the analysis I apply the appropriate panel weights for this subgroup of initial respondents).
I use wage and salary data from 1988 to 2010 and classify respondents as participating in the workforce in a given year if they had earnings of at least $20,000 (in 2014 dollars, with the threshold adjusted for inflation using a rate of three pecent). NLSY collected data biannually from 1994 to 2010; for these years I impute missing values (i.e. the odd years) as the average of the adjacent years. I impute respondents’ post-2010 work participation status (through age 65) as being the same as their 2010 status. In other words, I assume that those who were working in 2010 (when they were age 46-53) continue to work through retirement, and that those who were not working that year never re-entered the workforce.
I restrict the analysis to respondents who were working (according to my definition) at age 25, leaving a final sample of 618 respondents (279 men and 339 women). The panel dataset I create follows these individuals from age 25 through age 65.
I apply a typical salary schedule for Ohio from 2008-09, adjusted for each year based on a 2.5 percent annual rate of growth. Respondents are assumed to start at the bottom of the salary schedule at age 25, and increase one step for each year that they participate in the workforce (according to my definition). Education (whether they have a master’s) is measured in the NLSY, with missing values imputed using the most recent previous year.
My simulation calculates the retirement benefits that would accrue to teachers in the Ohio pension plan whose patterns of employment in the Ohio public schools match those of the NLSY respondents. For each respondent, I calculate the present discounted value of their pension benefit at a given age of separation from teaching based on the pension plan description in Costrell and Podgursky (particularly Table 2, which shows the replacement factor for each combination of years of service and age). Benefits are discounted to the age of separation using a rate of two percent (a five percent discount rate minus a three percent cost-of-living adjustment). To simplify the calculations, I use yearly discounting (rather than monthly) and assume that individuals live with certainty for a period equal to their life expectancy at the age of separation according to the Social Security Administration’s 2009 Period Life Table (rather than applying the probability of living to a given age by the benefit that would be collected at that age).
I also calculate each respondent’s simulated cumulative lifetime earnings, discounted to the age of separation. I then take the ratio of the value of the pension benefit to lifetime earnings, which is the gross pension benefit rate. I subtract off the 10 percent that employees contribute to pensions to obtain the net benefit rate (the actual value of the benefit provided to employees).
I calculate the average benefit by gender for each year of separation from 45 to 65. For individuals who exit the work force prior to a given age of separation, their estimated pension benefit and cumulative earnings are simply the relevant values discounted to that point in time.
[i] David B. Tyack, The One Best System: A History of American Urban Education, Cambridge, MA: Harvard University Press, 1974, pp. 59-65.
[ii] Paul E. Peterson, Saving Schools: From Horace Mann to Virtual Learning, Cambridge, MA: Harvard University Press, 2010, p. 111.
[iii] These statistics are based only on observations of actual workforce participation (not the years in which participation is imputed based on 2010 participation, as explained in the appendix).
[iv] Specifically, she was not in the labor force at ages 27, 30-31, 34-36, and 44.