
The economist Robert Solow noted that “there is no shortage of talk about the middle class”—and that was 10 years ago. Concern about the fate of the middle class is now almost universal. But there is nothing approaching a universal definition. There is a kaleidoscopic range of definitions of the middle class, from a wholly subjective set of aspirations to a highly specific measure of household income, and everything in between.
Disagreements over who counts as middle class are not merely scholarly quibbles. It is difficult to describe the condition and challenges of the middle class without some clarity about who comprises the group in question. The crucial questions we need to answer are: why are we analyzing the middle class and its shifting fortunes, what are the main challenges they face, and how can the quality of life of the middle class be improved? All of this requires a reasonably clear idea of who we are talking about.
This doesn’t mean slavishly adopting only one narrow criterion, to be used at all times. In the final analysis, any definition of the middle class will be more or less arbitrary. But it does mean identifying the middle class with sufficient precision to be able to accurately measure progress, as well as develop and assess policy. For scholars, the value of any definition depends on the question they are trying to answer.
Our new Future of the Middle Class Initiative will be settling on a working definition soon, and we would love to hear from you. Please add your own views on this question below, and/or contact [email protected]. In this paper, we describe the various approaches to defining the middle class, along with their pros and cons.
Related Content
2018
Three Ways to be Middle Class
Is middle-class status a reflection of economic resources, especially income or wealth? Or is it denoted more clearly by occupational status and/or educational attainment? Is it, rather, a state of mind, a set of aspirations, or revealed through behavior, cultural tastes, or by certain kinds of consumption? Is it a question of how we define ourselves? What is the difference between the middle class and the working class? Does the term carry implicit racial connotations, an unspoken “white” prefix always hovering before “middle class”?
Scholars working in different disciplines come at this definitional question from various angles. Sociologists typically emphasize occupational status and/or education. Philosophers and anthropologists tend to focus on culture, education, and power. Economists largely rely on definitions related to wealth or income. Our goal here is not to argue that any of these definitions or boundaries are right or wrong. Simply that each will delineate a different group, leading potentially to different diagnoses of trends, challenges, and opportunities, and therefore sometimes to rather different policy solutions.
Definitions of the middle class (and indeed of classes generally) tend to fall into one of the three broad categories, based on economic resources; on education and occupation status; or on attitudes, self-perception, and mindset. Determining whether you are “middle class” requires different information for each of these three categories. For the first (cash), we need to see your bank balance. For the second (credentials) we need to see your résumé. For the third (culture), we need to see inside your head.
- Cash: economic resources, especially income, wealth, freedom from poverty
- Credentials: educational achievements and qualifications, occupational status
- Culture: attitudes, mindset, behavior, self-definition
These definitions will of course overlap with and reinforce each other. Levels of education, for example, are highly correlated with income (through earnings), and becoming more so. People doing jobs with a certain social status are likely to define themselves as middle class. Aspiring to college or having a saver mentality are likely to lead to a bigger bank balance, and so on.
But it is important to be as clear as possible about which of these three broad approaches we are adopting for a particular purpose, especially when it comes to policy. We examine a range of approaches under each of these three broad headings, occasionally suggesting ways in which their selection can influence research findings and/or policy priorities.
Class = Cash
Economists tend to favor class definitions that are based on financial indicators, especially on income. This is partly for convenience, since data on income are widely available, and partly because income tends to be highly correlated with the other trappings of social class, such as economic security, education levels, and consumer preferences. We start by looking at income-based definitions, before turning to those focused on wealth, and briefly discussing other related approaches.
Some authors are careful to avoid the word class when focusing solely on income. Gornick and Jäntti, for instance, write the middle class “might more accurately be described as those households that fall in the ‘middle’—that is, in the middle of the income distribution.” Similarly, Williams and Boushey call their group, which is primarily defined as everyone between the bottom third and the top fifth of the income distribution, the “missing middle.” Among most economists, however, the term middle class has largely become synonymous with middle income.
The question then is which incomes count as those in the “middle.” Even among scholars working solely with income definitions, there is no consensus. As Atkinson and Brandolini gently put it: “There is…a certain penumbra surrounding the definition of middle class.”1 The edited volume in which their essay appears contains no fewer than ten income-based definitions.
Income-based definitions themselves tend to rely on one of four main approaches:
- Distance from the median (e.g. from 75 to 125 percent of median income)
- Range of the distribution (e.g. income quintiles 2 to 4)
- Distance from poverty (e.g. above 150 percent of the federal poverty lin3)
- Absolute purchasing power (e.g. $10 to $100 per person per day in purchasing power parity terms)
Note, too that there are many different ways of defining and measuring income. Should we look at market income, or disposable income after transfers and taxes? Should we adjust incomes for household size, and if so how? Which measure of inflation should we use to generate “real” income figures? How should we treat households who report zero income? What data source is the least likely to suffer from underreporting? And so on.
For the purposes of illustrating different income-based definitions of the middle class in this paper, we use data from the Current Population Survey Annual Social and Economic Supplement on pre-tax household money income, adjusted for household size using square root equivalents, and expressed in 2016 dollars using the PCE deflator (see more details in the Technical Note below).
Median Income
Trends in median income are often used as a litmus test for middle-class progress. “The clearest indicator of the continuing struggles of the middle class,” write researchers from the Center for American Progress, “has been the failure of the national median income to rebound to pre-recession levels and its overall decline over the past 14 years.” Likewise, when the Census Bureau revealed that its estimate of median household income rose to $59,039 in 2016, the Washington Post reported: “The incomes of middle-class Americans rose last year to the highest level ever recorded by the Census Bureau.”
While the economic circumstances of the median household can be a useful indicator of overall economic health, changes in median income must be understood in the context of changes in the composition of U.S. households, such as shrinking family sizes and the aging of the population. The condition of the “typical” U.S. household also tells us little about the size or diversity of the middle class.
In terms of looking at the middle class as whole, it is generally more useful to examine households within a certain income band around the median. In one of the most widely cited definitions of the last five years, Pew Research Center defines the middle class as all households with incomes between two-thirds and twice the national median. Alan Krueger has popularized an income band of 50 to 150 percent around the median. Several researchers have used Lester C. Thurow’s narrower range of 75 to 125 percent; Birdsall, Graham, and Pettinato, for example, apply the 75/125 band to 30 countries’ median incomes to identify “the middle strata in income terms in each country.” (Others have extended the upper bound to 200 percent or even 300 percent of median income.)2 The Pew, Kreuger, and Thurow definitions might seem fairly similar, but they capture quite different slices of population. The middle class may include households making as little as $35,000 or as much as $139,000 in household-of-three equivalents, and include between 23 and 48 percent of households:

Note that the income ranges we show here are not necessarily the same as the ones produced by these authors themselves. They may each use a different source of data for the income distribution, and/or take a different approach to defining households, adjusting for household size, and so on. Our goal here is simply to show the results of applying various definitions to the same income distribution.
Under a median income approach, the size of the middle class can change over time. For instance, Pew finds that the share of adults in the middle class fell from 61 percent in 1970 to 50 percent in 2014. Other income bands tend to reveal a similar shrinkage, but with different baselines: under Krueger’s definition, the share of households in the middle class declined from 50 to 42 percent over roughly the same period (1970 to 2010).
It is tempting to interpret these findings as a “weakening” or “hollowing out” of the middle class. But this might depend on where the formerly middle class households end up. Of the 11 percent of adults who exited the Pew middle class between 1971 and 2015, 4 percentage points fell into the lower class and 7 percentage points moved into the upper or upper-middle class. This may be evidence of greater income polarization, as described by Foster and Wolfson, but not necessarily of a “weakening” of the middle class.3 A more positive spin on the data is that the share of adults who are at least middle class is rising.
Another common indicator of middle-class welfare is the share of income going to middle-class households. Again, some care is needed here. If the size of the middle class shrinks, then the income share will almost certainly shrink as well, without anybody necessarily being any worse off. The per-capita share of income could be declining, rising, or staying the same. Income share is a more telling indicator when the share of households in the middle class is held constant, as in definitions based on percentiles of the income distribution.
Range of the Income Distribution
Rather than tying the definition of the middle class to median income, some scholars prefer to look at a fixed slice of the distribution. A common approach is to divide the population up into fifths by income to produce quintiles. The middle class can then be defined as some combination of these quintiles. The narrowest definition consists only of the middle quintile: in 2016, this group ranged from an annual pre-tax household income of $55,000 to $85,000 in household-of-three equivalents. (Note that this is nearly identical to the income range for households between 75 and 125 percent of median income.)
A broader and commonly used definition of the middle class includes the middle three quintiles, encompassing 60 percent of all households. In this case, middle-class incomes range from $30,000 to $130,000. Others prefer to use two quintiles: Reeves and Busette identify a “lower-income” middle class as the second and third income quintiles, or those with incomes between $30,000 and $85,000. Perotti goes in the opposite direction, choosing the third and fourth quintiles.
Defining the middle class based on income quintiles is particularly appealing because the income statistics released by the Congressional Budget Office, arguably the premier source of estimates on income inequality and tax burdens in the U.S., are reported by quintile. Still, some economists depart from the quintile approach to define their own percentile ranges. Estache and Leipziger place the middle class within the 30th to 90th percentiles of a given country’s income distribution.4
Under a percentile-based definition, the share of households in the middle class is fixed over time. This means that for every household that moves into the middle class, another must move out—either rising into a higher class or falling into a lower one. The “strength” of a percentile-based middle class is often measured as the share of income going to middle-class households. The benefits of this approach include its simplicity and its consistency over time, but these are also its major drawbacks: because the share of the population in the middle class is fixed, shifts in the shape of the income distribution itself tend be lost.
Distance from Poverty
The third income-based approach defines middle-class status in terms of distance from poverty. Stephen Rose calculates the lower income bound for the lower-middle class as 150 percent of the federal poverty level (FPL) or about $30,000 for a family of three. Sawhill and Haskins set the bar at 300 percent of the FPL for entry into the middle class.5 These kinds of definition have the advantage of coinciding with a conceptual definition of the middle class: if we consider middle-class households to be “those ‘comfortably’ clear of being at-risk-of-poverty,” as Atkinson and Brandolini write, then defining the middle class as households above and below certain multiples of the federal poverty level makes intuitive sense. However, the selection of a multiple is far from an exact science. Atkinson and Brandolini document that some authors have used an upper threshold of nine or ten times the poverty line, which maps to approximately 300 percent of median income. Rose sets the boundary between the middle and upper-middle classes at five times the poverty level, or just under $100,000. Applied to our distribution of household income, this covers nearly the same half of households included in Krueger’s median income definition.
It is worth noting that “federal poverty level” is often applied to two different measures: federal poverty thresholds published by the Census Bureau, and federal poverty guidelines published by the Department of Health and Human Services. The guidelines are simplifications of the thresholds and are primarily used for administrative purposes, such as determining eligibility for financial assistance programs. We use the Census Bureau thresholds based on the Official Poverty Measure, which sets the poverty threshold as three times the cost of a minimum food diet in 1963, adjusted for inflation using the Consumer Price Index. Alternatively, the Supplemental Poverty Measure preferred by many scholars takes into account current spending on food, housing, and other necessities, as well as geographic differences in the cost of living and the effects of taxes and in-kind benefits on household resources. The intuition of all of these approaches is to define the minimum income necessary to achieve a certain standard of living; and for the middle class standard of living to be seen in terms of a certain distance from poverty.
Absolute purchasing power
The fourth income-based approach to defining the middle class is to set boundaries based on absolute purchasing power. In the U.S., for example, Perry defines the middle class as those with household incomes between $35,000 and $100,000 in 2016 dollars. Harry Holzer suggests a minimum threshold of $50,000 a year for those aged 25-54, which he argues is “appropriate since it is roughly two-thirds of median income for family households in the U.S., and also over twice the official poverty line for a family of four.”
This purchasing power approach is very common among studies seeking to identify a global rather than national middle class, and/or to make comparisons of middle class conditions across countries, especially less affluent ones. Many economists have defined the global middle class as households with incomes between $10 and $100 per person per day in at 2005 PPP. Kharas updates this to $11 to $110 in 2011 PPP terms.6 Lopez-Calva and Juarez use an upper bound of $50 per person per day in 2005 PPP terms. (Their lower bound is based on vulnerability to poverty, mentioned below.) Banerjee and Duflo identify the middle class in developing countries as those with per-capita daily expenditures between $2 and $10 per day in 2005 PPP. Ravallion raises the upper limit from $10 to $13—which is, to provide some context, just a little under the U.S. poverty threshold.
Wealth and Consumption
Wealth, or net worth, provides a different measure of resources available to a household to a pure income measure. Greater wealth may provide greater economic security, as a buffer against economic shocks, especially in later life. For example, some retirees may report very little annual income but place toward the top of the wealth distribution given the value of their homes, pension assets, and bank accounts. Since households can generally cash in on their wealth when needed, Edward Wolff describes net worth as “potential consumption.”
Wealth-based definitions appear to resonate with the general public. A survey by Charles Schwab suggests that people in America’s largest cities think that it takes a net worth of anywhere from $500,000 to $1 million just to be “financially comfortable” in their areas, and somewhere between $2 and $4 million to be “wealthy.” Wealth may alleviate anxiety.
Wolff defines the middle class as the middle three quintiles of the wealth distribution. His analysis also reveals differences in the ways that the middle and upper classes store wealth. The wealth of the top quintile is highly concentrated in investment assets, including real estate, business equity, stocks, and bonds. By contrast, housing makes up more than three-fifths of the assets of the middle three quintiles, though mortgage debt amounts to almost half of middle-class home values. Homeownership might indeed be a defining feature of the middle class—but according to Wolff, so is mortgage debt.
While income is the most common cash-based measure of class, followed by wealth, some scholars point to other approaches, including consumption-based definitions, or those which capture financial vulnerability or risk. Meyer and Sullivan argue that expenditure serves better than income or wealth to delineate class boundaries: “Conceptual arguments as to whether income or consumption is a better measure of the material well-being of the middle class or the poor almost always favor consumption.” They find that the U.S. middle class is materially better off now than in the 1980s: median consumption has grown by over 50 percent, and households in the middle income quintile have larger houses and better-quality cars. Sullivan is cited in support of using the middle quintile by spending—around $38,200 to $49,900 for a four-person household—as a definition of the middle class. On this basis, what matters most is not what we bring home, but what we can buy. Other studies focus on some measure of vulnerability to poverty, or on income volatility, or on economic progress for specific individuals or families over time. (We will return to these specific issues of volatility, risk, and vulnerability in a later paper.)
What unites all of these approaches is that they share the same basic currency for class determination, money—whether in earnings, income, wealth, spending, or over time. The middle class, here, is an economic category. Of course, for most people, their economic position is strongly related to their credentials, of either the educational or the occupational kind. Or they may be the way in which class is more usefully defined; and we turn to those next.
Class = Credentials
Defining class in economic terms makes for more straightforward empirical analysis (even though, as we’ve seen, definitions matter a great deal for the results). But most people see class as being about more than money. Status is defined not just by cash, but by particular credentials, especially in terms of occupation and education. We may intuitively rank a museum curator with a PhD differently from an HVAC engineer with a certificate from a community college, even if their incomes are identical; and perhaps even if we knew their lifetime incomes would be the same.
Occupation
Many scholars, especially sociologists, see occupation as “the most powerful single indicator of levels of material reward, social standing and life chances.” Income may be the most direct way of measuring material reward alone, but if social standing is primarily about how we are viewed in society, occupations are much more visible than income. After all, it is commonplace to open a conversation with, “What do you do?” but taboo to ask, “What is your salary?” Many résumés can be viewed online; few paychecks can be.
There is an international divide here: occupational classifications are more popular among European scholars than U.S. ones. Most contemporary occupational class schemes are based on the work of British sociologist John H. Goldthorpe and colleagues.7 Goldthorpe distinguishes between workers in a service relationship (“salariats” who have a reasonable expectation of continued employment and promotion) and those under a labor contract—commonly known as the working class. The UK’s official socioeconomic classification scheme, the National Statistics Socioeconomic Classification (NS-SEC), is based on the Goldthorpe approach, as is the European Socioeconomic Classification (ESeC).
Charles Murray uses an eight-class scheme similar to the Goldthorpe model to group people into class-based “neighborhoods”: one working-class and the other more affluent.8 People not included in either neighborhood—those who presumably comprise the middle class (Murray calls them “everybody else”)—work in mid-level white-collar positions or high-skill technical occupations. These include, for instance, human resources specialists, K-12 teachers, and physical therapists.
Murray also divides the population into the top 20, middle 50, and bottom 30 percent of socioeconomic status, based on the cognitive requirements of their occupations. Here he is drawing on a literature on occupational status, in which particular occupations are placed on a distribution of status scores, somewhat like an income distribution. Scores are assigned based on the earnings, education levels, skills, or “prestige rating” associated with an occupation. As always, however, the selection of specific dimensions, or the weight placed on those selected, can generate very different rankings. Hauser and Warren (1997) show that some occupations, like elementary school teachers, have low wages relative to occupations with similar education levels, but high prestige ratings relative to their education and earnings. Other occupations, like truck drivers, have high earnings relative to their education, but low prestige relative their education and earnings. So: are truck drives and elementary teachers in the same class?
One problem with occupation-based definitions is that while occupations are held by individuals, class is typically applied to families or households. But what if, say, a husband and wife have occupations with quite different statuses? Perhaps one is a professor and the other is a firefighter. In this case, sociologists often assign the entire household the class status denoted by the “economically dominant” occupation. This is very often the man, which means that women’s class status is tied to that of their male partners. Class categories may then be skewed towards male occupations. Equally, the use of simple occupational categories may obscure important differences between the position of men and women within occupations. Additionally, occupational class categories are obviously of very little use when no one in the household is employed, though sociologists sometimes use a person’s last known occupation as a class indicator. Finally, occupation-based class schemes have to be regularly updated as certain occupations become more or less important to the economy and society.
Education
Entry into occupations of a certain class status depends on acquiring certain skills or qualifications. Occupational and educational credentials tend to go hand in hand. Education is also seen by many as a strong marker of class status in and of itself. Most often, possession of a four-year college degree serves as the threshold for determining class position. This is both because education (or degree attainment) is a relatively easy and consistent variable to measure and because it is closely correlated with other indicators of economic status, like income.
Education is, at its core, an investment in human capital, which often yields large returns in the form of higher incomes and wealth accumulation. Workers with at least a four-year college degree can expect to earn more over their lifetimes than those with a high school degree or less, and this “college wage premium” has grown over time. In 1979, the average worker ages 25-64 with a college degree or more earned about 35 percent more than the average worker with a high school degree. By 2013, this premium had increased to nearly 80 percent. College-educated workers tend to experience greater job stability and autonomy than those with lower levels of education. Having a bachelor’s degree might also serve as a powerful symbol of social status that delineates social classes.
In the wake of the 2016 U.S. presidential election, multiple observers identified the working class as adults with less than a college degree or, less frequently, those with a high school degree or less. The implication here is that those with a college degree are middle class. But this is not a general view in the population. Fewer than one in three (30 percent) of Americans believe that a college education is needed to be considered part of the middle class, according to a recent Pew survey. Popular definitions of middle class status may then overlap with expert definitions of the working class. Yet few would claim that the middle class is the same as the working class—that is, limited to only those without a college degree.
One problem associated with defining the middle class by education is that the relative values of educational credentials change over time. A bachelor’s degree might once have placed an individual and their family solidly in the elite; now it is increasingly necessary to achieve a decent standard of living.
Another problem is that the value of a college degree can vary wildly across fields. Not including those with graduate degrees, the median English major earns $1 million over a lifetime, which is closer to the median high school graduate ($0.58 million) than to the median finance major ($1.56 million).9
Education levels can be used to supplement rather than substitute for other measures of class status. Joan Williams and Heather Boushey, for example, define the “missing middle” as households that are between the bottom third and top fifth of household income, plus households in the top income quintile in which no adult has a bachelor’s degree. This means that the middle class contains roughly 55 percent of all households: 50 who are in the middle of the income distribution, and 5 who have reached a high income bracket, despite never completing a four-year degree. The definition used by Williams and Boushey has the advantage of inclusiveness—it intentionally includes a portion of the population who, defined by income alone, would be omitted from the middle class. These higher-income but less-educated Americans might feel as though they belong to the middle class because they do not relate to the “elite” norms or values often marked by one’s educational credentials. However, the measure ends up being more complex, and more influenced by normative assumptions.
It is striking that when Williams summarized her work on this group in an influential book, its title was White Working Class: Overcoming Class Cluelessness in America. She is upfront about the reason for the shift in nomenclature:
“I had a lively discussion with my editor about what to call the various groups in this book. I wanted to call the group in the middle the middle class, because, well, they are. My editor wisely pointed out that readers would be confused by that, if ‘middle class’ is a term that we all use to describe ourselves regardless of whether or not it reflects reality. So I agreed to call those Americans in the middle—the ones who are neither rich nor poor—the ‘working class.’”10
(I can empathize: I had a similar argument with my editor over whether to describe the top fifth as the “upper class” or “upper middle class” in my book, Dream Hoarders.) But if “middle class” and “working class” become virtual synonyms, it becomes even more important to be clear how the group in question is defined.
Class = Culture
Definitions of class based on cash or credentials rest largely on “hard” tangible measures. (The main exception is the use of prestige rankings for occupations.) These allow for more robust analyses of trends, prospects, and challenges. But for many, class is a state of mind. Rather than bank balances or résumés, class is revealed through a combination of aspirations and attitudes; self-perception; or behavioral norms, preferences, and tastes. In the U.S., race also plays an important role, with whites more likely to be seen, and to see themselves, as members of the middle class.
Aspirations
“Middle class families are defined by their aspirations more than their income,” according to a 2010 Commerce Department report prepared for Vice President Biden’s Middle Class Taskforce. The full definition is worth quoting at length:
“Middle class families and those who wish to be middle class have certain common aspirations for themselves and their children. They strive for economic stability and therefore desire to own a home and to save for retirement. They want economic opportunities for their children and therefore want to provide them with a college education. Middle class families want to protect their own and their children’s health. And they want enough income for each adult to have a car and for a family vacation each year. Middle class families are forward-looking, and they know that to achieve these goals, they must work hard, plan ahead and save for the future. Indeed, being middle class may be as much about setting goals and working to achieve them as it is about their attainment.”
Here, class is very much about a mindset rather than a bank balance or job category. The key ingredients of a middle-class lifestyle, according to the report, are to: own a home, be able to save for retirement, provide a college education for their children, have health security (insurance), a car for each adult, and a family vacation at least once a year. This is essentially a form of consumption definition, with middle class aspirations defined in terms of middle-class expenditures. This lifestyle is hard to achieve for some families. For example, a family with one adult and two children with an annual income of $25,200 (the 50th percentile for this family type) might achieve something akin to that ideal middle-class lifestyle with a house worth a little over $100,000, children covered by the Children’s Health Insurance Program (and an uninsured parent), and a vacation worth $500 every other year, according to the report.
But note that in this case, the definition of the middle class includes not only people who have achieved a middle-class lifestyle, but also those people who are aspiring and working hard to achieve this lifestyle. This kind of definition is very inclusive, since in principle everyone can count as middle class as long as they are aspiring and working toward a certain lifestyle. But this very inclusiveness gives the definition less bite. After all, few people do not aspire to these goods. How many people, for example, do not “want to protect their own and their children’s health”? Many people might aspire to a middle-class lifestyle, and work toward it, but not make it because of the very economic and social challenges the report describes. It might be better to show that the pathways into the middle class are narrower and more challenging to travel than they should be, and that many people are thwarted in their efforts to join the middle class.
Self-perception
Rather than deciding on a person’s behalf, using certain metrics, whether someone is middle class or not, it would be better to let them decide for themselves. A number of surveys capture self-definitions of class in the U.S. The biggest three are conducted by Pew, GSS/NORC, and Gallup. Each use slightly different class categories, however, and these seem to influence results quite significantly:
More people define themselves as working class when there are only two options further up (middle or upper, in the GSS), than when there are three higher levels (middle, upper-middle, upper, in Gallup). What is consistent across the surveys is that only around one in ten Americans define themselves as “lower class,” and only a tiny fraction (1-3 percent) will apply the label “upper class” to themselves.
The Pew survey also captures information on income brackets, providing some sense of how a particular income level might influence self-perceived class status. The relationship is in the expected direction, with respondents living in higher-income households ranking themselves higher in terms of class:
It is nonetheless striking that half of those in households with six-figure incomes define themselves as middle class; and that even among those with incomes below $30,000, a third define themselves as middle class and another third as lower-middle class.
Brian Cashell takes the innovative approach of combining surveys capturing self-definitions of class to determine the upper and lower income thresholds. He concludes:
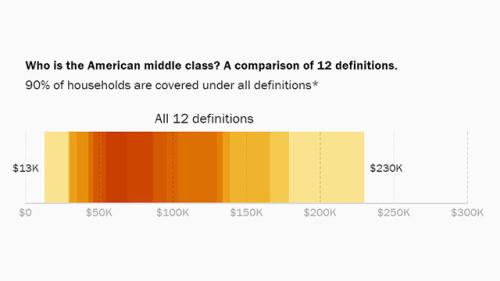
“No attempt to identify the middle class in the income distribution can be expected to yield a precise answer. But the term is used so often, it is worth the effort to attach some numbers to it. … Surveys indicate many people felt an income near $40,000 was the minimum to be considered middle class. On the other end, surveys suggested that those with incomes approaching $200,000 might still be considered middle class.”
Since Cashell was writing a decade ago, we have updated this range to $46,000 to $230,000 to account for inflation. Assuming that this represents an income level for a household of three (close to the size of the average U.S. household), 61 percent of households are part of this self-defined middle class.
Norms, preferences, tastes
Another way to define class is not through what people earn, or do for a living, but how they live. Most scholars think in terms of “cultural capital” (as opposed to economic capital, which is about money, and social capital, which is about networks). In the U.K., Savage et al. define seven classes based on social, cultural, and economic capital. Their measure of cultural capital scores respondents’ level of engagement with “highbrow” culture, such as classical music and art galleries, or “emerging” culture, like sports and rap music. The resulting class structure names two middle classes: the established middle class, with high (but not “very” high) economic, social, and cultural capital; and the technical middle class, with more moderate cultural capital and few social contacts but otherwise high economic and social capital. They also draw attention to new affluent workers who have more moderate economic and social capital but score high on “emerging” cultural capital. Together, these three classes represent almost half of the UK population.
Culture can be seen as a shorthand for some of the attitudinal or aspirational characteristics described earlier. But a taste for certain kinds of high culture can also be a reflection or market of class status, even at similar levels of income and education, as an analysis of the GSS data by researchers for the National Endowment for the Arts finds. As they write: “Comparing U.S. adults with near-median household incomes and similar educational attainment, we find that those who identified as middle class had 14 percentage points higher probability of attending an [art] exhibit in the past year, versus those who identified as working or lower class.”
Class and race
So far we have examined the economic conditions, credentials, and attitudes of the middle class. But there is another question that has to be asked about the middle class, especially in the U.S. context: what color is it? The racist history of the U.S. means that class has been used in an exclusive fashion, as an implicitly whites-only category. It is true, based on certain income thresholds, that the middle class is becoming more diverse over time. But in terms of self-perception, and the perception of others, race still seems to plays an important role. Black Americans are much less likely to define themselves as middle class than whites, for example, even within the same income brackets:
While so far we have discussed class in terms of what somebody has, or who they are, it may sometimes be seen in terms of who they are not. In American Misfits and the Making of Middle Class Respectability, Robert Wuthnow argues that certain groups—black Americans, squatters, “white trash”—serve in effect as contra-examples of middle class lifestyles. “Marginalized individuals and groups served persistently, repeatedly, and often quite prominently as the contrasting cases, the negative comparisons through which middle-class respectability was defined.”
Even today there is an implicit whiteness to many conceptualizations of the middle class, and perhaps even more so of the working class. As the U.S. becomes more diverse, and more racially equal (albeit painfully slowly), this implied relationship between race and class will have to change—the question is how.
Conclusion
Writing in the The Atlantic in 2013, Anat Shenker-Osorio described the term middle class as a “frozen phrase…a brand without a product.” There is certainly a danger that the label has been hollowed out as a result of the radical ambiguity of political usage, and the vast range of scholarly definitions.
In this paper we have described a variety of ways in which the middle class is defined, under three broad headings: cash, credentials, and culture. Most of the cash-based definitions focus on income, although even here, the precise delineation differs considerably. Class can also be determined in terms of occupation and/or education—these have the advantage of being somewhat more permanent characteristics, compared to income, which may be more changeable from one year to the next. Lastly we have examined approaches that demarcate the middle class on cultural grounds—aspirations, self-perception, tastes—including the potential for class to be used culturally as a means for racial exclusion.
It is clear that the condition of the American middle class is a cause for deep concern and for a concerted collective response. Back in 1972, Richard Sennett and Jonathan Cobb warned of the “hidden injuries of class.” Today’s class wounds are no longer hidden. Populist political leaders are channeling middle class angst, only to promote policies that will reinforce, rather than redress, class division. Our political and policy challenge is to improve the quality of life of America’s middle class, and to increase the number of people rising to join its ranks. But in order to provide concrete help to the middle class, we have to know who we are talking about.
Technical Note
Income data used in this report are from the 2017 Current Population Survey Annual Social and Economic Supplement, downloaded from the Integrated Public Use Microdata Series (IPUMS). Respondents report their income from the previous year, so all income is reported for 2016. Our main income variable is total household money income—that is, income earned by all household members before taxes. In addition to income from wages or salary, this includes self-employment income, Social Security and pension payments, cash transfers, alimony, child support, and income from interest, dividends, estates, or trusts. It excludes capital gains and non-cash transfers like food stamps. Certain types of income are topcoded by systematically swapping all income values greater than a given swap value with other topcoded cases.
The CPS defines a household as all persons who occupy the same housing unit, whether that is a house, an apartment, or a room. Since a single person living off of $50,000 is better off materially than a four-person household with the same income, we adjust income for household size using square root equivalents. This means that we divide income by the square root of household size, which allows for “economies of scale” in household consumption. This adjustment also helps to reflect that declining household sizes have eased the pressure on the average household’s budget. In 2016, the average U.S. household contained 2.5 people. We thus choose express income in household-of-three equivalents. In practice, this means multiplying size-adjusted income by the square root of three so that adjusted income for a household of three is the household’s actual reported income (since we divide and multiply by the square root of three), but adjusted income for a household of two is slightly greater than reported income (since we divide by the square root of two and multiply by the square root of three).
Some definitions require us to adjust income thresholds for inflation. We use the Personal Consumption Expenditures (PCE) deflator, published by the Bureau of Economic Analysis, to convert to 2016 dollars. In the interactive that accompanies this report, we use the PCE deflator to calculate growth in the middle class’s average income since 1980.
It is worth noting that CPS income is self-reported, which makes it less accurate than administrative data files like tax reports. As Gary Burtless writes, publicly available microdata from household surveys are particularly useful because they allow us to investigate the distribution of income, but discrepancies between CPS and national accounts data are cause for concern.
Authors

-
Footnotes
- Anthony B. Atkinson and Andrea Brandolini, 2013. “On the Identification of the Middle Class.” In Income Inequality: Economic Disparities and the Middle Class in Affluent Countries, edited by Janet C. Gornick and Markus Jäntti. Stanford, CA: Stanford University Press, pp. 77-100.
- Ibid.
- Mark Perry (2018), defining the middle class as those making between $35,000 and $100,000 in 2016 dollars, finds that both the middle and lower classes have shrunk since 1967, while the share of households making over $100,000 has grown from 8 to 28 percent. His findings differ from Pew’s because he defines classes based on absolute income thresholds that are fixed over time, whereas thresholds based on real (inflation-adjusted) median income have risen over the last several decades. Under Pew’s definition, then, a larger range of incomes counts as lower class in 2015 than in 1971.
- Antonio Estache and Danny Leipziger, editors, 2009. Stuck in the Middle: Is Fiscal Policy Failing the Middle Class? Washington, D.C.: Brookings Institution Press.
- Ron Haskins and Isabel Sawhill, 2009. Creating an Opportunity Society. Washington, D.C.: Brookings Institution Press.
- Using this definition, Kharas finds that the middle class will expand to become the majority of the world’s population by 2020, driven primarily by growth in China. In developed countries in North America and Europe, the middle class is growing slower than the population, largely due to more people being in the upper class in these countries, so the share of Europeans and North Americans in the middle class is declining.
- See Hauser and Warren (1997) for a review of many Goldthorpe-inspired class schemes.
- Charles Murray, 2013. Coming Apart: The State of White America, 1960-2010. New York: Crown Forum.
- If only full-time workers are included, the median English major has lifetime earnings $1.22 million, almost exactly between the median high school graduate ($0.74 million) and the median finance major ($1.73 million).
- Joan C. Williams, 2017. White Working Class: Overcoming Class Cluelessness in America. Boston: Harvard Business Review Press.