It was only a generation ago when many Americans left downtowns for dead. From New York to Chicago to Los Angeles, residents fled urban cores in droves after World War II. While many businesses stayed, it wasn’t uncommon to find entire downtowns with little street life after 5:00 PM. Many of those former residents relocated to the suburbs, which housed 60% of metro area residents by 1980.
》Explore metro area downtown maps and data
This was a missed opportunity for metropolitan economies. Downtowns put their residents in close proximity to all kinds of destinations, from local stores to more suburban jobs via traditional hub-and-spoke transit. Downtowns are also dense and utilize prebuilt assets such as roads and water pipes, meaning they require less infrastructure spending per capita. They are engines of civic and economic vibrancy. And, as Jane Jacobs once extolled, the all-day activity of downtowns leads to economic dynamism and social interaction.
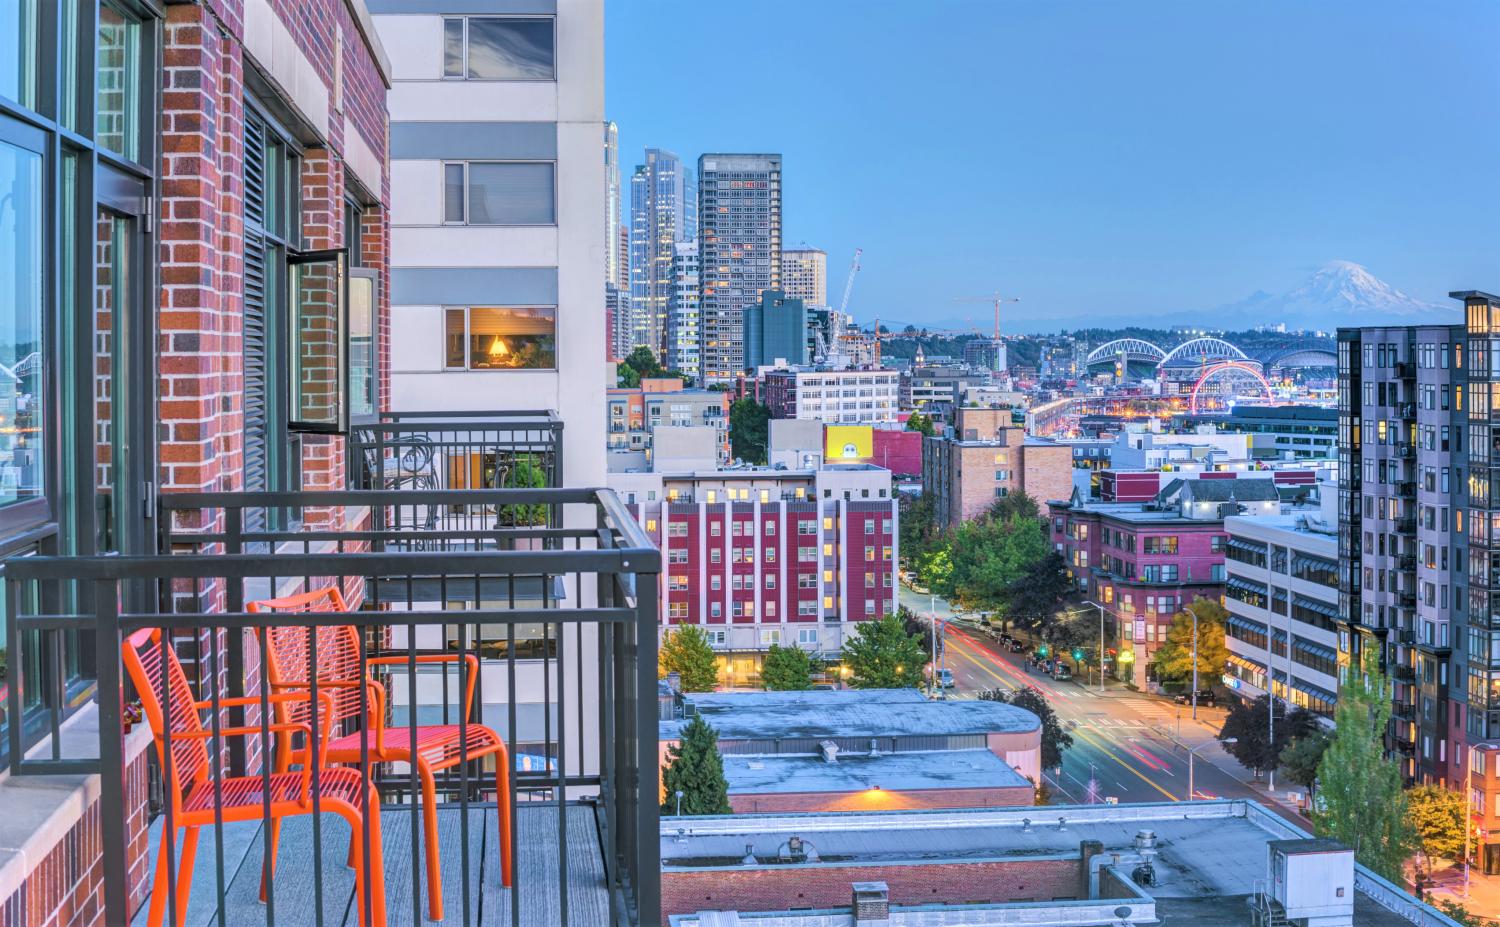
Walking around big cities the past few years, one could sense a reversal underway from the post-WWII norm. Cranes dot the downtown skylines in big metro areas like Miami, Seattle, and Washington, D.C. Major revitalization efforts are underway in smaller cities like Allentown, Pa. and Greenville, S.C. Central-city land values are surging.
Using population data since 1980, we tested how sustained downtown population growth has been and compared that growth to surrounding counties. The results are clear—the downtown boom is real.
This is especially true in metro areas housing over 1 million people. Starting in 2000, the average downtown grew significantly faster than both the remaining parts of metro areas and their home counties, breaking decades of the opposite trend. So even while suburban counties are once again growing faster than central urban counties, the downtown resurgence adds critical nuance.
However, with the COVID-19 pandemic upending daily life—especially in cities—are downtowns once again facing a fate similar to their mid-century decline? It’s not unreasonable to question whether the benefits of downtowns will outweigh health-related fears. But the data suggests that downtowns have been increasingly attractive for the last few decades. And considering how well cities bounced back from prior health scares, we believe downtowns have enough momentum to weather the coronavirus crisis.
Just as importantly, continued demand for downtown living—and whether it spreads to surrounding central city neighborhoods or relatively smaller metro area downtowns—will have big implications for how people consume land, housing, and transportation in the years to come.
How do we measure downtown population?
There is no single agreed upon definition of a “downtown.” Previous research at Brookings and a Federal Reserve Bank of Chicago piece used central business districts (CBDs) as the anchoring concept. These are areas of high-value land with a concentration of retail and service businesses (among other establishments) and high traffic flow. Meanwhile, this City Journal piece uses a more flexible definition of “central city.” Downtowns are certainly a flexible concept, but they always point toward the traditional physical and commercial center of a populated area, either in small towns or the largest metro areas.
We defined a downtown as a city’s CBD and the small ring of the neighborhoods surrounding it (see Map 1 for an example). We included surrounding neighborhoods because they are still within the metro area’s historic center and may permit residential buildings at a higher rate than the business-focused CBD. While there’s never a perfectly agreed-upon definition of these places, this scheme allows us to use past geography to consistently compare places across the country and over multiple decades.
Map 1: Chicago downtown tracts

For our analysis, we looked at the populations living in the downtowns of the 100 largest metro areas, all with over 500,000 people. (Daytona, Fla. and Winston-Salem, N.C. were cut from the study due to limitations in our initial dataset.) We chose to focus on population rather than job counts because we wanted to measure if people were living downtown, not just working there. Here again, a CBD-only definition focuses more on business activity.
Our technical process for defining downtowns included three steps. We began with geographies of CBDs as defined by the 1982 Census of Retail Trade, converting those to corresponding 2010 census tract geographies, and then adding all tracts that shared a boundary with the CBD. We always chose the downtown from the 1980 metropolitan area’s primary city, to reflect the era of the original 1982 CBD designation; this means we did not analyze some large downtowns including St. Paul, Minn. and Fort Worth, Texas. We then used Social Explorer to accurately compare tract populations across decades.
We used the Office of Management and Budget’s 2010 metropolitan area geographic definitions for consistency. The county analysis looked strictly at the county where the CBD is located. When comparing downtowns to their county or metropolitan area’s population, we omit the downtown population so as not to double count. We used population counts from the 1980, 1990, 2000, and 2010 decennial censuses. The American Community Survey’s 2014-2018 5-year averages are the current data source, which we reference as 2018 for simplicity.
The largest metro downtowns gained momentum in 1990 and sustained it in the 2000s
From the mid-century through the 1980s, downtown populations were in a period of relative stability—at best. While their surrounding metro areas boomed, boasting a 12.6% population growth rate from 1980 to 1990, downtowns lost 1.7% of their residents. The population loss was pervasive: 58 of the 100 downtowns we studied lost population over the 1980 to 1990 period, covering metro areas of all sizes.
But the pattern reversed in the run-up to the new millennium, especially in the 53 metro areas housing over 1 million people (Figure 1). While the 1990s saw the return of downtown population growth, the decade from 2000 to 2010 saw downtowns grow faster than their home county and surrounding metro areas. Critically, the trend continued through the 2010s. Downtown growth was also more broad-based, with 42 of the 53 downtowns adding population over the 2000s.
Considering the prevailing national narrative about desolate downtowns in the 1970s and 1980s, it’s a remarkable comeback story.

However, the same growth pattern did not extend to the next tier of metropolitan downtowns. These 47 downtowns’ populations barely grew over the four decades we studied, adding only 1.9% more people in total. This includes 23 of 47 downtowns that lost people over those four decades.
Which regions grew fastest?
Not all regions of the country are experiencing downtown growth in the same ways. While downtowns in the Northeast, Midwest, and South stalled or lost population between 1980 and 2000, downtowns in the West boomed. All but three of the 23 downtowns in the West saw their populations increase, and the aggregate growth rate for western downtowns was 21.6% over those two decades. Meanwhile, the aggregate growth rate for downtowns elsewhere was -4.1% (Figure 2).

In the new millennium, though, the other regions started to imitate—if not best—their western counterparts (Map 1). Downtowns everywhere, but particularly in the Midwest, began seeing a revival. While only a third of downtowns in the Midwest saw population increases between 1980 and 2000, three-quarters did over the following two decades. The Midwest revivals include many older industrial cities such as St. Louis, Cleveland, and Indianapolis.
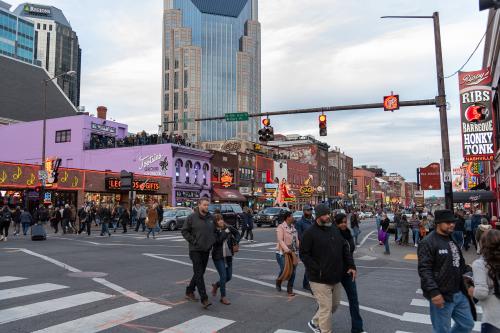
Many cities in the South saw a similar revival. Nearly 40% of downtowns in the South lost population between 1980 and 2000, but then gained population over the next two decades. Trendy places such as Nashville, Tenn. and Austin, Texas embody this reversal.

Which downtowns stand out?
No downtown grew faster than Chicago. In 1980, the downtown of Chicago accounted for just 0.23% of the metro area’s population; by 2018, it accounted for 1.16%. That percentage point change may sound small, but downtown Chicago is anything but. Over nearly four decades, downtown Chicago’s population ballooned from just over 18,000 to more than 110,000. It was especially exceptional because Cook County, Ill. began losing population in 2000.

There were 34 downtowns that lost population between 1980 and 2000 but gained population in the following two decades—many of which had massive revivals. Downtowns such as St. Louis and Tampa, Fla. (among others) each lost around a quarter of their populations in the two decades leading up to 2000, and then saw 71.8% and 63.5% population gains, respectively, in the following two decades. Table 1 lists the top rising downtowns over the past two decades.

Meanwhile, there were 18 downtowns that lost populations both before 2000 and after. These include Little Rock, Ark. and Jackson, Miss., which both lost more than half of their population from 1980 to 2018. In both instances, their respective metro areas continued to see positive growth over the same time span. These shrinking downtowns represent a missed opportunity to use highly accessible land.

Is downtown population growth concentrating?
Looking at percent changes could bias our findings toward small changes in otherwise small downtowns—but that isn’t the case. Of the 10 downtowns with the largest percent growth in population over the four decades studied, six of them were also in the top 10 by raw numbers. The other four were in the top 25. What this suggests is that downtown population growth is concentrating in just a few downtowns.
In fact, the five downtowns that added the most population accounted for 38.4% of the gross downtown population growth. Two of them—San Francisco and Philadelphia—were already among the largest downtowns to begin with.
Implications
The surge in downtown populations is an overwhelmingly positive sign for the cities and metro areas where it’s taking place. Downtowns offer proximity to jobs, other people, and major attractions. They make more efficient use of infrastructure and create common cultural touchpoints for entire regions. Even with suburbanization continuing, there is clearly demand for greater access to jobs and amenities, even if that means living in a smaller home.
This affirms the perspective of the Bass Center for Transformative Placemaking and other placemaking professionals: People want to live, work, and play in dynamic, dense neighborhoods. However, it’s not always easy to mobilize capital and risk-taking to help create more of these places, including downtowns where geographical constraints force developers to build with height. These findings represent an affirmative signal to real estate markets and city governments to more actively pursue downtown development to meet this demand.
Moving forward, these results raise at least three critical questions:
First, for those downtowns already experiencing positive growth, what will it take to support growth into more neighborhoods, particularly those that have experienced decades of disinvestment or outright destruction from urban renewal? Real estate demand is more fluid than construction timelines, meaning there’s a chance that downtowns’ residential building supplies will not keep up with demand or incentivize the adaptive reuse of office buildings happening in many cities. This could be a positive trend, creating demand spillovers into neighborhoods that would benefit from greater investment. These are the patterns seen in Washington, D.C. and Seattle, for example, although such spillovers also directly increased negative effects related to affordability. Are there lessons for cities like Cleveland and St. Louis in these experiences?
Second, for the downtowns that aren’t growing, what can they learn from their peer cities that are experiencing robust residential growth? Understanding the policies and practices that may have helped support such growth could be especially valuable for places that are losing downtown population even as their metropolitan areas are growing. Expert downtown practitioners, including our colleagues at Main Street America and the International Downtown Association, are also invaluable resources to understand the available tools to ignite downtown revivals.
Third, how can cities assuage fears during the coronavirus crisis and build confidence that denser neighborhoods are not threatened by future pandemics? Diseases and pollutants have long endangered central-city residents, spurring demand for country homes during polio outbreaks or suburban houses far away from polluting factories. Yet cities were resilient through those crises, as well as more modern issues related to crime and terrorism. Central cities will continue to have modern broadband infrastructure, advanced health care systems, and shared civic spaces like street space to help weather disease outbreaks. Just as importantly, cities have a long record of rebuilding to promote future resilience.
And herein lies the fundamental driver. Downtowns concentrate assets, giving locals and those living further away access to densities of jobs, shopping, restaurants, government services, entertainment venues, and more. That fundamental power of agglomeration cannot be stopped. So while diseases will come and go, we can always retrofit our cities to make us feel safe while still delivering the proximity we crave.
Downtowns are back—not that they ever left. Based on these findings and the pro-urban attitudes we see sprouting across the country, there’s good reason to expect cranes will keep transforming downtown skylines and surrounding neighborhoods for years to come.
Technical notes: We originally sought out to analyze the 100 largest metro areas, but due to limits in our initial dataset, we had to omit Daytona, Fla. and Winston-Salem, N.C. We then added the next largest metro areas with data (Youngstown, Ohio and Modesto, Calif.), for a total of 100 metro areas.


