
Introduction
Achieving the American dream—the opportunity to succeed, to provide food and shelter for family members, education for children, hope for a better life, and freedom of opportunity— requires capital. But, in the United States, access to capital for individuals and business owners is uneven based on race. The racial wealth gap remains significant. In 2019, the median net worth of a typical white household, $188,200, was 7.8 times greater than that of a typical Black household, $24,100 (Bhutta et al., 2020). Most houses are bought with a mortgage and most businesses rely on credit to fund their expansion.1
This report documents that, at a local level, there are stark contrasts in access to credit for African Americans: Interest rates on business loans, bank branch density, local banking concentration in the residential mortgage market, and the growth of local businesses are markedly different in majority Black neighborhoods. Several policy approaches are suggested: First, a more granular approach to banking supervision may be needed; microgeographic data in 2021 provides a much closer look at the banking practices of major banks and nonbank lenders than in 1977, when the Community Reinvestment Act was signed into law. Second, the number of African American minority depository institutions (MDIs) has been declining and policy or private-sector support is likely needed (Pike, 2021). Third, as the mobility of Americans is overall declining, geography matters more than ever (Molloy et al 2017). A lack of credit hinders investments in better homes, better schools, better local infrastructure such as roads and public transport, better amenities, and better health care.
Section 1 reviews the history of credit policies. Section 2 presents granular evidence on inequalities in access to banking services, including bank deposits. Section 3 focuses on residential mortgage credit supply. Section 4 turns to small business lending. Section 5 suggests a 21st century agenda for lawmakers and academic researchers.
1. Historical context
Removal of Africans from their rich commercial environments in kingdoms including Ghana, Mali and Songhai through the slave trade between the 14th and 18th centuries did not destroy their proclivity for business and trade (Ammons, 1996). Since the time when Black people in America secured the right to earn capital for their labor following emancipation, they have faced systemic financial discrimination with respect to banking access and fees. Over a century ago, racism and segregation required Black people to pool their resources to support each other, and Black-owned banks played a vital role in the economic health of Black communities (Gerena, 2007). On October 17, 1888, Capitol Savings Bank in Washington, D.C. became the first bank organized and operated by African Americans (Todd, 2019). Within four years of opening, the bank’s deposits had grown to over $300,000 (Partnership for Progress). Between the end of the Reconstruction era and the beginning of the Great Depression, over 130 Black-owned banks opened, providing capital to Black entrepreneurs, businesses, and prospective homeowners (Gerena, 2007).
In the early- to mid-20th century, the federal government took on a large role in the stabilization and financing of the home mortgage market in the United States. In response to the housing market problems brought on by the Great Depression, the Home Owners Loan Corporation (HOLC) purchased and refinanced over one-tenth of all non-farm U.S. mortgages by 1936. The HOLC subsequently created color-coded maps in 200 cities to better understand the risk of the mortgages with the guidance and expertise of local real estate market professionals that reflected long held patterns of racial discrimination, a process that came to be known as redlining. Shortly thereafter, the recently created Federal Housing Administration (FHA), which by the middle of the century covered the insurance of over one-third of the U.S. mortgage market, crafted their own redlining maps to guide decisionmaking. In tandem, the FHA and HOLC helped lock in existing patterns of racial discrimination in the U.S. housing market (Fishback et al, 2020). This period coincided with the Second Great Migration, which witnessed millions of Black people migrating from the rural South to the cities of the North and Midwest. Given the existing market discrimination that non-minority owned banks practiced, their race-based exclusion of Black people from the mortgage market provided an opportunity for minority-owned banks to provide service to a much larger market of Black migrants looking to purchase homes and start businesses. However, Black migrants faced labor market competition with new European immigrants and legacy Black residents in addition to labor market discrimination, which made it difficult for minority-owned banks to finance economic development efforts (Ammons, 1996).
During the seven year period between 1983 and 1989 the number of Black owned banks declined 22%, while the total number of banks in the U.S. declined by only 12% (Price, 1990). Black-owned banks make capital more accessible because they approve a higher percentage of loans to Black applicants than other banks, but their impact is limited by their low numbers and often precarious financial standing (Burton, Scheck, and West, 2020). Compared with white-owned banks, minority-owned banks are more likely to rely more heavily on government deposits, and therefore hold fewer loans and more liquid assets (Price, 1990).
In 2008, the Partnership for Progress was launched by the Board of Governors of the Federal Reserve to help promote and preserve minority-owned banks. But despite its efforts, the number of Black-owned banks has declined, from 48 in 2001 to 18 in 2020. (McKinney, 2019). Banking access in the Black community has not only been limited by the decrease in the number of Black-owned banks, but by an overall decrease in the number of banks in majority Black neighborhoods. Since 2010, the number of banks in majority-black neighborhoods decreased 14.6%, with JPMorgan shrinking its branch footprint in majority-black neighborhoods by 22.8% from 2010 to 2018, compared to a decline of just 0.2% in the rest of the U.S. (Fox, et al., 2019).
The FDIC defines minority depository institutions (MDIs) as federally insured depository institutions for which either “(1) 51% or more of the voting stock is owned by minority individuals; or (2) a majority of the board of directors is minority and the community that the institution serves is predominantly minority. Ownership must be by U.S. citizens or permanent legal U.S. residents to be counted in determining minority ownership.” As of December 31, 2020, the FDIC listed 142 Minority Depository Institutions located in 29 states, Guam, and Puerto Rico with cumulative assets of $287 billion. For context, TIAA had $280 billion in total general account assets in the first quarter of 2021. Of the 142 MDIs, there were only 18 Black or African American owned banks with combined assets of $4.58 billion. The minority status of those 142 financial institutions is presented in Table 1.

2. Racial inequalities in access to banking services and deposits
Today bank customers can access their accounts and perform many banking transactions via the internet. According to Business Insider, this year there will be 196.8 million digital banking users in the U.S., making up 75.4% of the population. But for those who lack financial resources, internet access, or transportation required to bridge the physical and digital distance, brick-and-mortar bank branches are vital—particularly for low-income, inner-city areas (Hegerty, 2015). Racial discrimination and various types of market failure have led to banking and credit deserts in underserved urban and rural communities (Van Tol, 2020). Ergundor (2010) finds a positive correlation between bank branch presence in low-income neighborhoods and mortgage loan originations; that favorable effects of bank branch presence gets stronger as the branch gets closer to the neighborhood; and that in the small-business-lending market, relationships are associated with greater availability of credit.
According to the Fed, in 2019 the majority of U.S. adults had a bank account and relied on traditional banks or credit unions to meet their banking needs, but gaps in banking access existed. Six percent of American adults were unbanked meaning that they did not have a checking, savings, or money market account. Approximately 40% of unbanked adults used an alternative financial service during 2018— such as a money order, check cashing service, pawn shop loan, auto title loan, payday loan, paycheck advance, or tax refund advance. Unbanked and underbanked rates were higher among lower-income households, less-educated households, Black households, Latino or Hispanic households, American Indian or Alaska Native households, working-age disabled households, and households with unstable incomes (FDIC, 2020; Rhine et al., 2006). Hence, the continuing decline in the number of MDIs is especially disconcerting. Table 2 shows the banking status for Black, Latino or Hispanic and white Americans in 2019.

The unbanked and underbanked rates in 2019 were highest for Black adults—making it more difficult for them to accumulate savings. According to 2020 survey data from Bankrate, minorities, millennials, and Northeasterners reported paying higher bank fees. The data showed that the average checking account holder at a bank or credit union paid $8 per month in fees, including routine service charges, ATM fees and overdraft penalties, but fees paid varied by race. White checking account holders reported paying the lowest amount in monthly bank fees, $5, compared to $12 for Black account holders and $16 for Latino or Hispanic account holders.
Majority Black and Latino or Hispanic neighborhoods have fewer options when it comes to financial services than majority white neighborhoods. In 2017, majority Black ZIP codes located in metropolitan areas with over 250,000 people had a median dollar-deposit-based Herfindahl-Hirschman Index (HHI) of 4,584 while non-majority Black ZIP codes had a median HHI of 3,106, where the higher score indicates less competition.2 Similarly, majority Latino or Hispanic ZIP codes had a median HHI of 3,580 compared to a median HHI of 3,157 in non-majority Latino or Hispanic ZIP codes. Access to a wider array of financial services can mean lower interest rates and higher savings rates as banks compete to attract a customer base. Figure 1, below, shows the relationship between the share of Black, Latino or Hispanic, and white residents in a ZIP code and banking competition (as measured by HHI) in ZIP codes located in metropolitan areas with over 250,000 people and after controlling for population. As the share of Black and Latino or Hispanic residents increases, so does the HHI, meaning less banking competition. The reverse is true for the share of white residents in a zip code.

In a world where services, both financial and non-financial, are becoming increasingly available online, one might argue that the physical presence of a brick-and-mortar bank branch in a neighborhood is no longer necessary. Indeed, the biennial FDIC Survey of Household Use of Banking and Financial Services found that the share of banked households in metropolitan areas that used a bank teller as their primary method of accessing their bank account fell from 28% in 2015 to 21% in 2019, as use of mobile and online banking surged. However, the same survey showed that lower-income and less-educated households were twice as likely to use bank branches, and the same was true for elderly adults. Additionally, 23% of urban banked households visited a bank branch 10 or more times a month, demonstrating that a significant number of households still use this service.
While fintech lenders have increased their market share in recent years by increasing the speed of service delivery and efficiency, there is no evidence that they have expanded access to financial services to low-income borrowers in the mortgage market (Fuster et al, 2019). However, during the pandemic, Black-owned businesses were 12 percentage points more likely to obtain PPP loans from fintech lenders, while small banks were much less likely to lend to Black businesses. Howell et al (2021) find that this disparity is largely due to racial discrimination and that when banks automate their lending process, thereby reducing human involvement, their rate of lending to Black businesses increases, especially in localities with high racial animus.
Yet, fintech should not be considered a comprehensive solution to racial disparities in access to capital. There remains a large share of households that lack access to broadband in the U.S. In cities such as Baltimore, over 40% of households or some 96,000 households lack a wired broadband connection, and some 75,000 Baltimore City households, or one in three, do not have either a desktop or laptop computer, making online services more difficult to access (Horrigan, 2020). This is exacerbated by the fact that, as shown in Figure 2, counties with less banking competition (as measured by the Herfindahl Hirschman Index) also have lower shares of households with wired broadband connections.

Finally, the continued importance of brick-and-mortar branches is further evidenced by the crucial role played by local banks in distributing PPP loans during the early months of the COVID-19 pandemic (Li et al, 2020). These more locally oriented banks were better able to discover potential customers in need due to relationship banking and their ability to understand local risk profiles more accurately. In the early stages of the pandemic, counties with the highest numbers of Black-owned businesses received some of the lowest shares of PPP loan coverage, often falling below 20% of eligible firms, possibly reflecting the lack of existing banking relationships in those communities (Mills and Battisto, 2020). Minority-owned depository institutions could play a crucial role in fostering stronger relationships between Black entrepreneurs and the financial system.

From 2010 to 2021, the U.S. lost over 15,500 bank branches. By 2021, majority Black census tracts were much less likely to have a bank branch than non-majority Black neighborhoods. Figure 3 shows a dot density map of Philadelphia census tracts and the share of residents that are Black in 2021. A high number of banks are clustered in the city’s central business district, but immediately outside that area, the city’s majority Black neighborhoods have few, if any, bank branches. Census tracts with a higher share of white residents and tracts that are more suburban have a higher number of branches. Between 2010 and 2021, non-majority Black neighborhoods were more likely to experience a decline in the number of bank branches, but only because they were much more likely to have a bank branch in their neighborhood in the first place. After controlling for the initial number of bank branches in 2010, census tracts with higher shares of Black residents were more likely to experience a bank branch closure by 2021. Figure 4 shows this relationship in the six metropolitan areas of Baltimore, Cleveland, Detroit, Pittsburgh, Philadelphia, and St. Louis.

The financial services industry has expanded beyond banks and credit unions, which are regulated primarily at the federal level. Banks are regulated by the Federal Reserve, while federally chartered credit unions are regulated by the National Credit Union Administration, and state-chartered credit unions are regulated at the state level (Federal Reserve Bank of San Francisco). While the majority of Americans complete their basic financial transactions at banks and credit unions, consumers who operate outside of the formal banking system may be more likely to utilize informal, alternative financial service providers including payday lenders (Dunham, 2018).

Payday loans, cash advance loans, check advance loans, post-dated check loans, and deferred deposit loans are short-term high interest rate loans provided by check cashers, finance companies, and others to a clientele that mainly consists of low- and moderate-income working people who have bank accounts, but who lack credit cards, have poor credit histories, or have reached their credit limit (Federal Trade Commission). According to the St. Louis Fed, in 2019 the average interest rate on the average payday loan is 391%, compared to 17.8% for the average credit card, and 10.3% for the average personal loan from a commercial bank.
The FICO scoring system, created in 1989, was designed to assess the creditworthiness of consumers (Shift, 2021). Scores range from 300 to 850. The FICO credit score is used by financial institutions as a qualifier to assess financial health. It is not easy for individuals to improve their financial health once their credit score is damaged. Black people are more likely to be excluded from conventional financial services based on their credit scores. Figure 6 shows credit scores by race for 2021. Because Black people are more likely to have lower credit scores, they are more likely to be unbanked or underbanked, causing them to pay higher service fees to receive financial services and making them more likely to depend on alternative financial institutions. Financial institutions rely on FICO credit scores as a screening tool to protect themselves from financial loss due to asymmetric information. However, developing alternative screening methods is necessary to reduce the disparity in banking access and fees.

Black and Latino or Hispanic people are more likely than white people to depend on high interest financial services like check cashing counters and payday lenders because there are fewer banks in Black and Latino or Hispanic neighborhoods. Increasing access to banking services could save Black and Latino or Hispanic Americans up to $40,000 over their lifetime (Moise, 2019). The percentage of Black adults who are not digitally literate, 22%, is twice the percentage of white adults, 11%. Both the disparity in access to banks and digital literacy threaten their ability to grow wealth in the digital economy.
3. Racial inequalities in access to mortgage credit
In the U.S., homeownership is the most common avenue to wealth building and intergenerational wealth transfers. Racial inequality in access to home mortgage loans has a long and troubled history in the country that includes redlining (Aaronson et al. 2017, Fishback et al. 2020), geographically targeted predatory lending (Carr et al. 2001; Agarwal et al. 2014), discrimination in lending standards (Ross et al. 2002), and racial covenants (Gotham, 2000; Sood et al., 2019).3
Mortgage lending files collected via the Home Mortgage Disclosure Act display very substantial differences in approval rates, as mortgage lending applications of Black American borrowers are two to three times more likely to be denied. Munnell et al. (1996) compares applicants with similar observable measures of creditworthiness and finds that race plays a statistically and economically significant role in application decisions.4 The authors also note that disparities are likely underestimated, as the creditworthiness controls themselves may be the outcome of other forces described in the previous section. There is no doubt a need for modern studies that identify lending disparities using the granularity of modern datasets.
Related Books
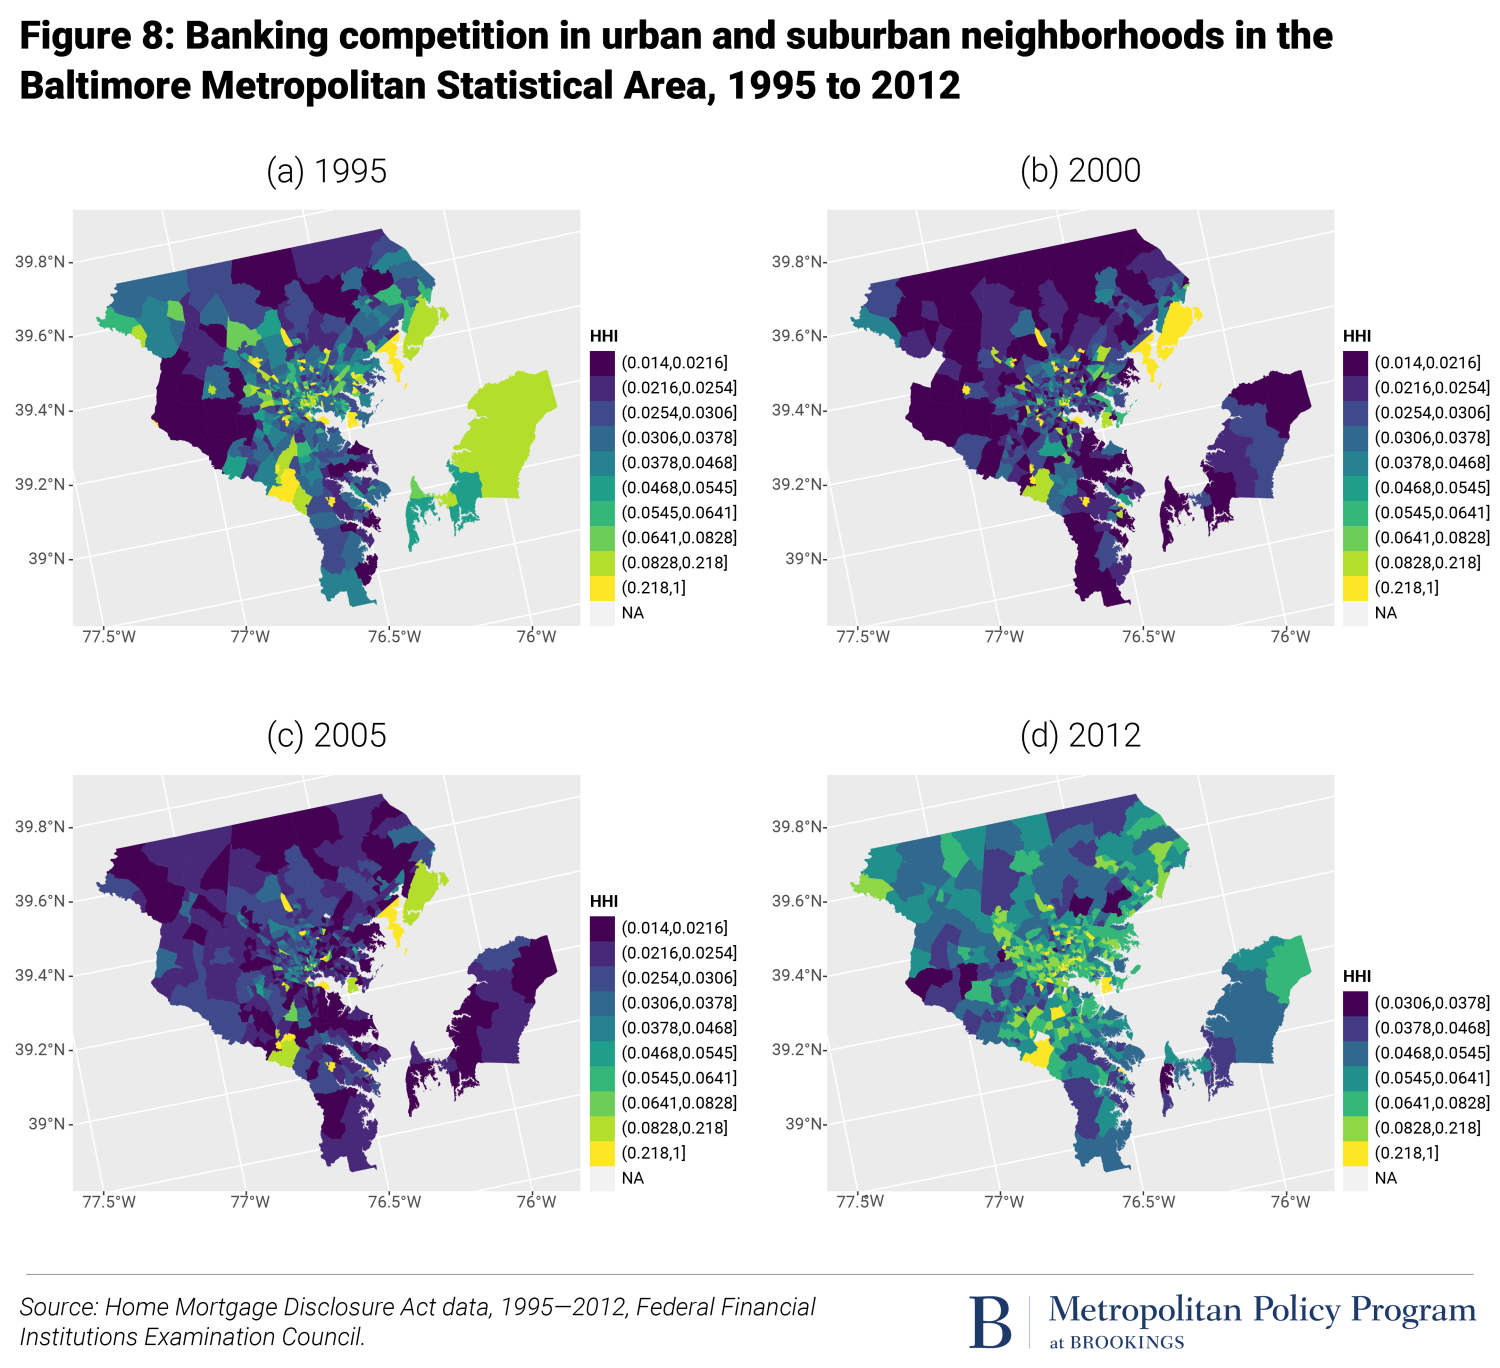
Mapping the geography of mortgage lending reveals new insights and limitations of CRA examinations. The four maps in Figure 8 below suggest that residents of Baltimore City had access to fewer lenders than other residents of metropolitan Baltimore. The map presents the HHI for each census tract. Again, fewer lenders were present in Baltimore City’s majority Black census tracts than majority white and suburban tracts.
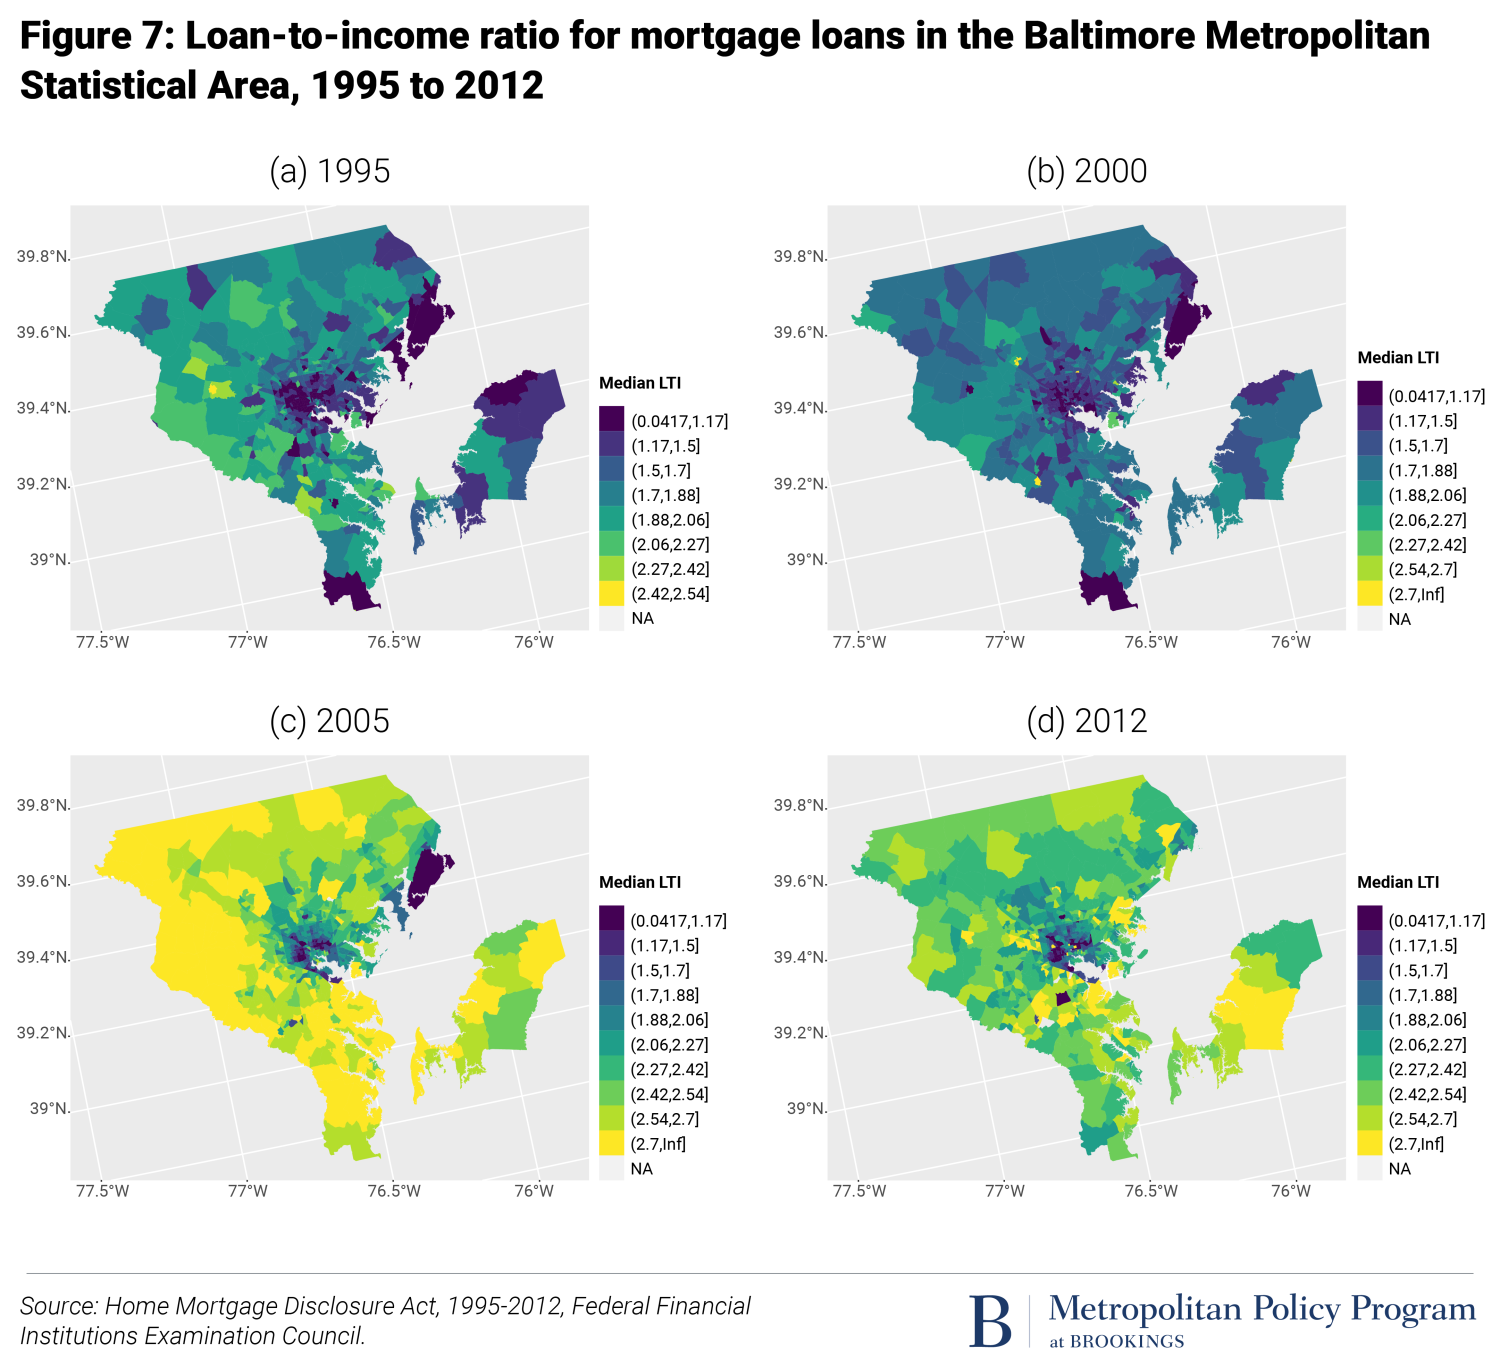
The four maps in Figure 7 suggest that, between 1995 and 2012, residents of the city of Baltimore were granted smaller loans in proportion to their income. The Loan-to-Income (LTI) ratio, a measure of lending standards, is depicted for each census tract. It suggests that lenders have more stringent lending standards in Baltimore City and especially in the city’s majority Black neighborhoods where the LTI ratio is the lowest.
This raises significant questions about the appropriate geographic level of the assessment area of CRA examinations. In a recent report, Johns Hopkins researchers5 describe that large bank lenders are typically assessed based on their lending to low-income census tracts at the state level, rather than at the more granular city or county levels. Channeling the flow of mortgage credit to specific neighborhoods and demographics is key, as across-the-broad increases in mortgage credit supply to all racial groups lead to the growth of urban segregation (Ouazad et al, 2016; Ouazad et al. 2019).
4. Racial inequalities in access to small business loans
A lower level of business ownership and business assets among Black households is a contributing factor to the racial wealth gap. Limited access to capital is the most important factor that constrains the establishment, expansion and growth of Black-owned businesses (Fairlie, Robb, and Hinson, 2010). According to a 2020 report from The Brookings Institution, “Black people represent 12.7% of the U.S. population but only 4.3% of the nation’s 22.2 million business owners.” Black entrepreneurs face barriers to opening businesses with respect to access to credit. Henderson et al. (2015) examined the influence of racial and gender-related factors on access to business credit lines and found that Black-owned startups receive lower than expected business credit scores and that white-owned startups with the same firm characteristics as Black-owned startups are treated more favorably.
Blanchflower, Levine and Zimmerman (2003) found that between 1993 and 1998, Black-owned small businesses were about twice as likely to be denied credit even after controlling for differences in creditworthiness and other factors, suggesting that the racial disparity in credit availability was likely caused by discrimination. Fairlie, Robb, and Robinson (2020) explored racial differences in capital market outcomes associated with launching a new business and found that Black entrepreneurs are less likely to apply for loans than white entrepreneurs because they expect to be denied credit, even when they have a good credit history.
The COVID-19 pandemic has exacerbated the challenges faced by minority-owned businesses (Marte, 2021). Data from the 2020 Small Business Credit Survey found that 92% of Black-owned businesses reported experiencing financial challenges in 2020, compared to 79% for white-owned firms. According to a survey conducted by Reuters, Black business owners were more likely than any other group to suffer financially during the pandemic—38% borrowed money from a friend or relative, 25% worked a second job, and 74% dipped into their personal funds to cover costs.
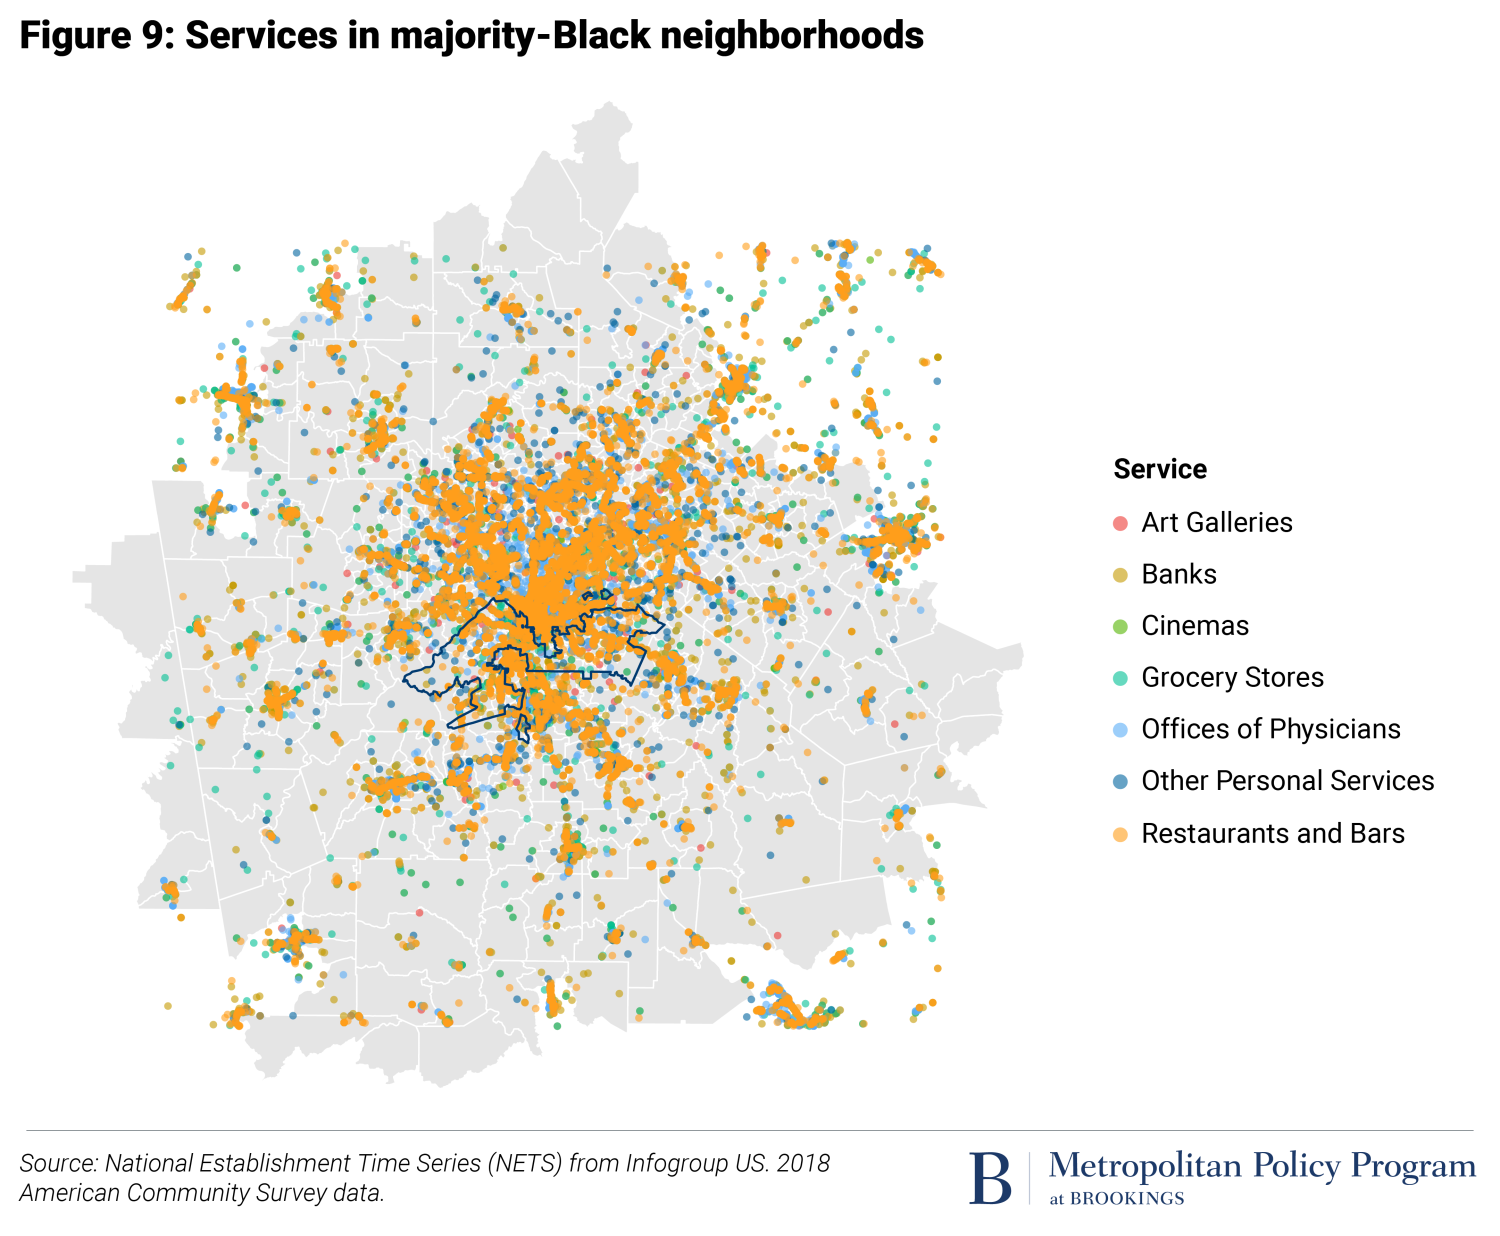
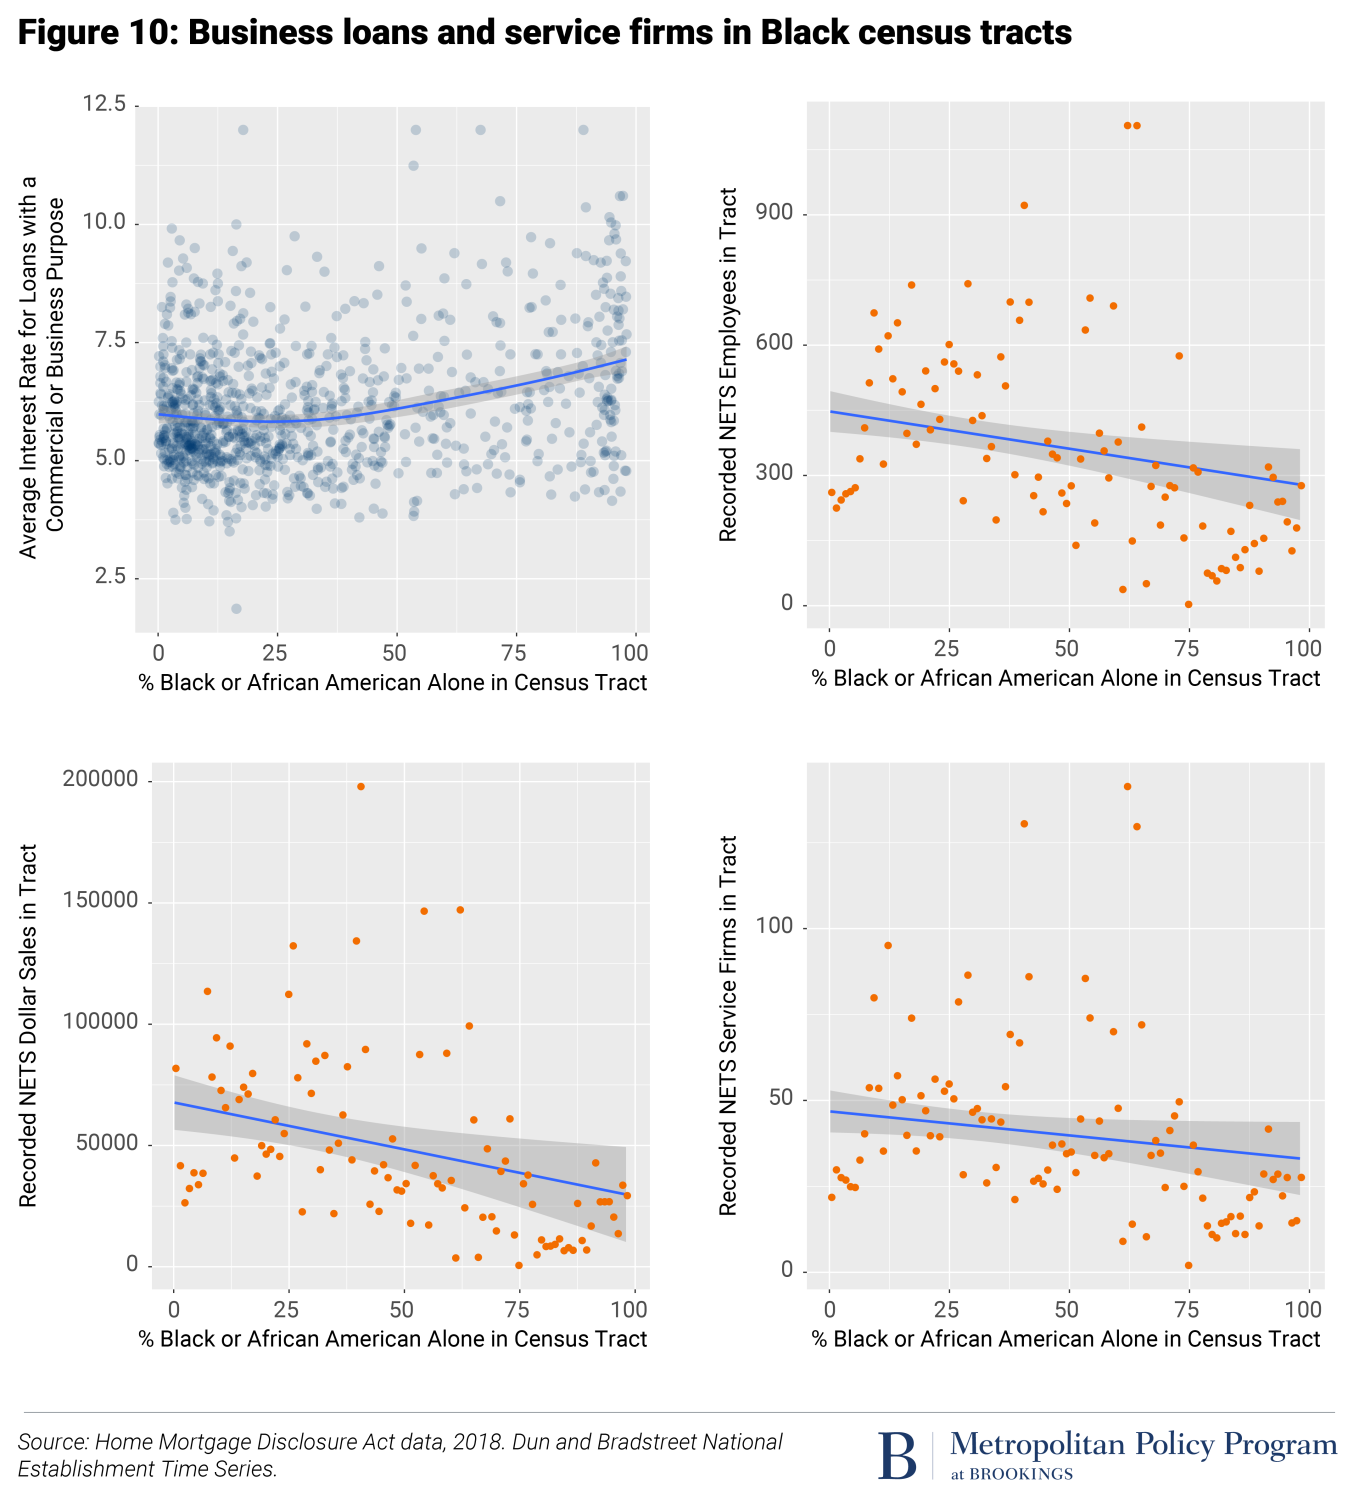
Such documented evidence of credit constraints has significant consequences for the availability of local services in Black neighborhoods. For instance, Beaulac et al. (2009) documents the phenomenon of food deserts across the United States. Figure 9 below displays the important differences in the density of local services across Atlanta using the National Establishment Time Series (NETS) dataset. Such a dataset provides the geocoded location of establishments, their sales, and number of employees. Benchmarking using administrative data suggests that NETS is an accurate portrayal of the cross-section distribution of establishments (Barnatchez et al. 2017). Figure 9 suggests a significantly lower density in majority Black neighborhoods of Atlanta.
Credit constraints are likely to play a role in this uneven distribution of economic activity. The upper-right panel of Figure 10 shows a positive correlation between the interest rate on business and commercial loans and the share Black in a census tract. Interest rates are insensitive to racial composition for the share of Black residents in a neighborhood below 25%, and then grow to be 1 percentage point higher in Black neighborhoods.
This may lead to an unrealized potential for business expansion in Black neighborhoods: Figure 11 presents a set of graphs displaying a negative relationship between the number, sales, and employees of service firms and the fraction of Black residents.
4. Racial inequalities in access to small business loans
A lower level of business ownership and business assets among Black households is a contributing factor to the racial wealth gap. Limited access to capital is the most important factor that constrains the establishment, expansion and growth of Black-owned businesses (Fairlie, Robb, and Hinson, 2010). According to a 2020 report from The Brookings Institution, “Black people represent 12.7% of the U.S. population but only 4.3% of the nation’s 22.2 million business owners.” Black entrepreneurs face barriers to opening businesses with respect to access to credit. Henderson et al. (2015) examined the influence of racial and gender-related factors on access to business credit lines and found that Black-owned startups receive lower than expected business credit scores and that white-owned startups with the same firm characteristics as Black-owned startups are treated more favorably.
Blanchflower, Levine and Zimmerman (2003) found that between 1993 and 1998, Black-owned small businesses were about twice as likely to be denied credit even after controlling for differences in creditworthiness and other factors, suggesting that the racial disparity in credit availability was likely caused by discrimination. Fairlie, Robb, and Robinson (2020) explored racial differences in capital market outcomes associated with launching a new business and found that Black entrepreneurs are less likely to apply for loans than white entrepreneurs because they expect to be denied credit, even when they have a good credit history.
The COVID-19 pandemic has exacerbated the challenges faced by minority-owned businesses (Marte, 2021). Data from the 2020 Small Business Credit Survey found that 92% of Black-owned businesses reported experiencing financial challenges in 2020, compared to 79% for white-owned firms. According to a survey conducted by Reuters, Black business owners were more likely than any other group to suffer financially during the pandemic—38% borrowed money from a friend or relative, 25% worked a second job, and 74% dipped into their personal funds to cover costs.
Such documented evidence of credit constraints has significant consequences for the availability of local services in Black neighborhoods. For instance, Beaulac et al. (2009) documents the phenomenon of food deserts across the United States. Figure 9 below displays the important differences in the density of local services across Atlanta using the National Establishment Time Series (NETS) dataset. Such a dataset provides the geocoded location of establishments, their sales, and number of employees. Benchmarking using administrative data suggests that NETS is an accurate portrayal of the cross-section distribution of establishments (Barnatchez et al. 2017). Figure 9 suggests a significantly lower density in majority Black neighborhoods of Atlanta.
Credit constraints are likely to play a role in this uneven distribution of economic activity. The upper-right panel of Figure 10 shows a positive correlation between the interest rate on business and commercial loans and the share Black in a census tract. Interest rates are insensitive to racial composition for the share of Black residents in a neighborhood below 25%, and then grow to be 1 percentage point higher in Black neighborhoods.
This may lead to an unrealized potential for business expansion in Black neighborhoods: Figure 11 presents a set of graphs displaying a negative relationship between the number, sales, and employees of service firms and the fraction of Black residents.
5. Conclusion: A new agenda
New detailed microdata provide descriptive evidence that Black borrowers and depositors are substantially more constrained in their access to banking services. This is visible across a range of services, including deposits, residential mortgage credit, and business loans. This report suggests a new legislative agenda and a new research agenda. First, supervisory tools developed in the aftermath of the 1977 Community Reinvestment Act do not seem adapted to the “big data” of the 21st century. Better information means it’s easier than ever to identify paths to improvement for bank and nonbank lenders. Second, researchers can observe large parts of the balance sheet and income statement of depository institutions, allowing for an understanding of the match between the savings of Black depositors and the flow of loans to Black residents and businesses. This should spark a research agenda that makes financial data science more useful than ever to address 21st century inequalities.
Related Content

Bibliography
Aaronson, D., Hartley, D.A. and Mazumder, B., 2017. The Effects of the 1930s HOLC’s “Redlining” Maps.
Agarwal, S., Amromin, G., Ben-David, I., Chomsisengphet, S. and Evanoff, D.D., 2014. Predatory lending and the subprime crisis. Journal of financial economics, 113(1), pp.29-52.
Ammons, L. (1996). The evolution of Black-owned banks in the United States between the 1880s and 1990s. Journal of Black Studies, 26(4), 467-489.
Barnatchez, K., Crane, L.D. and Decker, R., 2017. An assessment of the national establishment time series (nets) database.
Beaulac, J., Kristjansson, E. and Cummins, S., 2009. Peer reviewed: A systematic review of food deserts, 1966-2007. Preventing chronic disease, 6(3).
Bhutta, N., Chang, A. C., Dettling, L. J., Hsu, J. W., & Hewitt, J. (2020). Disparities in Wealth by Race and Ethnicity in the 2019 Survey of Consumer Finances. FEDS Notes, (2020-09), 28-2.
Blanchflower, D. G., Levine, P. B., & Zimmerman, D. J. (2003). Discrimination in the small-business credit market. Review of Economics and Statistics, 85(4), 930-943.
Burton, A., Scheck, J., and West, John., 2020. The Battle to Keep America’s Black Banks Alive. The Wall Street Journal.
Calem, P.S., Hershaff, J.E. and Wachter, S.M., 2004. Neighborhood patterns of subprime lending: Evidence from disparate cities. Housing Policy Debate, 15(3), pp.603-622.
Carr, J.H. and Kolluri, L., 2001. Predatory lending: An overview. Fannie Mae Foundation, pp.1-17.
Carr, J.H. and Megbolugbe, I.F., 1993. The Federal Reserve Bank of Boston study on mortgage lending revisited. Journal of Housing Research, pp.277-313.
Cohen-Cole, E., 2011. Credit card redlining. Review of Economics and Statistics, 93(2), pp.700-713.
Dunham et al. (2018). Navigating the Dual Financial Service System: Neighborhood-Level Predictors of Access to Brick-and-Mortar Financial Services. The California Geographer, 57.
Ergungor, O.E., 2010. Bank branch presence and access to credit in low‐to moderate‐income neighborhoods. Journal of Money, Credit and Banking, 42(7), pp.1321-1349.
Fairlie, R. W., Robb, A. M., & Hinson, D. (2010). Disparities in capital access between minority and non-minority-owned businesses. US Department of Commerce, Minority Business Development Agency.
Fairlie, R. W., Robb, A., & Robinson, D. T. (2020). Black and white: Access to capital among minority-owned startups (No. w28154). National Bureau of Economic Research.
Federal Deposit Insurance Corporation. Minority Depository Institutions Program. Minority Depository Institutions List. Retrieved from https://www.fdic.gov/regulations/resources/minority/mdi.html
Fishback, P.V., LaVoice, J., Shertzer, A. and Walsh, R., 2020. Race, risk, and the emergence of federal redlining (No. w28146). National Bureau of Economic Research.
Fox, Z., Tariq, Z., Thomas, L., Palicpic, C., 2019. Bank branch closures take greatest toll on majority-black areas. S&G Global.
Friesenhahn, S.M. and Kwan, S.H., 2021. Minority Banks during the COVID-19 Pandemic. FRBSF Economic Letter, 2021(20), pp.01-05.
Fuster, A., Plosser, M., Schnabl, P. and Vickery, J., 2019. The role of technology in mortgage lending. The Review of Financial Studies, 32(5), pp.1854-1899.
Gerena, C. (2007). Opening the vault. Federal Reserve Bank of Richmond Region Focus.
Gotham, K.F., 2000. Urban space, restrictive covenants and the origins of racial residential segregation in a US city, 1900–50. International Journal of Urban and Regional Research, 24(3), pp.616-633.
Hegerty, S.W., 2016. Commercial bank locations and “banking deserts”: A statistical analysis of Milwaukee and Buffalo. The Annals of Regional Science, 56(1), pp.253-271.
Horrigan, J.B., 2020. Baltimore’s Digital Divide: Gaps in Internet Connectivity and the Impact on Low-Income City Residents. The Abell Report. Volume 33, No. 4. Abell Foundation.
Howell, S., Kuchler, T., Snitkof, D., Stroebel, J. and Wong, J., 2021. Racial Disparities in Access to Small Business Credit: Evidence from the Paycheck Protection Program. NBER Working Paper, (w29364).
Kashian, R.D., Contreras, F. and Perez-Valdez, C., 2016. The Changing Face of Communities Served by Minority Depository Institutions: 2001-2015.
Li, L., Strahan, P.E. and Zhang, S., 2020. Banks as lenders of first resort: Evidence from the COVID-19 crisis. The Review of Corporate Finance Studies, 9(3), pp.472-500.
Marte, J., 2021. Black and Hispanic firms half as likely to get needed financing, Fed study finds. Reuters.
McKinney, Jeffrey (2019). Looking Back at the History of America’s Black Banks, Even as They Strive for Vitality. Black Enterprise
Mills, C.K. and Battisto, J., 2020. Double jeopardy: COVID-19’s concentrated health and wealth effects in Black communities. Federal Reserve Bank of New York.
Moise, I. (2019). African Americans undeserved by U.S. banks: study. Reuters. Retrieved on January 23, 2021 from https://www.reuters.com/article/us-usa-banks-race/african-americans-underserved-by-u-s-banks-study-idUSKCN1V3081
Molloy, R., Smith, C.L. and Wozniak, A., 2017. Job changing and the decline in long-distance migration in the United States. Demography, 54(2), pp.631-653.
Munnell, A.H., Tootell, G.M., Browne, L.E. and McEneaney, J., 1996. Mortgage lending in Boston: Interpreting HMDA data. The American Economic Review, pp.25-53.
Ouazad, A. and Rancière, R., 2016. Credit standards and segregation. Review of Economics and Statistics, 98(5), pp.880-896.
Ouazad, A. and Rancière, R., 2019. City equilibrium with borrowing constraints: Structural estimation and general equilibrium effects. International Economic Review, 60(2), pp.721-749.
Partnership for Progress. 2021. Minority Banking Timeline Milestones. Board of Governors of the Federal Reserve System
Perry, A., Rothwell, J., Harshbarger, D., 2020. The devaluation of businesses in Black communities. Metropolitan Policy Program at The Brookings Institution.
Pike, K., 2021. Why we need Black-owned banks. Independent Banker.
Price, D.A., 1990. Minority-owned banks: History and trends. Economic commentary, (Jul).
Rhine, S.L., Greene, W.H. and Toussaint-Comeau, M., 2006. The importance of check-cashing businesses to the unbanked: Racial/ethnic differences. Review of Economics and Statistics, 88(1), pp.146-157.
Ross, S.L. and Yinger, J., 2002. The color of credit: Mortgage discrimination, research methodology, and fair-lending enforcement. MIT press.
Shift Credit Card Processing. 2021. Credit Score Statistics. Accessed at: https://shiftprocessing.com/credit-score/#race
Sood, A., Speagle, W. and Ehrman-Solberg, K., 2019. Long Shadow of Racial Discrimination: Evidence from Housing Covenants of Minneapolis, mimeo.
Todd, T., 2019. Let Us Put Our Money Together: The Founding of America’s First Black Banks. Federal Reserve Bank of Kansas City.
Toussaint-Comeau, M. and Newberger, R., 2017. Minority-owned banks and their primary local market areas. Economic Perspectives, 4(4), pp.1-31.
Toussaint-Comeau, M., Wang, Y.D. and Newberger, R., 2020. Impact of Bank Closings on Credit Extension to Businesses in Low-Income and Minority Neighborhoods. The Review of Black Political Economy, 47(1), pp.20-49.
Van Tol, J. 2020. Reduce lending in low-income neighborhoods? Incredibly, the government has a plan that could help banks do that. The Hill.
Authors


-
Footnotes
- Goodman, L., 2021. Housing Finance At A Glance: A Monthly Chartbook: August 2021.
- The HHI is a measure of banking concentration ranging from a low of 0 to a high of 10,000, where higher numbers indicate less competition. In this section, the HHI is for dollar deposits. In section 3, the HHI is based on mortgage originations.
- Aaronson et al. (2017) uses regression discontinuity designs at the boundaries of HOLC maps to estimate the impact of redlining on 20th and 21st century homeownership, house values and credit scores. Fishback et al. (2020) present evidence that redlining maps reflect the existing level of discrimination and segregation.
- These findings are replicated and confirmed by Carr et al. (1993).
- Mary Miller, Ben Seigel, and Mac McComas, “Financing Baltimore’s Growth: Strengthening Lending to Small Businesses” 2018.