
Part III of the 2014 Brown Center Report on American Education
 William H. Schmidt of Michigan State University presented research on the Common Core State Standards (CCSS) for Mathematics at the National Press Club on May 3, 2012.[1] A paper based on the same research, co-authored with Richard T. Houang, was published in Educational Researcher in October 2012.[2] Schmidt and Houang’s study (also referred to as the “MSU study” below) was important for endorsing CCSS’s prospective effectiveness at a time when debate on the CCSS was beginning to heat up. Opponents of the Common Core had criticized the CCSS for lacking empirical support. The MSU study showed that states with math standards similar to the Common Core, after controlling for other potential influences, registered higher NAEP scores in 2009 than states with standards divergent from the CCSS. The implication was that the math standards of CCSS would boost state math performance on NAEP.
Is there reason to believe that projection will become reality? In this section of the Brown Center Report, a two-part investigation attempts to answer that question. First, the ratings of state standards provided by Schmidt and Houang’s study are examined using NAEP data that have been collected since their study was completed. The central question is whether the MSU ratings predict progress on NAEP from 2009-2013. Second, a new analysis is presented, independent from the MSU ratings, comparing the NAEP gains of states with varying degrees of CCSS implementation. The two analyses offer exploratory readings of how the Common Core is affecting achievement so far.
Background
Schmidt and Houang used state NAEP scores on the 2009 eighth grade math assessment to model the potential effectiveness of the CCSS. They first developed a scale to rate the degree of congruence of each state’s standards with the CCSS. The ratings were based on earlier work also conducted by Schmidt and his colleagues at MSU. That work made a lasting and important contribution to curriculum studies by attempting to represent the quality of curriculum standards—both international and domestic—in a quantitative form.[3] The key dimensions measured in the MSU ratings are focus and coherence. Focus refers to limiting topics in the math curriculum to the most important topics and teaching them in depth. Coherence refers to organizing topics in a manner that reflects the underlying structure of mathematics, allowing knowledge and skills to build sequentially.
In the National Press Club talk, Schmidt presented a chart showing how the states fell on the congruence measure (see Table 3-1). Alabama, Michigan, California, and the others at the top of the scale had standards most like the CCSS math standards. Arizona, Nevada, Iowa and those at the bottom of the scale had standards that diverged from the CCSS.
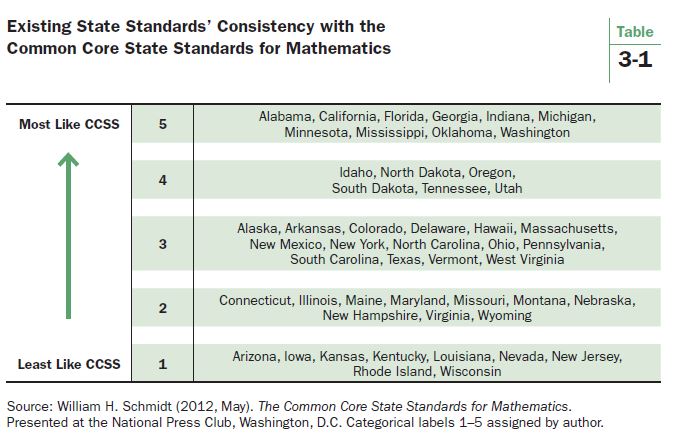
Table 3-1 includes a categorical variable (1-5) for the five congruency ratings. The MSU authors used the continuous form of the congruence ratings along with demographic covariates in a regression equation that predicted state NAEP scores. The congruence rating was statistically insignificant. No relationship to achievement was uncovered. An analysis of residuals, however, revealed two distinct sets of states (referred to as “Group A” and “Group B”). (Key differences between the two groups are discussed below.) Regression equations incorporating membership in these two groups did produce statistically significant coefficients for the congruence rating.
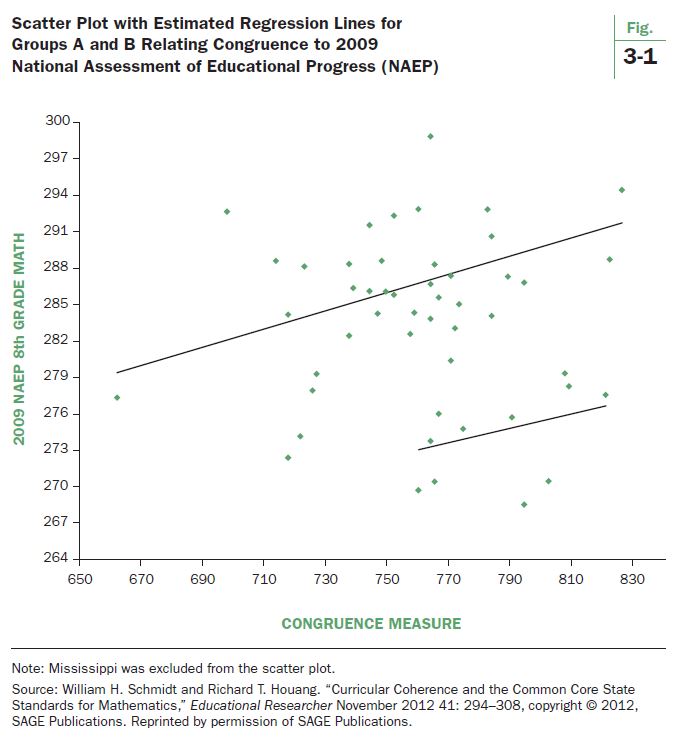
Figure 3-1, reproduced from the Educational Researcher article, clearly shows two upward sloping regression lines. The MSU authors concluded that that it was time to end the debate over the wisdom of the Common Core and that the CCSS in math “deserve to be seriously implemented.”[4]
Examining NAEP Gains with the MSU Ratings
NAEP scores for 2011 and 2013 have been released since the Schmidt and Houang study. These scores offer the opportunity to update Schmidt and Houang’s findings. They also allow a check of the study’s most important policy lesson, that states adopting the CCSS in math could expect an increase in their eighth grade NAEP math scores. Examining gain scores—specifically, the change in state scores since 2009—provides a way to evaluate the predictive capacity, at least in the short run, of the 2009 MSU analysis. By relying on cross-sectional data, NAEP scores from a single point in time, the Schmidt and Houang analysis helps to explain the performance of states in 2009. But states adopt policies with an eye toward future results. Did the states with standards most like the CCSS in 2009 continue to make the greatest gains in later years? Gain score analysis also possesses a technical advantage. It is generally superior to cross-sectional analysis in controlling for omitted variables that may influence achievement by “baking them into the cake” at baseline.[5]
Tables 3-2, 3-3, and 3-4 report the average gains of states expressed as changes in scale score points on the eighth grade NAEP math assessment. The states are grouped by their MSU rating. Bear in mind that the 2009 MSU ratings were assigned based on the math standards then in place. States with a “5” had math standards most similar to the CCSS. States with a “1” had math standards most divergent from the CCSS.
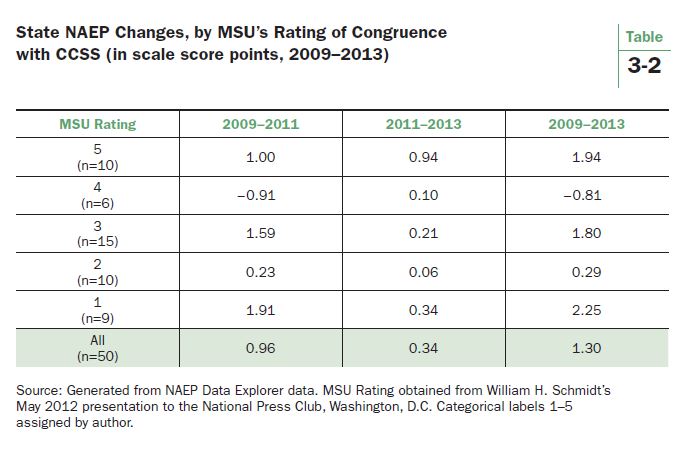
Table 3-2 reveals no systematic relationship between the states’ MSU ratings and changes in NAEP from 2009-2013. Indeed, states with standards most different from the CCSS (rated 1) gained the most on NAEP (2.25). States with standards most like the CCSS scored the next largest gains (1.94); and states with a 4 rating (second most similar group to the CCSS) lost ground, declining -0.81. The data are lumpy, so whether a positive relationship is expected (i.e., states scoring 5 should make the greatest gains, 4 the next greatest gains, and so forth) or a negative relationship (states scoring 1 should make the greatest gains because they have the most to gain from adopting CCSS, states scoring 2 have the next most to gain, etc.), no statistical relationship is evident. No linear pattern emerges across the categories.
What about the two time intervals, 2009-2011 and 2011-2013? NAEP scores are more stable over longer periods of time so the four year interval is probably a preferable indicator. In addition, a clear point of demarcation does not exist for when an old set of standards ends and a new set begins. Nevertheless, let’s consider how the CCSS unfolded to guide the consideration of the data by different time periods.
The 2009-2011 interval should probably receive the closest scrutiny in probing for a correlation of state achievement with 2009 standards. Those standards were still operational from 2009-2011. The states rated “1” notched particularly strong gains (1.91) during this period. States rated “4” actually declined (-0.91). That is not what one would expect if the MSU ratings accurately reflected the quality of 2009 standards.
The 2011-2013 interval should represent the strongest early indicator of gains after adopting the CCSS. Forty-five states had adopted the CCSS math standards by 2011. In a survey of state officials in 2011, most declared that they had begun the implementation process (progress in implementation receives explicit attention below).[6] The gains for this interval might be expected to be inversely related to the MSU ratings, with larger gains coming from the states rated “1.” They were making the most dramatic curricular changes and should experience the most growth that accrues from adopting the CCSS. That expectation isn’t met either. States with a “5” made the largest gains (0.94); however, the second largest gains were recorded by the states with a “1” rating (0.34).
Recall that Schmidt and Houang did not find a significant relationship until they divided the states into two groups, Group A and Group B. Group A consists of 37 states and Group B has 13 states. The groups are quite different demographically. More than half of the Group B states are Southern. They have lower per capita wealth and serve a greater proportion of black and Hispanic students. They receive more federal funding than Group A states. They also scored about 14.67 scale score points lower than Group A states on the 2009 NAEP. Schmidt and Houang speculate that the states in Group B, despite many having high quality math standards, faced a more difficult implementation environment because of demographic challenges and resource constraints.
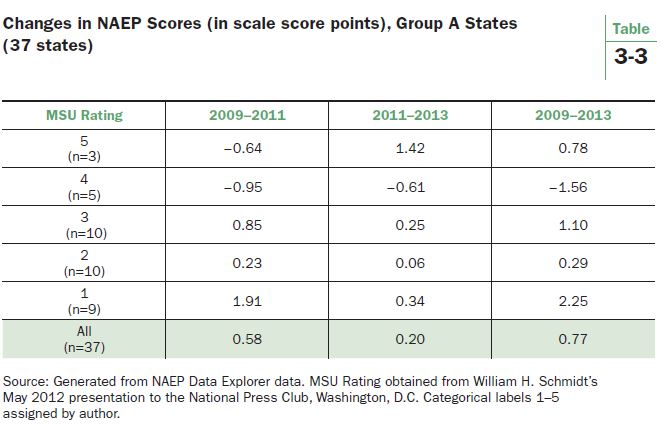
Tables 3-3 and 3-4 disaggregate the gains by these two groups. Table 3-3 examines the A group. The NAEP changes generally contradict the MSU ratings. From 2009-2013, the states with the weakest congruence with CCSS made the greatest gains (2.25). The changes from 2009-2011 are the most glaring. States with the strongest ratings (the 5’s) lost ground (-0.64), and the states rated “1” scored gains (1.91). Note, though, that some of the ratings groups have become quite small (only three states in Group A have a “5” rating), so these figures must be taken with several grains of salt. Also observe that all of the states with ratings of “1” or “2” belong to group A. Consequently, the results for these states in Table 3-3 are the same as in Table 3-2.
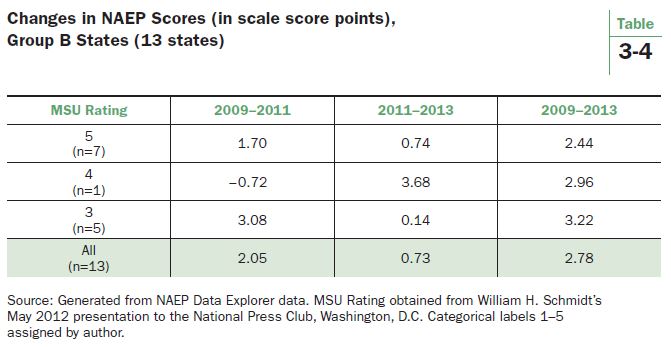
Table 3-4 examines the states in Group B. Note that the ratings divide what is already a small group, 13 states, into even smaller groups. The states rated “5” registered the smallest gain (2.44) of the ratings groups for 2009-2013. As a whole, from 2009-2013 the Group B states made larger gains than the Group A states (2.78 vs. the 0.77 reported in Table 3-3), narrowing the gap with the A states by about two NAEP scale score points.
This may indicate regression to the mean. There could also be another, unknown factor driving the relatively larger gains by Group B states. Whatever the cause, the gains in Group B states cast doubt on Schmidt and Houang’s hypothesis that implementation difficulties lie at the heart of Group B’s underperformance on the 2009 NAEP. If these states had trouble implementing their own standards prior to 2009, it is difficult to imagine them suddenly discovering the secret to implementation in the first few years with the Common Core. And if resource constraints were a primary factor hobbling past efforts at implementation, surely finding adequate resources during the Great Recession limited what the Group B states could accomplish.
In sum, the Schmidt and Houang ratings of state math standards in 2009 do not predict gains on NAEP very well in subsequent years. The notion that disaggregating the states into two groups would clarify matters because 13 states (Group B) faced implementation challenges also does not receive support. Whether in Group A or Group B, states with 2009 math standards most dissimilar to the Common Core made the largest NAEP gains from 2009-2013.
NAEP Changes in Light of Common Core’s Implementation
As Schmidt and Houang point out—and any informed observer would surely agree—the progress states make in implementing the CCSS is crucial to the standards’ impact on achievement. The MSU congruence ratings were designed to serve as substitutes for CCSS implementation measures, there being no implementation to measure in 2009. Now, with the passage of time, it is possible to get an early reading on implementation from a direct measure of state efforts. A 2011 survey of state educational agencies was mentioned above. The survey was conducted as part of a U.S. Department of Education study of reforms promoted by the Recovery Act. The Common Core was one such reform. The survey asked states if they had: 1) adopted the CCSS; 2) provided, guided, or funded professional development on the CCSS; 3) provided curriculum/instructional materials for the CCSS; and 4) worked with a consortium to develop assessments aligned with the CCSS.
For the current study, the states’ responses were utilized to create an implementation rating. Modifications to the survey answers were made if a press report was located updating a state’s status after the 2011 survey was conducted. Montana, Washington, and Wyoming, for example, had not yet adopted the CCSS when the survey was conducted, but they did soon thereafter. Georgia, Kansas, Oklahoma, Pennsylvania, and Utah have either withdrawn from their respective CCSS assessment consortium or announced a freeze on CCSS testing.
The category “non-adopter” was assigned to states that answered “no” to all four questions. That group consists of Alaska, Minnesota, Nebraska, Texas, and Virginia. Those states are going their own way on math standards and can serve as a control group for CCSS.[7] At the other end of the implementation continuum, the category “strong” was assigned to states answering “yes” to all four questions. A total of 19 states have adopted the CCSS, taken steps to provide both professional development and curriculum/instructional materials aligned with CCSS, and are members of a consortium designing CCSS assessments. They are the strong implementers of CCSS. The remaining 26 states are medium implementers. They adopted CCSS but have not taken all of the other steps available to them to implement the standards.
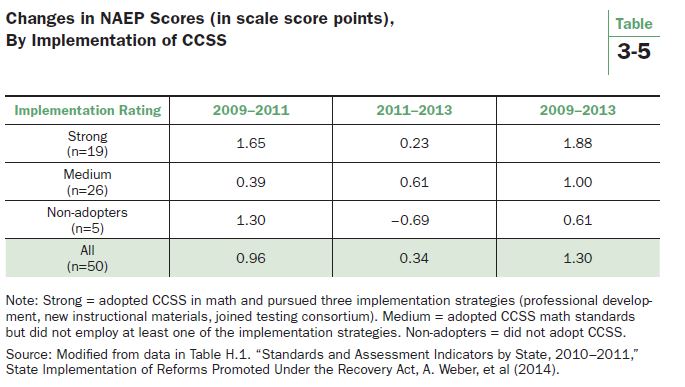
Table 3-5 shows the average NAEP gains of the states based on implementation of CCSS. The 2009-2013 gains are what CCSS advocates hope for, at least in terms of a consistent pattern. The strong implementers made the largest gains (1.88), followed by the medium implementers (1.00), and then the non-adopters (0.61). The 2011-2013 pattern is also favorable towards the implementers of the CCSS. The medium implementers made the most progress (0.61) and the strong implementers made gains (0.21), although less than in 2009-2011. Caution must be exercised with the non-adopters since they only include five states, and Alaska’s decline of 1.49 scale score points from 2009-2013 diminishes what was an average gain of more than one point by the other four states.
Discussion
The Schmidt and Houang state standards ratings of 2009 proved to be a poor predictor of progress on NAEP in subsequent years. A rating based on states’ implementation activities did reveal a pattern. States that more aggressively implemented the CCSS registered larger gains from 2009-2013. That’s an optimistic finding for CCSS.
Let’s evaluate the magnitude of potential gains from CCSS using that optimistic finding. Start by recognizing that from 1990-2013—the entire history of the main NAEP assessment—scores on the eighth grade math test rose from 263 to 285, a gain of 22 points. That averages to about one scale score point per year. The gains from 2009-2013 have significantly lagged that pace. As reported in Table 3-5, the average gain for the entire period was 1.30, which comes out to 0.33 per year. Critics of CCSS might suspect that the transition to CCSS is responsible for the slowing, but the data presented here do not support the charge. The five states that rejected the CCSS have performed worse than the states that adopted CCSS.
But how much worse? What is the difference? Not much. The 1.27 gap between strong implementers and non-adopters is about .035 of the 2009 NAEP’s standard deviation (36). A rule of thumb is that differences of less than .20 SD are not even noticeable, let alone significant. If it takes four years for the CCSS to generate a .035 SD improvement, it will take 24 years for a noticeable improvement to unfold. And that improvement would add up to 7.62 NAEP scale score points, a gain in 24 years that falls far short of the 22 point gain that NAEP registered in its first 23 years.
Recent NAEP gains might be disappointing because the economic turmoil of the past few years presented an inopportune time for implementing new standards. That’s possible, but the historical record is mixed. The early 1990s recession was accompanied by weak NAEP gains, but the early 2000s recession took place while NAEP scores were soaring. Perhaps the positive effects of the CCSS will not fully emerge until assessments aligned with the standards are administered and accountability systems tied to the results are launched. There is evidence that the test-based accountability systems of the late 1990s and the NCLB inspired systems of the early 2000s had a positive impact on achievement; however, in many jurisdictions, accountability systems were then being implemented for the first time.[8] The new CCSS accountability systems will be replacing systems that are already in place. The quality that they add to or subtract from existing systems is unknown. Moreover, as the consequences of NCLB’s accountability systems began to be felt, significant political opposition arose in many states. Whether the CCSS systems experience the same backlash remains to be seen.
Can the small, insignificant effect of implementation be reconciled with the MSU study? Schmidt and Houang reported the tests of statistical significance for their congruence rating but they did not report an estimate of CCSS effects on NAEP scores. It is always possible for a statistically significant regression coefficient to denote an effect that is insignificant in the real world. Statistical significance tells us that we can be confident that an effect is different from zero, not that the difference is important. This is an especially relevant distinction when an analysis of NAEP data is conducted with states as the unit of analysis. As pointed out in a 2012 Brown Center Report study of the CCSS, most variation on NAEP lies within states—between students, not between states.[9] The standard deviation of state NAEP scores on the 2009 math test is 7.6 points. The standard deviation of the 2009 NAEP eighth grade math score, a statistic based on variation in student performance, is 36 points—four to five times larger.
An illustration of what these two SDs mean for interpreting the magnitude of CCSS effects is revealing. Schmidt and Houang’s congruence rating has a range of 662-826, mean of 762, and SD of 33.5. The regression coefficient for the congruence rating was 0.08.[10] A statistical convention is to calculate the impact that a one SD change in an independent variable (in this case, the congruence rating) has on the dependent variable (in this case, the 2009 eighth grade NAEP score). In plain English, how much of a boost in NAEP scores can we expect from a pretty big increase in the congruence rating? A little arithmetic produces the following: a one SD gain in the congruence rating (33.5 points) is predicted to yield a NAEP gain of 2.68 points. Consider that gain in terms of the two SDs. It is about 0.35 of the state-level SD—a moderate but noticeable effect that is consistent with MSU’s finding of statistical significance. But as a proportion of the student-level SD, the effect is only 0.07 SD, which is quite small, even undetectable. Moreover, the MSU analysis could not assign a firm estimate of how much time it took for states with standards similar to CCSS to generate this tiny effect, although six to eight years is a good guess.[11]
The point here is not that Schmidt and Houang did anything wrong. State level policies certainly can be evaluated with state-level data. The problem is that a statistically significant finding from an analysis of state-level NAEP scores, the variation among states being relatively small, often fades to insignificance when considered in the more practical, real world terms of how much math students are learning. It is doubtful that even the most ardent Common Core supporter will be satisfied if the best CCSS can offer—after all of the debate, the costs in tax revenue, and blood, sweat, and tears going into implementation—is a three point NAEP gain.
The 2012 Brown Center Report predicted, based on empirical analysis of the effects of state standards, that the CCSS will have little to no impact on student achievement. Supporters of the Common Core argue that strong, effective implementation of the standards will sweep away such skepticism by producing lasting, significant gains in student learning. So far, at least—and it is admittedly the early innings of a long ballgame—there are no signs of such an impressive accomplishment.
Part III Notes:
[1] William H. Schmidt, New Research Links Common Core Math Standards to Higher Achievement. Presented at the National Press Club, May 3, 2012. PowerPoint available at http://www.achieve.org/files/BILL_CCSSM.ppt.
[2] William H. Schmidt and Richard T. Houang, “Curricular Coherence and the Common Core State Standards for Mathematics,” Educational Researcher 41, no. 8 (2012): 294-308.
[3] William H. Schmidt, Curtis C. McKnight, Gilbert A. Valverde, Richard T. Houang, and David E. Wiley, Many visions, many aims, Volume I: A crossnational investigation of curricular intentions in school mathematics (Dordrecht: Kluwer Academic Publishers, 1997); William H. Schmidt, Curtis C. McKnight, Senta A. Raizen, Pamela M. Jakwerth, Gilbert A. Valverde, Richard G. Wolfe, Edward D. Britton, Leonard J. Bianchi, and Richard T. Houang, A splintered vision: An investigation of US science and mathematics education. Vol. 3. (Boston: Kluwer Academic Publishers, 1997); William H. Schmidt and Richard T. Houang, “Lack of Focus in the Mathematics Curriculum: Symptom or Cause?” in Lessons Learned: What International Assessments Tell Us about Math Achievement, ed. Tom Loveless (Washington: Brookings Institution Press, 2007).
[4] William H. Schmidt and Richard T. Houang, “Curricular Coherence and the Common Core State Standards for Mathematics,” Educational Researcher 41, no. 8 (2012): pp. 307.
[5] Jan-Eric Gustafsson, “Understanding Causal Influences on Educational Achievement through Analysis of Differences over Time within Countries,” in Lessons Learned: What International Assessments Tell Us about Math Achievement, ed. Tom Loveless (Washington: Brookings Institution Press, 2007).
[6] A 2011 survey of state education agencies is reported by Webber et. al, “State Implementation of Reforms Promoted Under the Recovery Act,” U.S. Department of Education (January 2014).
[7] Minnesota adopted the CCSS in English-Language Arts.
[8] For a description of standards and accountability systems in the late 1990s, see Education Week, Quality Counts: Rewarding Results, Punishing Failure (January 11, 1999). For evidence of positive effects of test based accountability, see Thomas Dee and Brian A. Jacob, “Evaluating NCLB,” Education Next 10, no. 3 (Summer 2010); Manyee Wong, Thomas D. Cook, and Peter M. Steiner, “No Child Left Behind: An Interim Evaluation of Its Effects on Learning Using Two Interrupted Time Series Each with Its Own Non-Equivalent Comparison Series,” Working Paper 09-11 (Evanston, IL: Northwestern University Institute for Policy Research, 2009); Eric A. Hanushek and Margaret E. Raymond, “Does school accountability lead to improved student performance?” Journal of Policy Analysis and Management 24, no.2 (Spring 2005): 297-327; Martin Carnoy and Susanna Loeb, “Does external accountability affect student outcomes? A cross-state analysis,” Educational Evaluation and Policy Analysis 24, no. 4 (2002): 305-331.
[9] Tom Loveless, The 2012 Brown Center Report on American Education (Washington: The Brookings Institution, 2012).
[10] Summary statistics for rating of congruence is on page 300 and regression output is on page 304 of William H. Schmidt and Richard T. Houang, “Curricular Coherence and the Common Core State Standards for Mathematics,” Educational Researcher 41, no. 8 (2012): 294-308.
[11] The No Child Left Behind (NCLB) Act of 2001required standards in all states. About half of the states already had standards in place before NCLB. Schmidt and Houang’s statement is that eighth graders in 2009 probably spent all or most of their school years learning math under the state standards then in place.
| « Part II: Homework in America |