
The Great Recession created some of the toughest employment conditions that American workers experienced in the postwar period. The economy overall shed 8.7 million jobs in 2008 and 2009, and the unemployment rate reached a 25-year high of 10 percent in 2009. That year, more than 14 million Americans were looking for work but unable to find it, more than double the number before the recession started.
As Brookings’ Metro Monitor has demonstrated, however, the impacts of the recession have varied widely across the nation’s major metropolitan economies. This owes to several factors, including differing industrial specializations and house-price trends across metro areas, as my colleague Jonathan Rothwell has shown. In assessing the economic health of major metro areas, the Metro Monitor incorporates, among other indicators, BLS data on unemployment rates, which reflect that the vast majority of areas still have a higher unemployment rate than pre-recession.
However, the unemployment rate is an incomplete picture of the state of the labor market. That is because it only captures the share of individuals who are looking for work, but unable to find it. It thus leaves out a large number of Americans who, frustrated by the state of the job market, have decided not to look for work, or have given up doing so. Moreover, it focuses on all individuals age 16 and over in the labor market, which may include many younger and older people who are not in their prime working years.
That is why Federal Reserve Chair Janet Yellen, among many others, also looks at the prime-age labor force participation rate when assessing the health of the economy. That indicator measures the share of individuals aged 25 to 64 who are either employed or looking for work. The unemployment and labor force participation rates together offer a fuller picture of the national labor market situation.
Typically, data on labor force participation are available only for the United States as a whole, or sometimes for states. However, analysts can also use the Census Bureau’s American Community Survey to assess these dynamics in metropolitan areas on an annual basis. This analysis examines trends for the 100 largest metropolitan areas in their prime-age civilian employment-to-population ratio (here abbreviated as employment ratio) from 2007 to 2013. This ratio is calculated as the number of 25 to 64 year-olds who are working, divided by the total number of people in that age group. In this way, the employment ratio (ER) captures both the unemployment rate (UR) and the labor force participation rate (LFPR) for the population most likely to work, as ER = (1-UR)*LFPR. The 100 metro areas examined here are the largest by population in 2013. Of these 100, the Office of Management and Budget revised the boundaries of 29 between 2007 and 2013 so that the data measure slightly different geographies in each year, but these differences are not large enough to affect the results of this analysis (those metro areas are denoted in the linked appendix table). The analysis finds the following:
The overall employment ratio in major metro areas was lower in 2013 than in 2007.
In 2007, about 79 million of 106 million adults aged 25 to 64 in the nation’s 100 largest metro areas were working, equating to an employment ratio of 74.8 percent (Figure 1). This ratio dipped in 2010 to 72 percent, as 1 million fewer adults were working that year, even though their overall numbers had increased by nearly 3 million. By 2013, the employment level among 25 to 64 year-olds had rebounded to 82 million, but that still represented only 73.3 percent of the total population in that age range. As such, these metro areas in the aggregate fell short of their pre-recession employment ratio by 1.5 percentage points, or the equivalent of 1.6 million workers in 2013.
Figure 1. Prime-Age Employment Ratio (%), 100 Largest Metro Areas, 2007-2013
Employment-to-population ratio, civilian population aged 25 to 64. Source: Brookings analysis of American Community Survey data
Two-thirds of major metro areas had a lower prime-age employment ratio in 2013 than in 2007.
As Figure 1 illustrates, the 2007 to 2013 period captures periods of both steep downturn and slow recovery of the U.S. labor market. In the vast majority of metro areas (86 of 100), the employment ratio declined from 2007 to 2010. In half, the ratio then increased from 2010 to 2013 (50 of 100). Yet in most cases, that later increase failed to fully offset a steep initial drop.
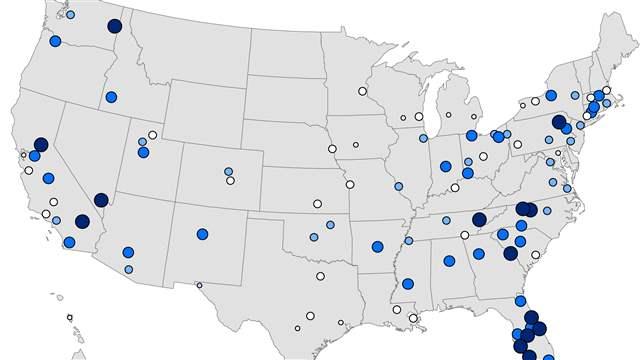
Six years on, 65 metropolitan labor markets still posted lower employment ratios in 2013 for prime-age workers than before the Great Recession began (Figure 2). The steepest employment ratio declines, of 5 percent or more, occurred in mid-Florida metro areas and Sacramento, CA, all of which continued to suffer from the late-2000s housing crash. Las Vegas and Riverside exhibited similarly large declines. The other 35 metro areas managed to recover their pre-recession ratios. Metro areas in Texas, the upper Midwest, and the San Francisco Bay Area, among others, were part of this group.
Two Michigan metro areas posted the strongest employment ratio rebounds from 2010 to 2013.
After suffering above-average declines in employment due to the collapse of the auto industry, and manufacturing more generally, during the recession, Detroit and Grand Rapids posted the two largest increases in their prime-age employment ratios among the 100 major metro areas from 2010 to 2013 (Figure 2). They ended the period roughly where they started in 2007, thanks in part to the comeback of manufacturing in Michigan. Dayton and Louisville, two other metro areas with a significant manufacturing presence, also figured among those with the strongest employment ratio gains during that period. So did technology centers including Portland, OR, San Jose, San Francisco, and Austin, fueled by overall growth in that sector.
Figure 2. Change in Prime-Age Employment Ratio, 100 Largest Metro Areas, 2007 to 2013
Source: Brookings Institution analysis of American Community Survey data
Other metro areas made no real progress from 2010 to 2013, remaining largely stuck where they were in 2010. This was the case even in some places that suffered steep employment drops from 2007 to 2010, such as Deltona, FL, Greensboro, Las Vegas, and Scranton. Two metro areas that posted milder employment declines in the earlier period, Knoxville and Spokane, continued to backslide from 2010 to 2013.
Prime-age employment ratios varied widely across metro areas in 2013, from a low of 62 percent to a high of 81 percent.
Unemployment and labor force participation rates, which are typically calculated for the population age 16 and over, tend to vary across metro areas based in part on their age structure. Metro areas with many younger people who are still in school, or many older people who have exited the labor market, may exhibit higher unemployment or lower labor force participation. Yet even when one examines employment ratios for the same prime working-age population across metro areas, significant differences emerge.
In 2013, 19 percentage points separated employment ratios in the lowest-ranking metro area (Bakersfield, CA at 62.3 percent) and highest-ranking metro area (Madison, WI at 81.3 percent). Metro areas with relatively high ratios tended to have highly educated populations, like Madison, Washington, D.C., Raleigh, and Boston; and/or to have predominantly white populations, like Des Moines, Omaha, Salt Lake City, and Kansas City. Those with the lowest employment ratios included many agricultural regions in California and Florida, several of which experienced high unemployment fueled by the housing market crash (see below).
Most metro areas that had either very high or very low employment ratios in 2013 were in similar positions in 2007, suggesting that structural as well as cyclical factors influence metro employment outcomes. Nine of the 10 metro areas with the highest employment ratios in 2013 also ranked in the top 10 in 2007 (Boston moved from number 12 to number 7). Likewise, six of the bottom 10 metro areas in 2013 ranked as low in 2007.
Metro areas with steeper house price declines also experienced steeper employment ratio declines from 2007 to 2013.
The after-effects of the house price crash on metropolitan areas are apparent in their employment ratio trends. By the fourth quarter of 2013, according to data from the Federal Housing Finance Administration, house price indices in the 100 largest metro areas ranged from 4 percent above (Austin) to 48 percent below (Las Vegas) their levels from six years earlier. Not coincidentally, Austin had recovered its pre-recession employment ratio by 2013, while Las Vegas’ remained 4.3 percentage points short of its 2007 level.
Figure 3. Change in Employment Ratio by Change in House Price Index,
100 Largest Metro Areas, 2007-2013
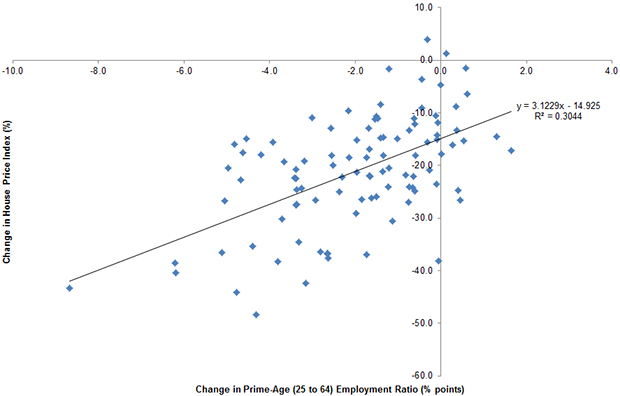
Source: Brookings analysis of American Community Survey and Federal Housing Finance Administration data
There is a strong relationship between house price and employment ratio trends across the 100 largest metro areas (Figure 3). The 25 metro areas that experienced the smallest drops or actual increases in their house price indices from 2007 to 2013 registered an average employment ratio decline of only 0.7 percentage points during that period. By contrast, in the 25 metro areas where house price indices fell the most (by at least 26 percent) the employment ratio declined by an average of 3.4 percent. Thus, the pace of house price recovery in metro areas and the trajectory of their employment opportunity seemed to go hand in hand.
* * *
This snapshot of data from 2013 confirms that many places are still falling short of the employment opportunity they provided America’s workers before the Great Recession. And even among those places that have recovered, several engage well below-average shares of their adults in work today. These trends serve as reminders that five years into the recovery, much work remains to be done in metro America to achieve higher levels of employment and ensure the benefits of economic growth for all.
The author thanks Charlie Rafkin and Natalie Holmes for research assistance.