Amidst the growing global consensus around a target of “zero” extreme poverty for 2030, there is renewed debate around the role of official development assistance (ODA) and how much will be required to achieve the goal. The ideal way to assess this question would be through country-specific, bottom-up costing assessments that account for general equilibrium price dynamics and allow for the possibility of shocks, whether positive (e.g., technology) or negative (e.g., conflict or fuel price spikes). In the absence of such rigorous scenario-based analysis, some back-of-the-envelope calculations help inform the approximate orders of magnitude of aid required.
Two conceptually distinct approaches can help inform deliberations on the issue:
- The first is to estimate the cost of essential services for extremely poor people and the amount of public expenditure required to finance them.
- The second is to estimate the dollar value of the extreme poverty gap, i.e., the amount of transfers theoretically required to bring each person in the world up to a living standard of $1.25 a day.
1.
Essential Services Budget Gap
A budget gap for basic services can be estimated through some simple arithmetic. Assume the following:
(1) A full package of basic public services for health, education, infrastructure, agriculture and public administration costs $200 per capita per year, including roughly $100-140 for Millennium Development Goal-type public investments (in line with the bottom-up estimates of the U.N. Millennium Project, 2005).
(2) A low-income country with strong tax collection systems is able to mobilize 15 percent of gross domestic product (GDP) towards domestic government expenditures.
(3) The difference between each country’s per capita public expenditure requirements and national tax collection is covered by ODA. Thus, countries graduate from the need for basic service ODA when GDP per capita reaches $1,333 (=200/.15).
(4) All developing countries continue their 2005-2011 real per capita growth rates straight through to 2030.
(5) All developing countries are considered to have equal per capita merit in receiving ODA.
(6) Service delivery costs in fragile state contexts are the same as in other contexts.
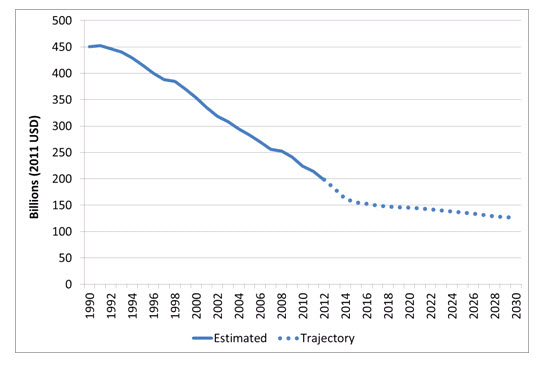
Under this calculation, the basic service budget gap in 2012 works out to approximately $200 billion globally (in constant 2011 USD), roughly similar to today’s total aid flows from all sources, even if much less than all of today’s ODA is targeted to ensuring basic services for those living in extreme poverty.
Figure 1 shows the long-term trends in implied needs since 1990, alongside a calculation of current trajectories through to 2030. The estimated total need has dropped dramatically over the past two decades, declining nearly 40 percent over the past 10 years alone. However, the rate of decline is on course to slow down in the years after 2015, since a significant number of the poorest countries face a long road to crossing the $1,333 per capita income threshold. By 2030 the aggregate need figure is estimated to be roughly $125 billion (again, in constant 2011 USD).
Figure 1: Rough estimation of ODA amounts required to meet basic services for extreme poor
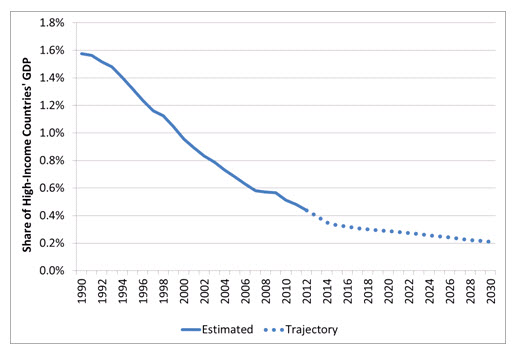
These expenditure calculations can also be estimated as a share of high-income countries’ national incomes, as shown in Figure 2. If we assume that ODA is provided by all countries classified today as high-income (i.e., not just OECD countries), the implied ODA flows are equivalent to around 0.44 percent of donor income in 2012. Notably, the rate of decline since 1990 is even faster in Figure 2 than in Figure 1, since the denominator (donor incomes) grew significantly while the numerator (ODA for basic services) rapidly declined. In the early 1990s the implied ODA requirement was more than 1.5 percent of rich country GDP. By 2005 the ratio fell below the politically salient 0.7 percent threshold for the first time.
Looking forward, one can assume that the high-income countries experience real aggregate growth of 1.5 percent per year through to 2030. Even though the numerator in the ODA/GDP ratio is on a trajectory to decline more gradually post-2015, long-term growth in the denominator means that the ratio drops to approximately 0.2 percent in 2030.
Figure 2: Rough estimate of ODA gap for basic services as share of high-income countries’ GDP
2.
Dollar Value of Extreme Poverty Gap
A different conceptual approach to thinking about aid requirements for extreme poverty is informed by considering the total dollar value of the extreme poverty gap. Laurence Chandy and colleagues have recently presented scenarios for $1.25 a day extreme poverty reduction through to 2030. Under their baseline trajectory, the dollar value of the total gap in 2012 is equal to $62 billion. In other words, direct transfers of $62 billion would be enough to bring everyone in the world up to the $1.25 a day living standard.[1] Note that this includes people living in extreme poverty across all developing countries, including middle-income countries. The corresponding extreme poverty gap for 2005 was much higher, on the order of $100 billion. (Earlier equivalent figures are not available at the time of writing this blog, but we hope to update those soon.) The gap is on course to decline to $26 billion by 2030.
It is important to stress that, conceptually, the implied direct transfers underpinning a poverty gap calculation would represent only one component of “solving the poverty problem,” since they do not provide public services such as health clinics or roads, and they would have an ambiguous links to economic growth, which forms the most robust path out of poverty. Moreover, in practice there would need to be some form of means testing and transfers would likely need to be given in lumpy amounts. For example, it is unlikely that a program would succeed by giving only 2 cents per day to someone estimated to be living at $1.23 per day and 9 cents per day to another person estimated to be living at $1.16 per day.
Nonetheless, recent evidence outlining the potential benefits of unconditional cash transfers (UCTs) draws new attention to the possibilities and prompts policymakers to think more precisely about the strengths and limitations of social protection through direct income support. The advent of mobile money systems has also helped decrease transaction costs of administration, such as through the work of the nonprofit organization GiveDirectly.
There are no clear guidelines to inform estimates of UCT transactions costs, but one might assume that they are on the order of 50 percent of every dollar given. By 2030 these might come down to 20 percent. Figures 3 and 4 assume a linear rate of decline in these transactions costs and add them to Chandy and colleagues’ extreme poverty gap figures. The graphs show how the practical cost of UCTs would drop from slightly more than $90 billion in 2012 to roughly $30 billion in 2030. This works out to 0.21 percent of high-income country income in 2012, declining to 0.05 percent by 2030.
Figure 3: Estimated trajectory of global extreme poverty gap to 2030
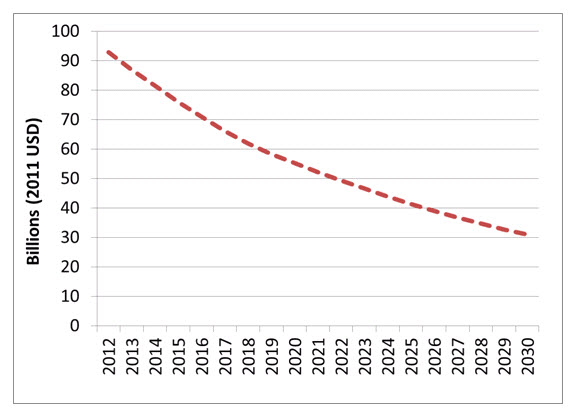
(includes declining transaction costs)
Figure 4: Extreme poverty gap trajectory as share of high-income countries’ income
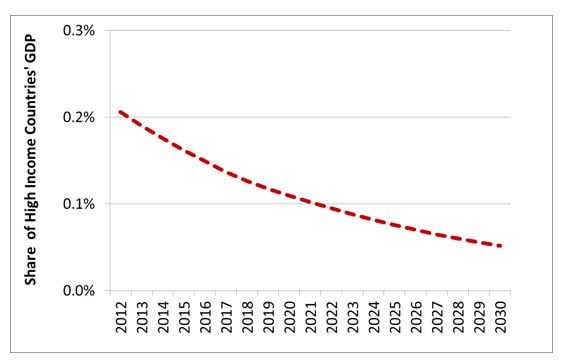
(includes declining transaction costs)
3.
Implications
To stress, these rough calculations are only intended to highlight structural trends. They do not pretend to offer precise point estimates or to map out the entire range of ODA needs. Nonetheless, the calculations do offer a few key implications:
(1) ODA is still essential through to 2030, even if it targeted only to the narrowest problems of extreme poverty. The end of extreme poverty should not be confused with the end of aid.
(2) If countries continue on current trajectories of progress, and relevant aid flows are adequately targeted, significantly less ODA will be required to meet basic needs by 2030 compared to today.
(3) Given the large and growing share of extreme poverty located in fragile states, a more careful estimation and segmentation is needed for relevant service delivery costs.
The above estimates focus only on problems linked to extreme poverty and basic needs. It remains to be decided the extent to which the global community will focus aid towards tackling higher standards of poverty, inclusion, and service delivery, including those linked to $2 a day or national poverty lines. Nor do the calculations include the costs of other key aid priorities, including global public goods like disease control, public safety, oceans management, biodiversity protection, research for agriculture and health, climate change mitigation and adaptation, and other activities for which significant public international investment will also be required. These important priorities could easily guide the focus of a next generation of “0.7” ODA commitments.
[1] This implies that someone living at $0.50 per day receives $0.75 per day and someone living at $1.24 per day receives $0.01 per day.
Commentary
Op-edHow Much Aid for Basic Needs to 2030? Some Very Coarse Numbers
February 6, 2014