There is no single definition of economic development and there is no one recipe for achieving socioeconomic well-being. However, it is possible to analyze an emerging market’s relative progress toward graduating into the developed world or advanced economy status. The Brookings Graduation Scorecard ranks emerging markets based on four core areas: economic growth, financial resilience, policy track record and broad development factors (all equally weighted). Each of these four core areas is explained below.
• Growth performance over 1999-2010: Risk adjusted GDP growth (average growth over standard deviation) and GDP crisis stress test (deviation of 2009 growth from average pre-crisis, 1999-2007, growth).
• Financial resilience: Public external debt-to-GDP, net external debt-to-GDP, net external financing needs over current account receipts, sovereign bond interest rate spread.
• Policy track record: Risk-adjusted inflation (average CPI inflation plus standard deviation over 1999-2010), five-year moving average of the cyclically adjusted primary fiscal balance.
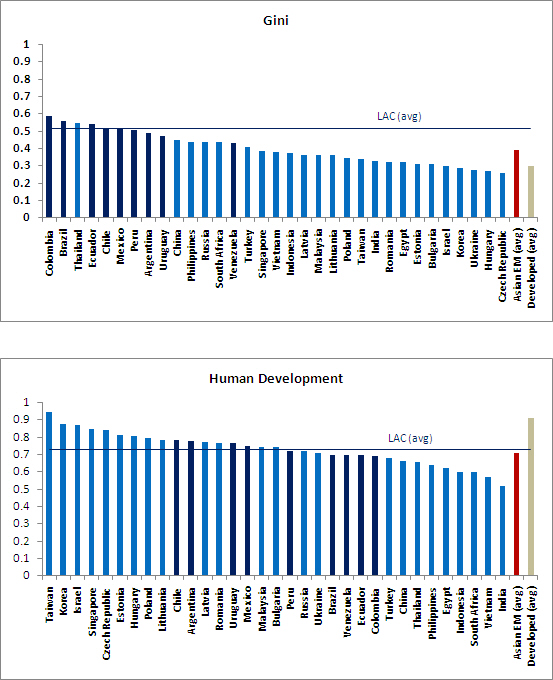
• Development: Gini coefficient, United Nations Human Development Index, World Governance Indicators (WGI). [1]
For each one of these variables we calculate the z-score, using the average and standard deviation across countries, which we then convert to a 0 to 1 scale. The rescaled z-scores are then averaged across each of the four core areas, resulting in the overall score. This approach allows us to rank countries in the Brookings Graduation Scorecard by variable, by core area, and by overall performance.
The objective of the graduation scorecard ranking is twofold: (1) capture gradual advancements or downfalls in paths of emerging economies toward graduation into the developed world; (2) analyze cross-sectional differences in key economic development indicators within the emerging markets group. This allows us to analyze groupings of emerging market economies.
Anachronistic Acronyms
Based on our graduation scorecard (see Figure 1), we believe that the practice of grouping emerging markets into acronyms by economists and financial experts in order to identify the next group of top performers has become outdated and problematic. From the popular BRICs classification to CIVETS (Colombia, Indonesia, Vietnam, Egypt, Turkey and South Africa), MAVINS (Mexico, Australia, Vietnam, Indonesia, Nigeria, South Africa) and EAGLES (Emerging and Growth-Leading Economies ─ the BRICs plus Korea, Indonesia, Mexico, Turkey, Egypt and Taiwan) all of these artificial groupings and acronyms have sought to single out a set of countries, which supposedly outperform the rest.
The BRICs are the largest emerging market economies, but the similarities stop there. Whereas China is in a class by itself, India is a fast growing deficit country, Brazil shares Latin America’s limits for noninflationary growth, and Russia is mainly an oil-exporting country. Looking at the graduation scorecard, we see that as a group the BRICs are well positioned in their pursuit of development relative to other emerging markets. However, each BRIC country on its own ranks quite differently in comparison to its BRIC counterparts in the graduation scorecard.
The grouping of EAGLES and CIVETS are also of questionable relevance. The former, launched by the economic research team at BBVA, added Egypt, Indonesia, Mexico, South Korea, Taiwan and Turkey to the BRICs, based on the countries that were expected to contribute most to the global growth. This classification captures large, fast-growing emerging markets, regardless of any other development quality or policy stance. HSBC’s CIVETS – Colombia, Indonesia, Vietnam, Egypt, Turkey and South Africa – were grouped together because they all have large young populations, diversified economies, political stability (the recent events in Egypt simply reminding us that perhaps this aspect was overstated), deep financial markets, low inflation, solid trade balances and limited sovereign debt ratios. Judging by Egypt’s political risk, Turkey’s currency imbalance and growing current account deficit, Vietnam’s incipient financial markets and fat fiscal deficit, not to mention South Africa’s commodity dependence or Colombia’s modest growth performance, one wonders how these countries were classified together as up-and-coming star emerging markets.
Development is not one-dimensional and is by definition an evolutionary process. Proposing classifications of emerging markets is problematic because they are outdated very quickly and do not reflect the diversity and differences within the group. It is with this in mind that the Brookings Graduation Scorecard tries to capture, imperfectly, the complexities and nuances of moving from emerging to advanced economy status. Most importantly, the scorecard presents this graduation process as a dynamic one.
Latin America’s Mixed Results
There are two salient groups in the case of Latin American countries. The star performing group includes Chile at the top (third in the overall ranking) followed by Brazil and Uruguay (which has visibly improved its standing relative to last year’s assessment, mainly due to modest gains distributed across the four areas). Peru barely makes the cut of the star performing group (Figure 1). This group of star performers is close to graduating to advanced economy status.
These four Latin American countries are also regional leaders in at least one of the four core areas of the graduation scorecard (Figure 2). While these four countries have different strengths and weaknesses, they all have a strong policy track record.
Compared to other emerging markets, Latin American economies have benefited the most from improving their policy track records, which is perhaps a lesson from the recurrent macroeconomic crisis experienced by the region in previous decades. Chile leads the Latin American region in having the most solid policy track record, followed by Brazil and Peru. Chile also leads the region in the development factors’ ranking.
At the other end of the spectrum are Venezuela and Ecuador, which can be classified as stagnating countries. These two countries are held down in the rankings by high inflation, persistently large deficits, unstable growth and non-desirable development factors. Overall, the worst ranked countries in the graduation scorecard are Ukraine, Ecuador and Venezuela, in that order (Figure 1). It will take time and a combination of right macroeconomic and social policies along with strong economic growth for Venezuela and Ecuador to start ascending in the graduation scorecard rankings. Given the idiosyncratic nature of their governments, this is not likely to occur any time soon.
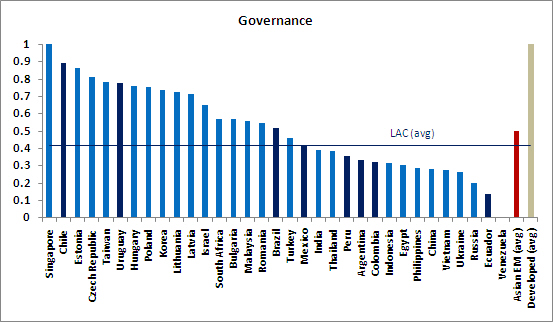
One common aspect about the scorecard for Latin American countries is the relatively weak performance on the growth front, at least when compared with East Asian emerging markets (Figure 2). The other noticeable feature is the heterogeneous results when it comes to the measures of development factors (Gini coefficient, HDI, and WGI), which has a 25 percent weight in the overall score. The large disparity on the development factors scorecard is almost exclusively due to differences in the WGI (Figure 3). In turn, the WGI can be further disaggregated into each one of its six components in order to understand the specific governance dimensions that explain differences across countries in Latin America. It is in the analysis of these six components, on a country by country basis, that a clear and relevant differentiation within Latin America emerges. Ultimately, it is progress in this area what makes Chile, Uruguay and Brazil to be the most likely candidates to achieve development during this decade.
FIGURE 1. GRADUATION SCORECARD
FIGURE 2. REGIONAL SCORES IN GRADUATION CRITERIA
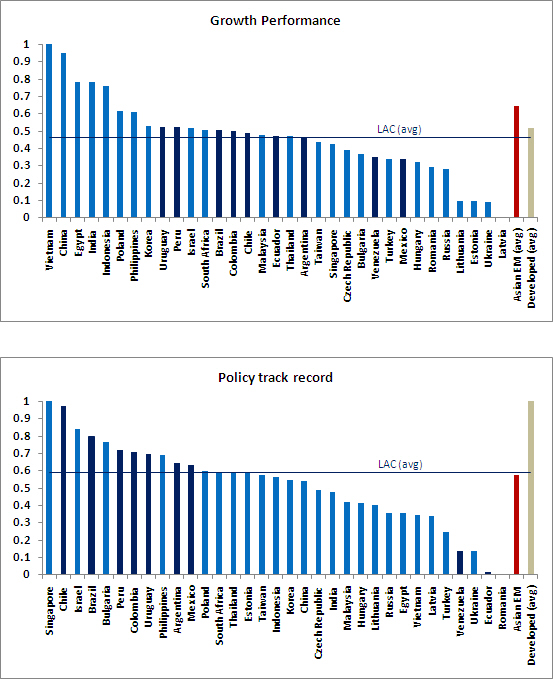
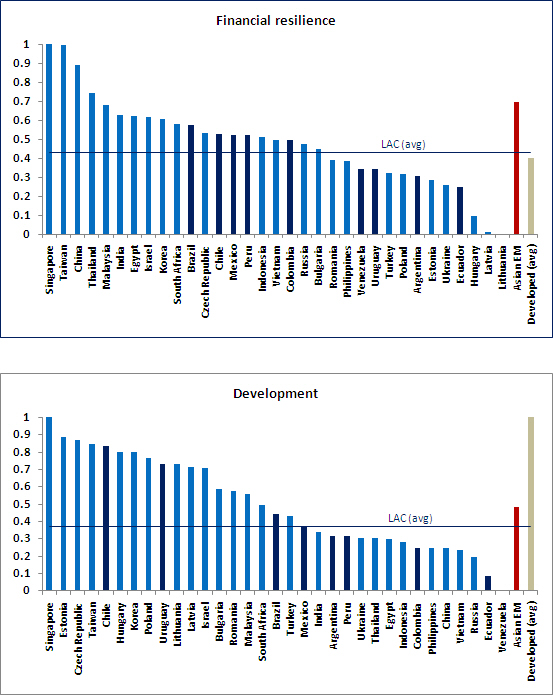
FIGURE 3. DEVELOPMENT FACTORS DISAGGREGATED
Footnote:
[1] An average of six governance measures: voice and accountability, political stability, government effectiveness, regulatory quality, rule of law, and control of corruption (see http://info.worldbank.org/governance/wgi/index.asp).


Commentary
Op-edGraduation Season: Moving Toward Advanced Economy Status
June 1, 2011