
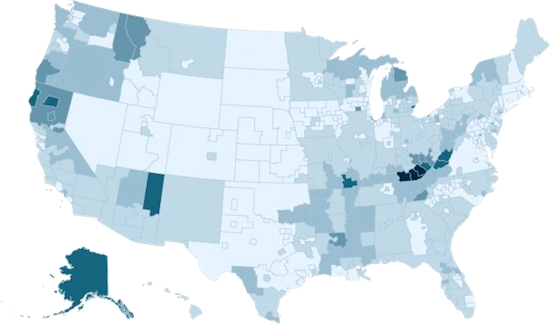
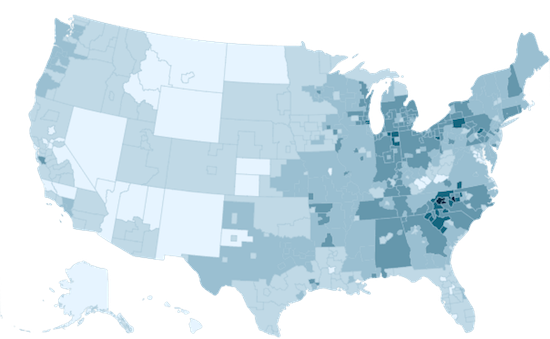
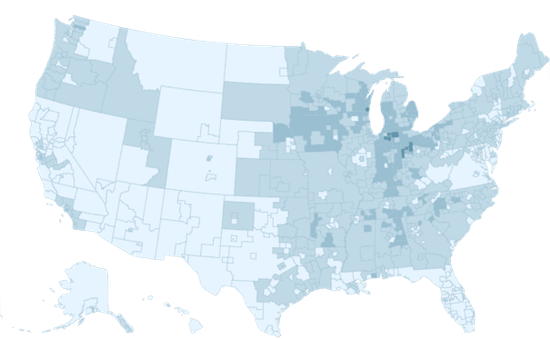
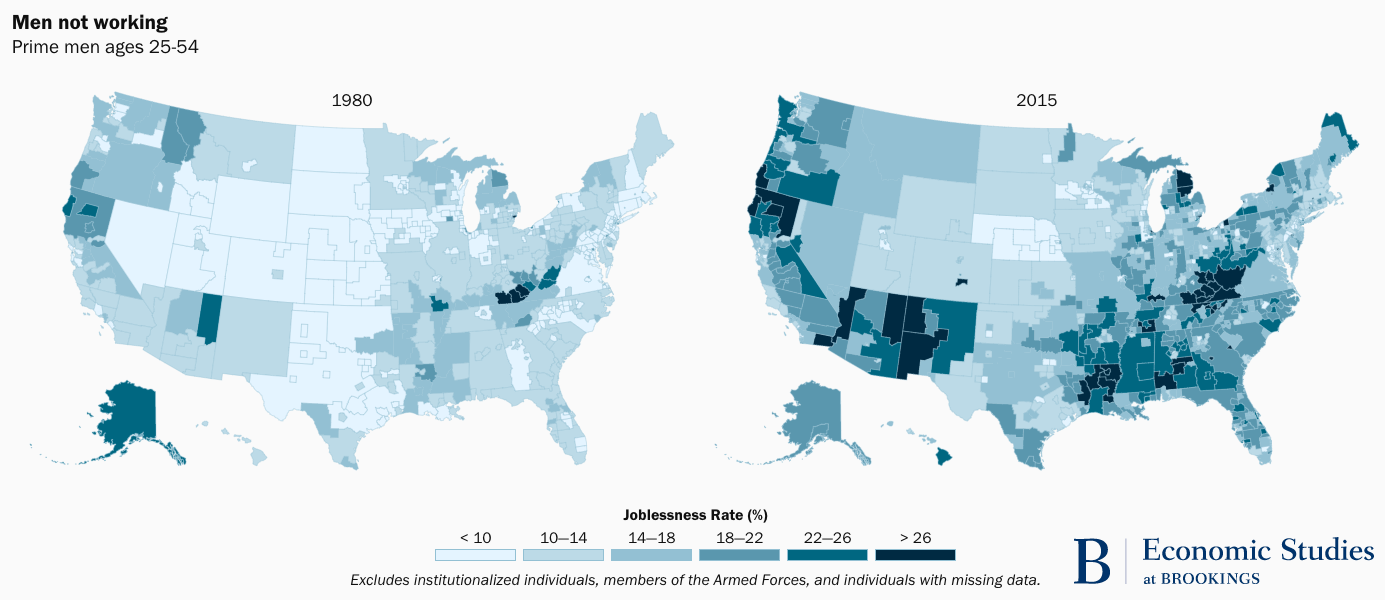
New research by Harvard’s Benjamin Austin, Edward Glaeser, and Lawrence Summers published in the Spring 2018 edition of Brookings Papers on Economic Activity (BPEA) maps growth in the share of men who are not working across major regions of the United States,* revealing that the share of men aged 25-54 without work has nearly tripled over the last 50 years, and that this rise is disproportionately centered in the eastern parts of the American Heartland from Mississippi to Michigan.
In decades past, Americans were much more likely to move across counties and states in search of work. Between 1950 and 1992, mobility across counties never dropped below six percent. Since 2007, the share of American residents who moved across counties has never exceeded 3.9 percent. As a result, incomes in poorer parts of the country are no longer catching up with those in wealthier parties of the country as quickly as they used to, and regional gaps in employment have become large and enduring.
At the same time there has been a wide variation in economic growth in different regions of the country. While coastal states have seen their real economies grow by 330 percent over the past 40 years and the Western Heartland has seen growth of 461 percent, the Eastern Heartland’s economy has grown by only 181 percent.
At the same time there has been a wide variation in economic growth in different regions of the country. While coastal states have seen their real economies grow by 330 percent over the past 40 years and the Western Heartland has seen growth of 461 percent, the Eastern Heartland’s economy has grown by only 181 percent.
A look at men without jobs across the country illustrates large differences in the rise of American non-employment across regions and the hardening of America’s geographic divisions. In 2016, 51 percent of 25- to 54-year-old men in Flint, Michigan were not employed. In Alexandria, Virginia, it was 5 percent.
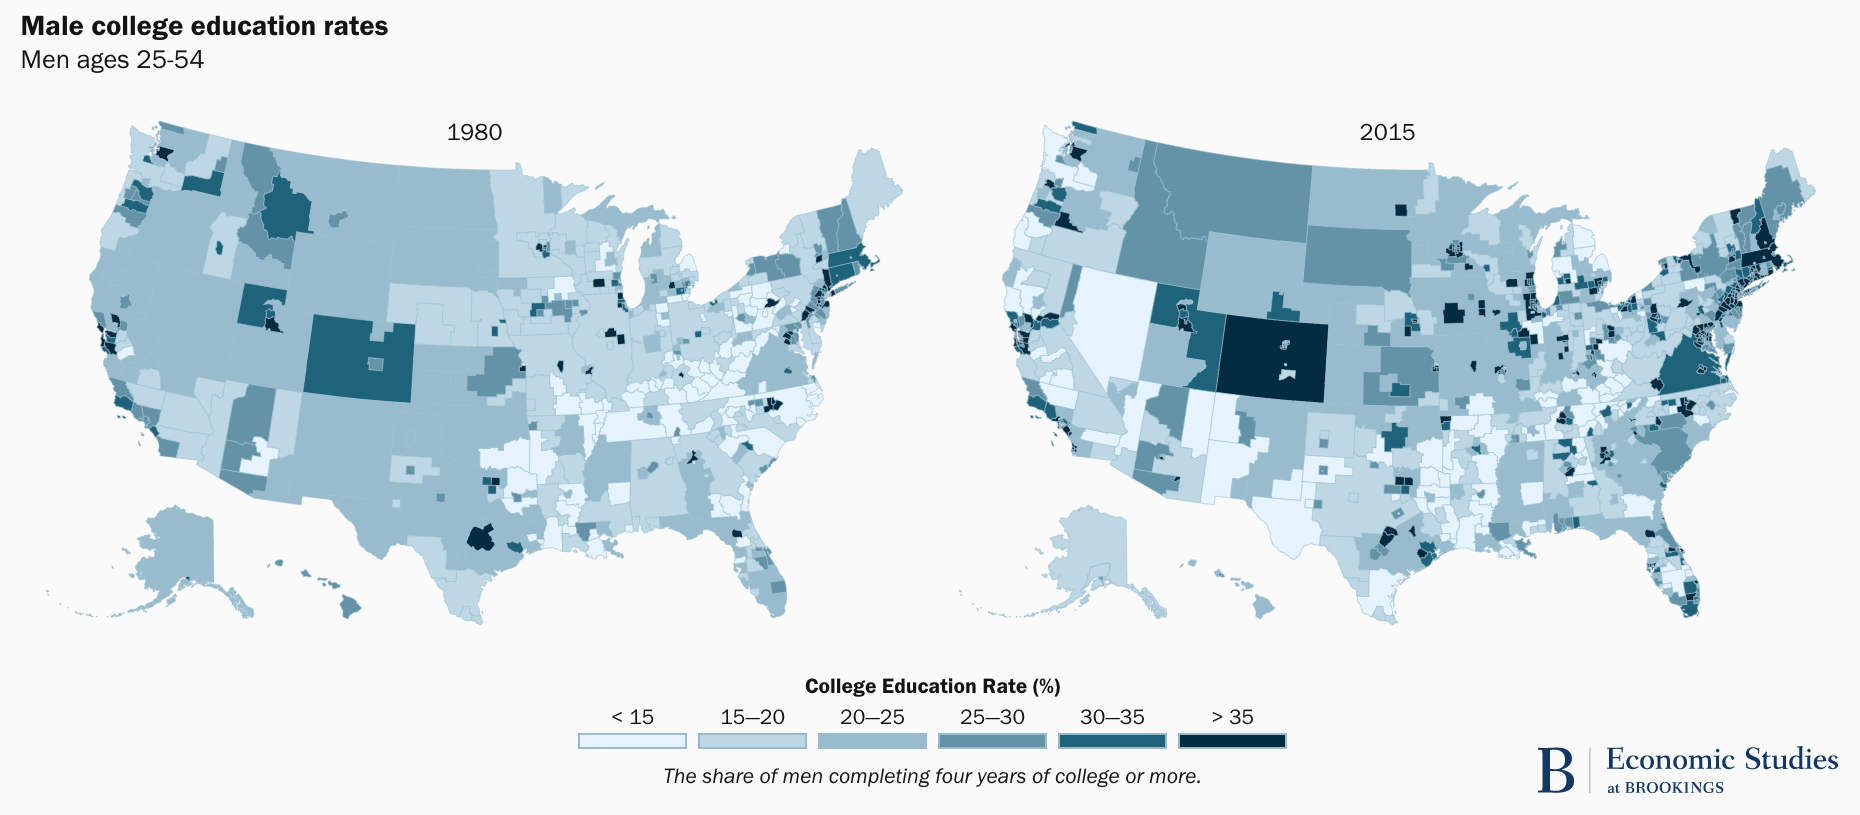
As has been widely documented, education plays a major role in hardening the divide between more educated workers that benefit from the modern economy and their less-educated peers.
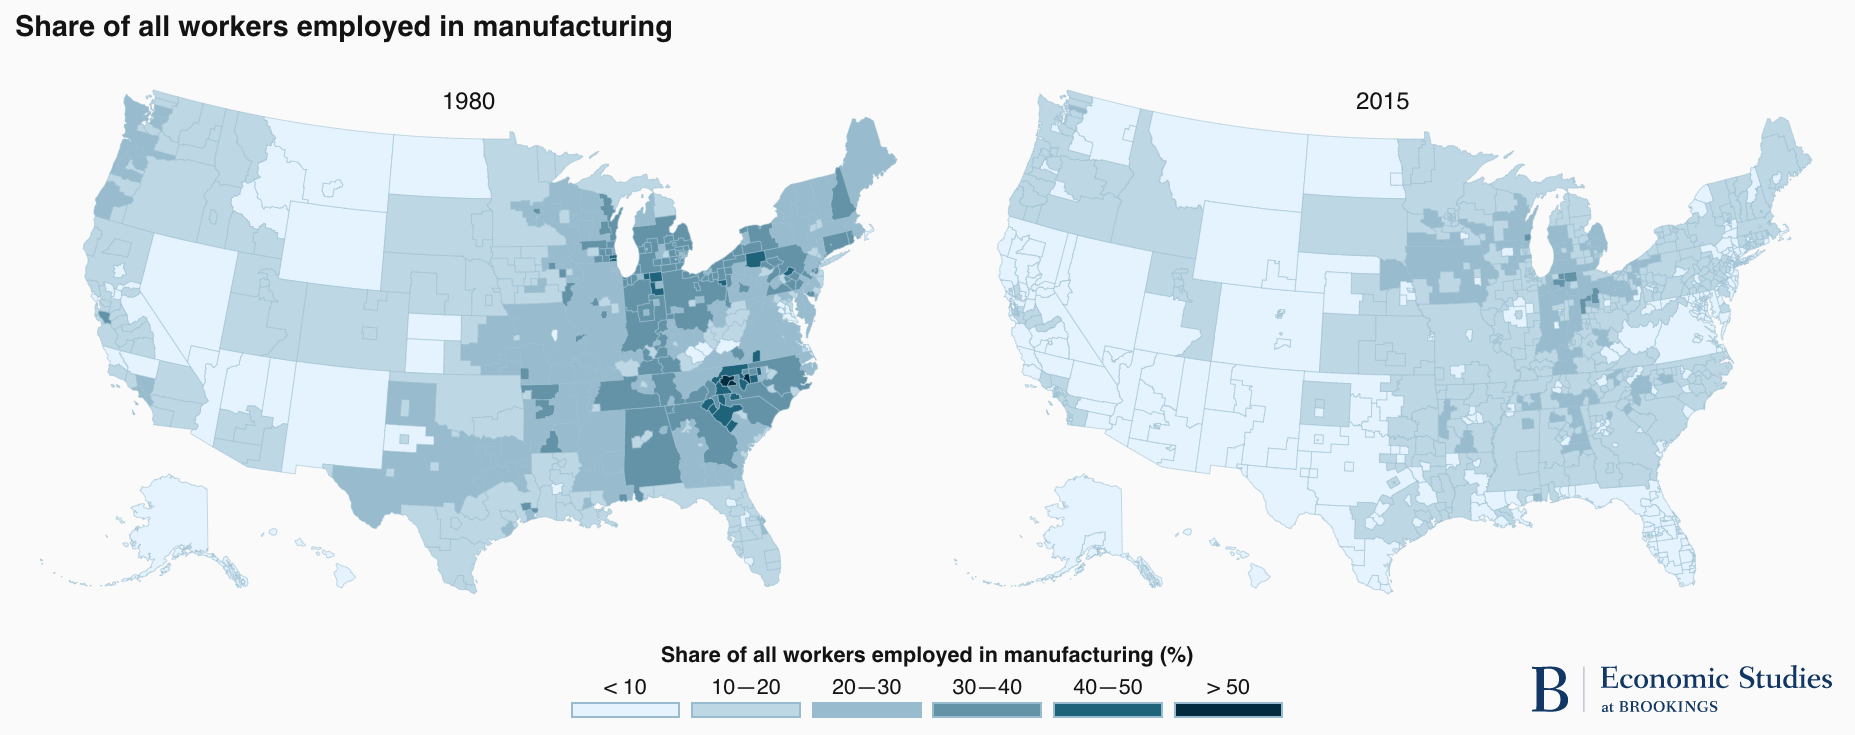
A decline in manufacturing jobs has also hardened the geographic divides, with parts of the country that historically produced durable goods like cars and household appliances (the Eastern Heartland) seeing a bigger rise in non-employment than regions with a history in nondurable manufacturing (the Western Heartland and the Southeast).
All of this has led us to a point where between 2010 and 2015, more than 10 percent of men ages 25-54 had not worked in the past year. Fifteen percent of those men lived on their own and had an average income of $12,420 with approximately 80 percent of their income coming from government support. The other 85 percent lived with others and had an average personal income of $8,219. Men without work reported spending a little less than an hour a day caring for others—about the same as employed men—but over 5 hours a day playing computer games or watching TV. Employed men report roughly 2.5 hours a day playing computer games or watching TV.
In terms of well-being, men without work are suffering to such an alarming degree that the authors argue the enormous social costs of non-employment suggest fighting long-term non-employment is more important than fighting inequality. Non-employment is a strong predictor of unhappiness, suicide, divorce and opioid use in men aged 25 to 54.
At the same time there has been a wide variation in economic growth in different regions of the country. While coastal states have seen their real economies grow by 330 percent over the past 40 years and the Western Heartland has seen growth of 461 percent, the Eastern Heartland’s economy has grown by only 181 percent.
A look at men without jobs across the country illustrates large differences in the rise of American non-employment across regions and the hardening of America’s geographic divisions. In 2016, 51 percent of 25- to 54-year-old men in Flint, Michigan were not employed. In Alexandria, Virginia, it was 5 percent.
As has been widely documented, education plays a major role in hardening the divide between more educated workers that benefit from the modern economy and their less-educated peers.
A decline in manufacturing jobs has also hardened the geographic divides, with parts of the country that historically produced durable goods like cars and household appliances (the Eastern Heartland) seeing a bigger rise in non-employment than regions with a history in nondurable manufacturing (the Western Heartland and the Southeast).
All of this has led us to a point where between 2010 and 2015, more than 10 percent of men ages 25-54 had not worked in the past year. Fifteen percent of those men lived on their own and had an average income of $12,420 with approximately 80 percent of their income coming from government support. The other 85 percent lived with others and had an average personal income of $8,219. Men without work reported spending a little less than an hour a day caring for others—about the same as employed men—but over 5 hours a day playing computer games or watching TV. Employed men report roughly 2.5 hours a day playing computer games or watching TV.
In terms of well-being, men without work are suffering to such an alarming degree that the authors argue the enormous social costs of non-employment suggest fighting long-term non-employment is more important than fighting inequality. Non-employment is a strong predictor of unhappiness, suicide, divorce and opioid use in men aged 25 to 54.
What policies are best suited to fighting regional disparities in employment? The authors document evidence that suggest increases in labor demand appear to have greater impacts on employment in areas where non-employment has been historically high. The authors argue that pro-employment policies, such as a ramped up Earned Income Tax Credit, that are targeted towards regions with more responsive labor markets, however financed, could plausibly reduce suffering and materially improve economic performance.
* The authors divide the U.S. into three regions: The Prosperous Coasts, the Western Heartland and the Eastern Heartland, divided based on year of statehood.


