
The Black Progress Index:
In 1899, W.E.B. Du Bois published “The Philadelphia Negro,” a first-of-its-kind sociological case study of a Black community, combining urban ethnography, social history, and descriptive statistics. Its novel use of data to identify racial inequity undoubtedly influenced Du Bois’ vision for the NAACP, which he would go on to help found, as an organization that uses empirical evidence and facts in its efforts to dismantle injustice.
In the spirit of Du Bois and others who have pursued truth and justice, the NAACP and the Brookings Institution have partnered to develop tools and resources that will empower communities with data and information. The partnership’s primary project is the Black Progress Index, which provides a means to understand the health and well-being of Black people and the conditions that shape their lives.
The Black Progress Index will evolve over the course of the partnership, but its first step is to find the places where Black people are thriving most, as measured through the social predictors of life expectancy at birth. In other words, the Black Progress Index identifies and measures the social conditions that predict long and healthy lives for Black Americans.
We chose to focus on the social conditions that predict life expectancy because they are a cumulative measure of health and well-being, summarizing many biological and non-biological influences on our lives. People tend to live longer in places where they evaluate their lives positively and enjoy excellent physical and mental health. Unlike other summary measures of well-being and health, life expectancy can be readily analyzed using the same data and methods across most U.S. counties and metropolitan areas.
We highlight the areas where Black people have been living the longest because it may provide insight into the local civic actions that have produced those outcomes—actions that other places may take. Each year, we will add additional focal points of well-being, building out a comprehensive examination of the living conditions of Black people.
To emphasize Black health is not to de-emphasize social inequity. The legacy of structural racism pervades the country in the form of lower wealth and socioeconomic status for Black people. In turn, this legacy influences the so-called “social determinants of health,” which we define as patterns of behavior and environmental conditions that have largely social causes, but also biological implications on mental and physical health. Relatively low levels of college completion, low wealth, and high exposure to violent crime are especially relevant examples of these social determinants.
A goal of this research is to identify which social factors are the most important, provide evidence on the size of their effects, and track the places that do better or worse on these factors, as well as the places that over- or under-perform relative to predictions. There may be valuable lessons from the people and organizations in places that have better outcomes than expected.[1]
While we focus on life expectancy, our research is also relevant to quality of life more broadly. Using large sample microdata from Gallup and Sharecare, we found—not surprisingly—that Black people evaluate their lives more positively in places (measured as counties) with higher Black life expectancy. This data was not available at the county level for much of the country, so we focus on life expectancy to provide detailed geographic information. Beyond subjective well-being, we also examined other objective measures of health, including age-adjusted mortality and the share of children born at low birthweight. This analysis confirms that the factors identified in the Index are predictive in explaining these outcomes too.
In addition, the Index can be de-composed into the component parts that were shown to be most impactful on life expectancy: wealth, human and social capital (e.g., education, social networks, religion), environmental quality, safety, and family. Our hope is that understanding how these factors play out across local areas and neighborhoods can help communities take collective action and tailor policy to fit their needs.
The vast gulfs in Black life expectancy across the U.S.
In Manassas Park, Va. and Weld County, Colo., the mean life expectancy for Black residents is 96—a national high. Yet in Jefferson County, Ohio, the average Black person lives 33 fewer years. That gap is roughly equivalent to 100 years of progress in living standards, medical science, and public health.
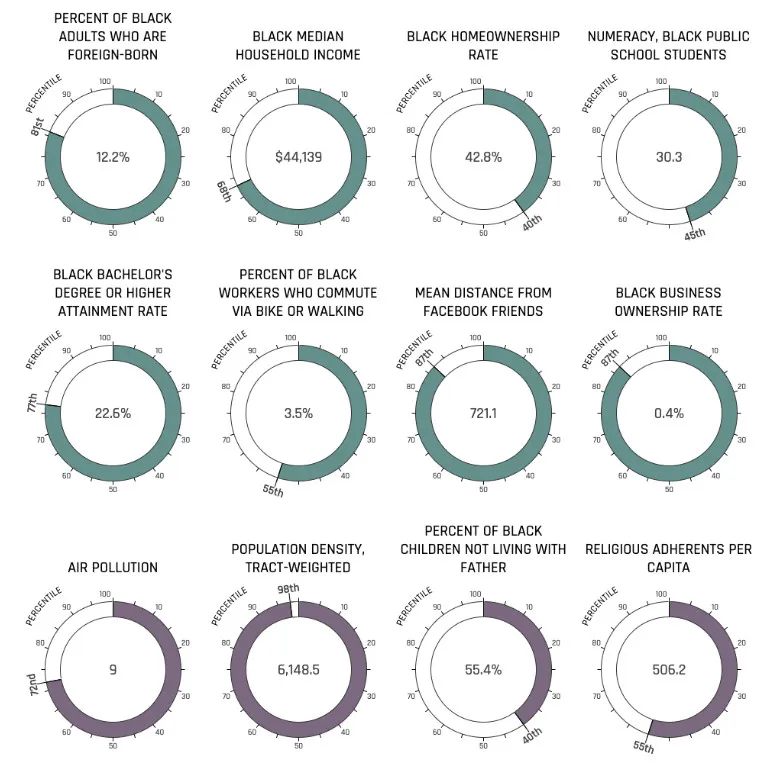
Using 13 variables chosen through a rigorous process of machine-learning and expert judgment, the Black Progress Index can explain over half of the variation in Black life expectancy across counties. The 13 indicators fall into five categories, as follows:
- Wealth, as measured by Black median household income; rate of entrepreneurship; and homeownership.
- Human and social capital, as measured by bachelor’s degree or higher educational attainment; performance on elementary and secondary school exams; geographic diversity of friend networks (measured through the location of Facebook friends)[2]; low levels of religious affiliation; and the share of foreign-born Black residents.
- Environmental quality, as measured by low levels of air pollution and living in moderate or low population density areas.[3]
- Safety, as measured by low levels of gun violence or homicide and high rates of people commuting to work by bicycle or walking.[4]
- Family health, as measured by the share of Black children who live with their father.
The top-performing counties across these 13 indicators include Cumberland County in the Portland, Maine metro area; Loudon, Fairfax, Prince William, and Montgomery counties, all outside of Washington, D.C.; Collier County in the Naples, Fla. metro area; Rockingham County, N.H., outside of Boston, and Snohomish County, Wash., near Seattle. The 20 counties with the highest Black Progress Index scores are reported in Table 1 (see Appendix Table 1 for a corresponding list of metropolitan areas and for the full list of counties as well as their population counts, click here).
In Loudon and Rockingham counties, actual life expectancy almost exactly matches the Index’s predicted life expectancy. For Cumberland County, actual life expectancy is three years shorter than predicted, and in Collier County, it is three years longer. We believe further investigation may uncover useful explanations for why the former under-performs and the latter over-performs.
Table 1. The top 20 U.S. counties with highest Black Progress Index score, actual life expectancy, and life years unexplained by model
| County | State | Metropolitan area | Black Progress Index | Black Life Expectancy at birth | Unexplained year of Black life | Black population, 2020 |
|---|---|---|---|---|---|---|
| Putnam County | New York | New York-Newark-Jersey City, NY-NJ-PA | 83.5 | 85.8 | 2.3 | 3,349 |
| Warrick County | Indiana | Evansville, IN-KY | 83.2 | 1,147 | ||
| Scott County | Minnesota | Minneapolis-St. Paul-Bloomington, MN-WI | 82.9 | 89.7 | 6.8 | 6,286 |
| Cumberland County | Maine | Portland-South Portland, ME | 82.8 | 79.7 | -3.1 | 9,192 |
| Loudoun County | Virginia | Washington-Arlington-Alexandria, DC-VA-MD-WV | 82.7 | 82.4 | -0.3 | 31,241 |
| Collier County | Florida | Naples-Marco Island, FL | 82.6 | 86.0 | 3.4 | 25,613 |
| Rockingham County | New Hampshire | Boston-Cambridge-Newton, MA-NH | 82.2 | 82.2 | 0.0 | 2,704 |
| Fairfax County | Virginia | Washington-Arlington-Alexandria, DC-VA-MD-WV | 82.2 | 83.1 | 0.9 | 112,024 |
| Snohomish County | Washington | Seattle-Tacoma-Bellevue, WA | 82.2 | 83.1 | 1.0 | 26,644 |
| Delaware County | Ohio | Columbus, OH | 82.0 | 79.3 | -2.7 | 7,153 |
| Prince William County | Virginia | Washington-Arlington-Alexandria, DC-VA-MD-WV | 81.8 | 79.3 | -2.5 | 97,848 |
| Washington County | Oregon | Portland-Vancouver-Hillsboro, OR-WA | 81.6 | 82.5 | 1.0 | 12,931 |
| Barnstable County | Massachusetts | Barnstable Town, MA | 81.5 | 76.5 | -4.9 | 6,098 |
| Wright County | Minnesota | Minneapolis-St. Paul-Bloomington, MN-WI | 81.4 | 82.8 | 1.4 | 2,366 |
| Forsyth County | Georgia | Atlanta-Sandy Springs-Alpharetta, GA | 81.4 | 81.4 | 0.0 | 8,574 |
| Saratoga County | New York | Albany-Schenectady-Troy, NY | 81.4 | 81.8 | 0.4 | 3,906 |
| Montgomery County | Maryland | Washington-Arlington-Alexandria, DC-VA-MD-WV | 81.3 | 81.1 | -0.2 | 193,450 |
| Nassau County | New York | New York-Newark-Jersey City, NY-NJ-PA | 81.3 | 79.0 | -2.3 | 157,724 |
| Dallas County | Iowa | Des Moines-West Des Moines, IA | 81.2 | 85.8 | 4.7 | 1,720 |
| Plymouth County | Massachusetts | Boston-Cambridge-Newton, MA-NH | 81.2 | 81.4 | 0.3 | 48,800 |
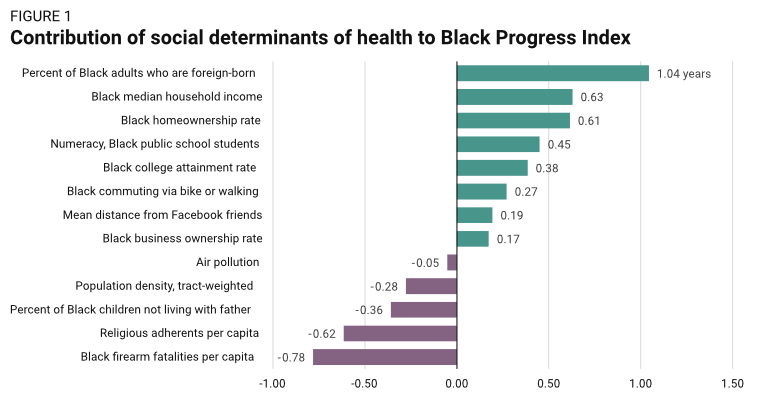
For every county and metropolitan area in our database, we decompose the Black Progress Index into the various contributions of each of the 13 factors in our model and an unexplained (residual) component. To illustrate, consider the largest county: Montgomery County, Md. Ranking each factor by its contribution to the Index shows that the very high share of foreign-born Black adults in the area predicts an additional 3.3 years of life expectancy, making it the largest contributor to the area’s high score. This is because the foreign-born share has a large average effect across counties and is very large locally (three standard deviations above the mean). The county’s low rate of gun violence adds 1.3 years to life expectancy, and its high levels of college education and median household income add an additional year each. The county’s Black students’ test scores are slightly below average, but not low enough to predict a large drop in life expectancy.
Table 2. Contribution of social determinants of health to Black Progress Index in Montgomery County, Md.
| Indicator | Contribution to Black Progress Index | Local value, standardized |
|---|---|---|
| Foreign-born share of Black adults | 3.31 | 3.17 |
| Black firearm fatalities per capita | 1.34 | -1.71 |
| Black college attainment rate | 1.05 | 2.73 |
| Black median household income | 0.99 | 1.57 |
| Percent of Black children not living with father | 0.49 | -1.36 |
| Religious adherents per capita | 0.43 | -0.70 |
| Black business ownership rate | 0.38 | 2.16 |
| Mean distance from Facebook friends | 0.24 | 1.22 |
| Air pollution | 0.00 | 0.10 |
| Black commuting via bike or walking | -0.14 | -0.52 |
| Numeracy, Black public-school students | -0.14 | -0.32 |
| Unexplained life expectancy | -0.20 | -0.08 |
| Black homeownership rate | -0.21 | -0.35 |
| Population density, tract-weighted | -0.34 | 1.22 |
Methodology for county-level analysis
Life expectancy varies considerably across racial groups in the United States. Life expectancy at birth for Black people is 74.8, which is lower than all major race and ethnic groups except American Indian and Alaska Natives (71.8). Non-Hispanic white Americans have a life expectancy of 78.8, while Latino or Hispanic and Asian American life expectancies are 81.9 and 85.6, respectively.[5]
Differences in the causes of death—as listed on death records—shed light on these disparities.[6] Among the leading causes of the life expectancy gap between Black people and other groups, several causes are loosely connected, if at all, to biological health: accidents and unintentional deaths as well as assault and homicide. These can be thought of as largely social in origin. Likewise, even explicitly biological causes of death have social aspects related to health behaviors, prevention, and treatment. These facts motivate our effort to focus on social factors that predict health and longevity for Black Americans.
Our main goal is to predict county-level Black life expectancy at birth, using 2018-2020 data from the University of Wisconsin’s County Health Rankings and Roadmaps program. Life expectancy is a clear and useful measure of longevity, but it is strongly affected by deaths at a young age, which result in more years of lost potential life.
Our analysis preceded in three stages. First, our discovery stage involved downloading and processing hundreds of variables from a variety of data sources, including the U.S. Census Bureau, Internal Revenue Service, the Federal Reserve, Facebook, Redfin, the U.S. Congress Joint Economic Committee’s Social Capital Project, the County Health Rankings and Roadmaps program, and the Centers for Disease Control and Prevention.
In stage two, we ran these variables through a common machine-learning algorithm (Lasso) to select variables and rank variable importance, using life expectancy at birth and age-adjusted mortality as the target outcomes. This process eliminates much of the subjective bias associated with model selection and allows for unexpected variables to rise to the top (such as the share of the Black population that was foreign-born). The downside of this approach is that a naïve Lasso model is atheoretical and can lead to suboptimal combination of variables in the presence of multicollinearity. In other words, two variables that closely measure the same construct—or are highly correlated because they share an underlying causal pathway—may cancel each other out if included in the same model, or one or both may appear insignificant if included alongside a variable that is highly correlated with it. This can be true even if they have important causal effects on the outcome.
In stage three, we categorized the variables Lasso selected into distinct constructs. Then, we re-ran models with a smaller range of possible variables to reflect the best candidates within each family of constructs. For example, we didn’t need three measures of family structure (the percentage of tax filers who are single, the percentage of Black children who do not live with their father, and the share of Black loans going to single borrowers), so we selected the best-performing measure of this group. Performance was judged based on county data coverage and related data quality issues, the absolute value of the t-statistic, and how the inclusion of the variable affects other variables that might be highly correlated with it.
Our final list of variables comes very close to maximizing adjusted R-squared, while preserving constructs that were consistently important in various iterations of the model. In the end, this is a subjective process that involved expert judgment, but was informed by machine learning. In future work, we will refine this list. Many constructs were tested and ultimately rejected in the final model because they did not add explanatory power in the presence of other variables chosen. These included racial segregation, access to health care, the percentage of residents with insurance, measures of household debt, median length of commuting times, access to green space, walkability, and access to grocery stores. This result does not mean that these and other rejected constructs do not have direct or indirect effects on health or Black life expectancy. We suspect that they were rejected because of their high correlation with more predictive variables, often closely related.
This process led to 13 variables, summarized below. The categories they fall into are environmental quality, family health, human and social capital, safety, and wealth.
Table 3. List of variables included in the final Index
| Category | Measure |
|---|---|
| Environmental quality | Population density, tract-weighted |
| Environmental quality | Air pollution |
| Family health | Percent of Black children not living with father |
| Human and social capital | Percent of Black adults who are foreign-born |
| Human and social capital | Religious membership per capita |
| Human and social capital | Numeracy, Black public-school students |
| Human and social capital | Black college attainment rate |
| Human and social capital | Friendship diversity (i.e., mean distance from Facebook friends) |
| Safety | Black firearm fatalities per capita |
| Safety | Black commuting via bike or walking |
| Wealth | Black homeownership rate |
| Wealth | Black median household income |
| Wealth | Black business ownership rate |
The last step of our analysis was to use the selected variables to predict Black life expectancy at the county level using linear regression. Each variable is significant in the direction predicted by theory, and together, they explain 55% of the variation in Black life expectancy.
Thus, the Black Progress Index predicts Black life expectancy based on 13 underlying factors. In calculating the mean for a given geography, the factors are weighted according to the model by how well they predict Black life expectancy. The residual from this model is then used to calculate unexpected years of life—positive for areas that over-perform relative to the Index, negative for those that under-perform, and approximately zero for areas that perform as predicted. This residual can be thought of as quantifying something unmeasured by the Index, which will be subject to future research.
To assess the robustness of our model, we varied the outcomes and sample and found it performed well in different samples and using different outcomes.
Specifically, we segmented the sample of counties into 423 rural counties (defined as non-metropolitan) and 814 metropolitan counties, and ran our model separately with each. The adjusted R-squared was 0.43 in the rural counties and 0.53 in the metropolitan counties. The better performance in metropolitan counties may be a reflection of underlying causal differences or may be the result of a larger measurement error in the underlying death records or population data.
In varying the outcomes, we conducted our regression analysis using age-adjusted mortality for Black people and the percentage of Black children born at low birthweight. The first is defined as the percentage of Black people who died in each county between 2016 and 2020 using data from the Centers for Disease Control and Prevention. Mortality rates treat each death equally, and with age-adjustment, they are not affected by age differences across communities. Age-adjusted mortality rates are less sensitive to deaths at young ages compared to life expectancy.
Our second outcome of interest is the percentage of Black children born at low birthweight (less than 5.5 pounds) using 2014-2020 data from the County Health Rankings and Roadmaps program. This measure accounts for the fact that death is not the only important measure of health; we are also interested in morbidity, but in the absence of a comprehensive measure of morbidity at the county level, we chose the share of Black children born at low birthweight. This outcome is a sign of poor maternal health and health care, and thus picks up on many potential issues related to morbidity.
We predicted age-adjusted mortality and low birthweight percentages using the same 13 items from our Index, and obtained similar results as when we used life expectancy. The adjusted R-squared values were only modestly smaller than in the primary model (0.46 for age-adjusted mortality and 0.36 for low-weight births).
Moreover, where the Black Progress Index is higher, the life expectancy of other groups is also higher. Our model explains 58% of the variation in non-Hispanic white life expectancy.
Given these results, we therefore conclude that our Index variables capture social conditions that are broadly relevant to health outcomes and meaningful both in rural and urban areas.
To assess the effects from each Index component, we standardized the measures so that one unit is equal to a standard deviation. This is a useful way to assess how a meaningful change in the variable would predict health. Here, we focus on life expectancy, since it has the clearest interpretation and forms the basis of our Index.
Of the 13 Index components, the percent of Black adults born outside the United States has the largest effect. One standard deviation in this variable (about 11 ppt with a mean of 7%) adds one year to predicted life expectancy for Black people living in the county. The causal interpretation is unclear; it may be a pure composition effect, in that foreign-born Black Americans enjoy better health than the native Black population. It is well established that foreign-born Black immigrants to the United States live longer than native-born Black Americans, and the gap is strikingly large: eight years for women and 10 years for men.[7] The gap remains even among Black adults on Medicare, suggesting that health insurance does not explain it.[8] Another possibility is that foreign-born Black Americans move to counties that have other advantages associated with health.
To provide some examples, in Cass County, N.D., which is in the Fargo metro area, 73% of the Black population is foreign-born and Black life expectancy reaches 78.6. In Scott County, Minn., which is in the Minneapolis metro area, 63% of the Black population is foreign-born and life expectancy reaches 89.7 years.
On the opposite end, many counties in the South have no foreign-born Black people, according to census data. One such county is Chester County, S.C., outside of the Charlotte, N.C. metropolitan area, where life expectancy for Black people is just 69.3 years.
The percentage of Black adults ages 25 and over with at least a bachelor’s degree is also highly predictive of longer life, adding 0.38 years for every standard deviation (11 ppt with a mean of 16%). The individual effect of education on health is well established, and living near higher-income adults may boost health in other ways, such as by improving markets, safety, or government policy and resources.[9]
The Black college attainment rate is very high in several counties in the Atlanta, Baltimore, and Washington, D.C. metro areas, including Forsyth County, Ga. (56%); Howard County, Md. (54%); and Arlington and Loudoun counties, Va. (51% and 50%, respectively). Life expectancy for Black adults in these places is also very high, ranging from 79.4 in Howard County to 82.4 in Loudoun County. On the opposite end, the Black college attainment rate is just 4.4% in Baker County, Fla., outside of Jacksonville, and Black life expectancy there is 76.4. Butts County, Ga., outside of Atlanta, has the same low Black college attainment rate and even lower Black life expectancy, at 73.8.
Black entrepreneurship—measured by the rate of business ownership—is a relatively small but still significant predictor of life expectancy. Roughly 1% of Black adults ages 18 to 64 own an employer business, and a standard deviation in ownership rates predicts an increase of roughly 0.2 years in life. The Black ownership rate is as high as 4% in Hidalgo County, Texas, where Black life expectancy is 91.5 years.
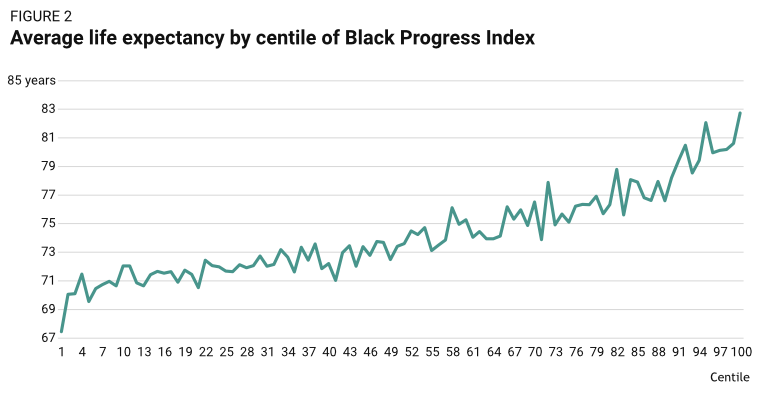
Overall, a standard deviation in each wealth measure adds 1.4 years of life. The same effect is 2.1 for human and social capital measures, 0.33 for environmental quality measures, 0.36 for family health measures, and 1.1 for safety measures.Black people live approximately 14 years longer in the counties ranked in the top 1% of the Index compared to counties at the bottom—81.72 years versus 67.8 years.
Uncertainty remains about how variables influence life expectancy
The primary goal of this research is to find the social and neighborhood conditions of places where Black health is thriving. A better understanding of these social factors and how they vary across places can inform cooperative efforts to improve life prospects. Yet, the causal pathway linking these factors to life expectancy is not necessarily straightforward or clear from existing research, and more work will need to be done.
Take our measure of family health. In the average county in our sample, 57% of Black children are not living with their father, according to Census Bureau data. This matters for several reasons, but one is straightforward: When they are living in the household, Black fathers invest heavily in their children in terms of play, reading, helping with homework, and other activities. They spend much less time on these activities when they are not living in the household.[10]
Controlling for their living arrangements, Black fathers spend at least as much time as non-Hispanic white fathers do on these activities. But Black fathers are more than twice as likely to live apart from their children as non-Hispanic white fathers, so the overall effect is one of less average involvement. Father involvement, in turn, predicts healthier behavior from their children, such as reduced rates of smoking.[11] Many complex factors are shown to affect the probability of paternal involvement, including the degree of parental conflict, quality of past family relationships, and whether the father has ever been incarcerated.[12]
Another complex finding is that we observe a strong negative relationship between rates of religious membership and Black longevity, meaning Black people living in geographies with people who are more religious have lower life expectancies. This is somewhat puzzling, because people who are more religious are usually found to have better self-reported health (however, they are also more likely to be obese).[13] It is possible that areas with higher rates of religious participation tend to have other characteristics that are harmful to health (e.g., worse crime, less access to quality food, pollution). Also, the faithful may experience higher levels of suffering in ways that are not readily captured by income or education levels; people may seek religion when the rest of society devalues them.
An alternative explanation that links many of these findings is that health knowledge and access to information can have important effects on health. People with higher levels of education, numeracy, and literacy are found to exhibit both higher levels of health knowledge and engage in healthier behaviors. Having access to diverse social networks—which we find predicts better health—may also increase health knowledge by providing greater access to “what works.”
Regardless of the causal pathways, the 13 variables identified in our analysis explain roughly half of the variation between counties with respect to Black life expectancy. If a low-performing county were to become a high-performing county, predicted life expectancy would increase by an additional 14 years for the average Black resident.
Overall, this analysis will raise questions that we cannot confidently answer about the fundamental drivers of community health and well-being. We hope to refine and expand our analysis in updated versions of the Index. For now, we hope this research can encourage evidence-based analysis and policy discussions concerning the health of Black people and point toward collective action that help more communities thrive, regardless of their racial composition.


About the Authors


The authors thank Makada Henry-Nickie, Zinzi Bailey, Sheri Johnson, Christine Muganda, Keith Gennuso, and Regina Seo for comments and suggestions on previous versions of this report.
Appendix
Appendix Table 1. The top 20 U.S. metropolitan areas with highest Black Progress Index score, actual life expectancy, and life years unexplained by model
| Metropolitan area | Black Progress Index | Black Life Expectancy at birth | Unexplained year of Black life | Black population, 2020 |
|---|---|---|---|---|
| Naples-Marco Island, FL | 82.6 | 86.0 | 3.4 | 25,613 |
| Portland-South Portland, ME | 82.3 | 78.9 | -3.4 | 11,297 |
| Barnstable Town, MA | 81.5 | 76.5 | -4.9 | 6,098 |
| Lewiston-Auburn, ME | 80.7 | 79.4 | -1.3 | 2,559 |
| Worcester, MA-CT | 80.6 | 78.9 | -1.7 | 44,534 |
| Urban Honolulu, HI | 80.3 | 82.8 | 2.5 | 24,048 |
| Manchester-Nashua, NH | 80.1 | 81.6 | 1.4 | 11,349 |
| McAllen-Edinburg-Mission, TX | 80.0 | 91.5 | 11.5 | 4,838 |
| Santa Rosa-Petaluma, CA | 79.9 | 78.9 | -1.0 | 8,266 |
| Punta Gorda, FL | 79.9 | 82.5 | 2.6 | 10,302 |
| Bangor, ME | 79.8 | 74.4 | -5.4 | 1,274 |
| San Jose-Sunnyvale-Santa Clara, CA | 79.6 | 79.6 | -0.1 | 47,902 |
| Miami-Fort Lauderdale-Pompano Beach, FL | 79.5 | 78.2 | -1.3 | 1,290,208 |
| Kahului-Wailuku-Lahaina, HI | 79.4 | 79.5 | 0.1 | 1,016 |
| Iowa City, IA | 79.3 | 88.5 | 9.2 | 11,656 |
| Boise City, ID | 79.3 | 79.5 | 0.2 | 6,867 |
| Santa Cruz-Watsonville, CA | 79.3 | 78.7 | -0.6 | 3,472 |
| Seattle-Tacoma-Bellevue, WA | 79.1 | 77.4 | -1.7 | 233,468 |
| Sioux Falls, SD | 79.0 | 74.7 | -4.3 | 12,768 |
| Boston-Cambridge-Newton, MA-NH | 79.0 | 79.5 | 0.5 | 394,461 |
[1] Measurement error, especially for smaller geographic areas, also causes a divergence between modeled life expectancy and observed life expectancy, and so a higher-than-predicted life expectancy does not necessarily mean that the area has some unmeasured positive effect on health.
[2] Bailey, Michael, Rachel Cao, Theresa Kuchler, Johannes Stroebel, and Arlene Wong. “Social connectedness: Measurement, determinants, and effects.” Journal of Economic Perspectives 32, no. 3 (2018): 259-80.
[3] We find that air pollution is only weakly correlated with population density (r=0.09), but population density is very strongly correlated with the intensity of land use and negatively correlated with tree cover. For these reasons, we group population density under “environmental” conditions, but we do not claim that low-population-density areas have cleaner air or water—just that they are exposed to more natural environments, including trees, depending on the climate.
[4] We considered other variables that may predict either safety or high levels of discrimination, such as the number of police officers per capita, deaths from police encounters per capita, hate crimes per capita, and anti-Black hate crimes per capita. None of these variables were statistically significant in predicting Black life expectancy in the presence of our other 13 variables, so they were not included in the final model.
[5] U.S. Arias E, Xu JQ. United States life tables, 2019. National Vital Statistics Reports; vol 70 no 19. Hyattsville, MD: National Center for Health Statistics. 2022. DOI: https://dx.doi.org/10.15620/cdc:113096
[6] We studied the cause of death—as recorded on death certificates—by age and race to calculate which causes account for the largest losses in potential life in 2020 (and thus contribute the most downward drag on longevity) for Black and white Americans. Deaths at early ages count proportionately more than deaths at older ages, because the death implies a larger loss of potential life when it happens early in life. We use age 100 as the reference age, because it is the oldest observable age in the CDC records. Thus, death at birth suggests a loss of 100 years, while death at 99 suggests a loss of one year. The Underlying Cause of Death data are produced by the Mortality Statistics Branch, Division of Vital Statistics, National Center for Health Statistics (NCHS), Centers for Disease Control and Prevention (CDC), United States Department of Health and Human Services (US DHHS).
[7] Singh, Gopal K., and Barry A. Miller. “Health, life expectancy, and mortality patterns among immigrant populations in the United States.” Canadian journal of public health 95, no. 3 (2004): I14-I21.
[8] Dupre, Matthew E., Danan Gu, and James W. Vaupel. “Survival differences among native-born and foreign-born older adults in the United States.” PLoS One 7, no. 5 (2012): e37177.
[9] Cutler, David M., and Adriana Lleras-Muney. “Understanding differences in health behaviors by education.” Journal of health economics 29, no. 1 (2010): 1-28.
[10] Jones J, Mosher WD. Fathers’ involvement with their children: United States, 2006–2010.
National health statistics reports; no 71. Hyattsville, MD: National Center for Health Statistics. 2013.
[11] Menning, Chadwick L. “Nonresident Fathers’ Involvement and Adolescents’ Smoking.” Journal of Health and Social Behavior 47, no. 1 (March 2006): 32–46. https://doi.org/10.1177/002214650604700103; Amato, P.R., and Gilbreth, J.G. Nonresident fathers and children’s well-being: A meta-analysis. Journal of Marriage and the Family (1999) 61:557–73; Steinberg L. We know some things: Parent–adolescent relationships in retrospect and prospect. Journal of Research on Adolescence. 2001;11:1–19.
[12] Perry, Armon R., and Mikia Bright. “African American fathers and incarceration: Paternal involvement and child outcomes.” Social work in public health 27, no. 1-2 (2012): 187-203; Coley, Rebekah Levine, and Daphne C. Hernandez. “Predictors of paternal involvement for resident and nonresident low-income fathers.” Developmental psychology 42, no. 6 (2006): 1041.
[13] Nam, Sanggon. “The effects of religious attendance and obesity on health by race/ethnicity.” Osong Public Health and Research Perspectives 4, no. 2 (2013): 81-88; Gillum, R. Frank. “Frequency of attendance at religious services, overweight, and obesity in American women and men: the Third National Health and Nutrition Examination Survey.” Annals of epidemiology 16, no. 9 (2006): 655-660.