Land scarcity, high construction volume, and distinctive leases characterize Japan’s rental housing markets
Editor’s note: In case you missed it, watch an event held on April 21 discussing lessons from around the world related to policies to support stable, affordable rental housing.
The Japanese housing market is characterized by a large construction volume, rapid technological progress, fast depreciation of housing value, a thin secondary market, and low maintenance of existing properties. Legal and tax systems unintentionally encourage wealthy individuals to invest in studio apartments to rent out to young people living in urban areas. Thus, family housing is mainly available through ownership. The public sector played an important role in addressing housing shortages after World War II due to massive migration to large metropolitan areas. The public housing finance program encouraged homeownership, while public and quasi-public rental units provided shelter to low- and middle-income households. Roughly 36% of Japanese households rent their homes today. The biggest challenge is a mismatch between housing stock and demographics in a rapidly aging and shrinking society, exemplified by vacant housing units.
Overview of rental housing and renter households
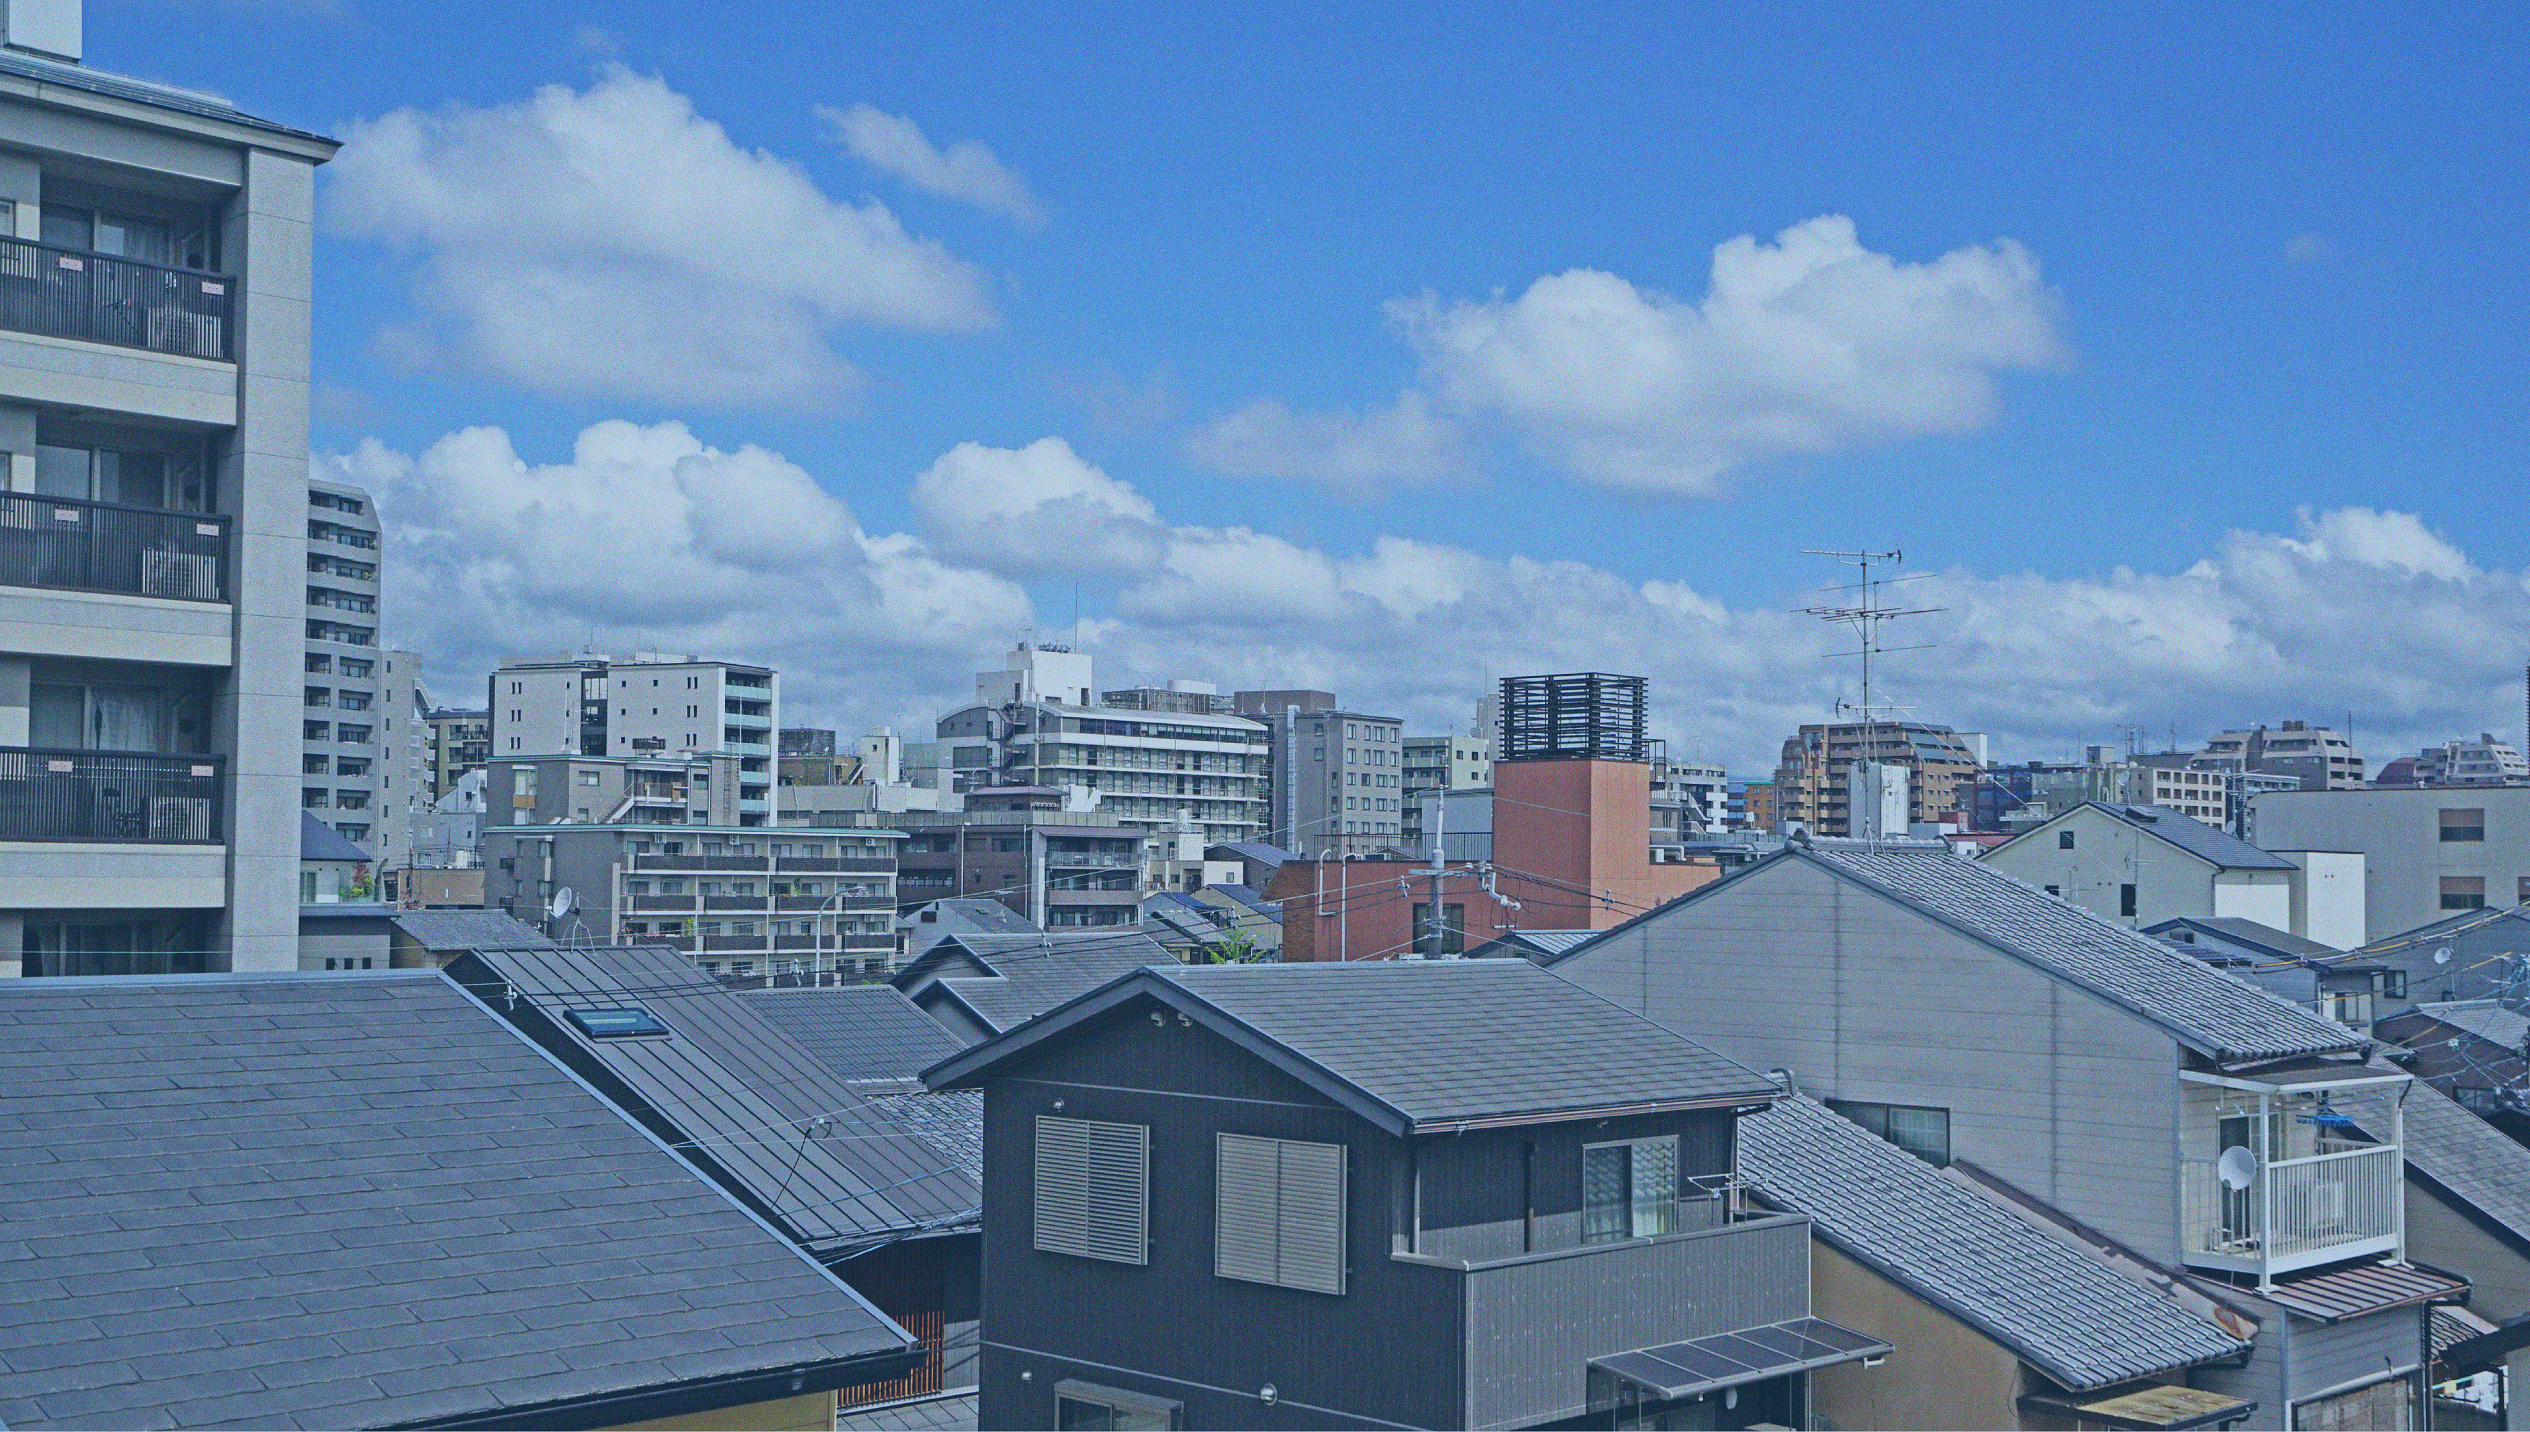
Several distinctive factors related to Japan’s physical geography and recent history provide important context to understand the country’s housing market: scarce land, the prevalence of earthquakes, and economic trends following WWII.
Scarce land is the most fundamental factor defining the Japanese housing market. Habitable area—excluding inland water, forest, and woodland—accounts for only 29% of the country’s land area. With a population of 128 million, per capita habitable area is only 800 square meters, compared with 19,300 square meters for the U.S. Urban area is further limited by land use regulations.
Another factor is frequent and significant earthquakes. Between 2000 and 2009, 212 earthquakes of magnitude 6.0 or greater occurred around Japan—accounting for 20% of high-magnitude earthquakes around the world.i Thus, Japan has developed technology to make structures resilient to earthquakes. The national building code has been revised after every major earthquake. Rapid technological changes make old structures obsolete and their value depreciate fast. The 1981 revision is particularly significant, creating a qualitative difference in property value between buildings built before and after 1981.
The third defining factor is a rapid change in housing stock, demographics, and lifestyle after WWII. After millions of houses were burnt down during the war, there was a housing shortage of around 4.2 million units in 1945. The first baby boom between 1947 and 1949 exacerbated the housing shortage. Postwar housing construction consistently increased with rapid economic growth, with 76.7 million units built between 1948 and 2020 for 54 million households. The economic and industrial system evolved to constantly supply the large construction volume that was frequently replacing older buildings. Based on the 2018 Housing and Land Survey (HLS), 76% of the housing stock is compliant with the 1981 building code (i.e., 37 years old or newer).
During the postwar economic growth period, a large portion of the population migrated from rural areas to urban areas, especially to the Tokyo metropolitan area.ii Between 1954 and 2019, cumulative migration into three of Japan’s major metropolitan areas was 12 million—of which, 10 million moved to the Tokyo metropolitan area. This massive inter-region migration created a significant housing shortage in urban areas, especially during the 1950s and 1960s, alleviated in part by active public sector investments.
Physical characteristics of rental stock
In 2020, approximately 60% of Japan’s newly constructed units were owner-occupied houses and condominiums, and the remaining 40% were rental units. Among the newly constructed units, 78% of ownership units are detached houses, most of which have wooden structures. Newly constructed rental units are primarily multifamily properties that have non-wooden structures such as steel-reinforced concrete.
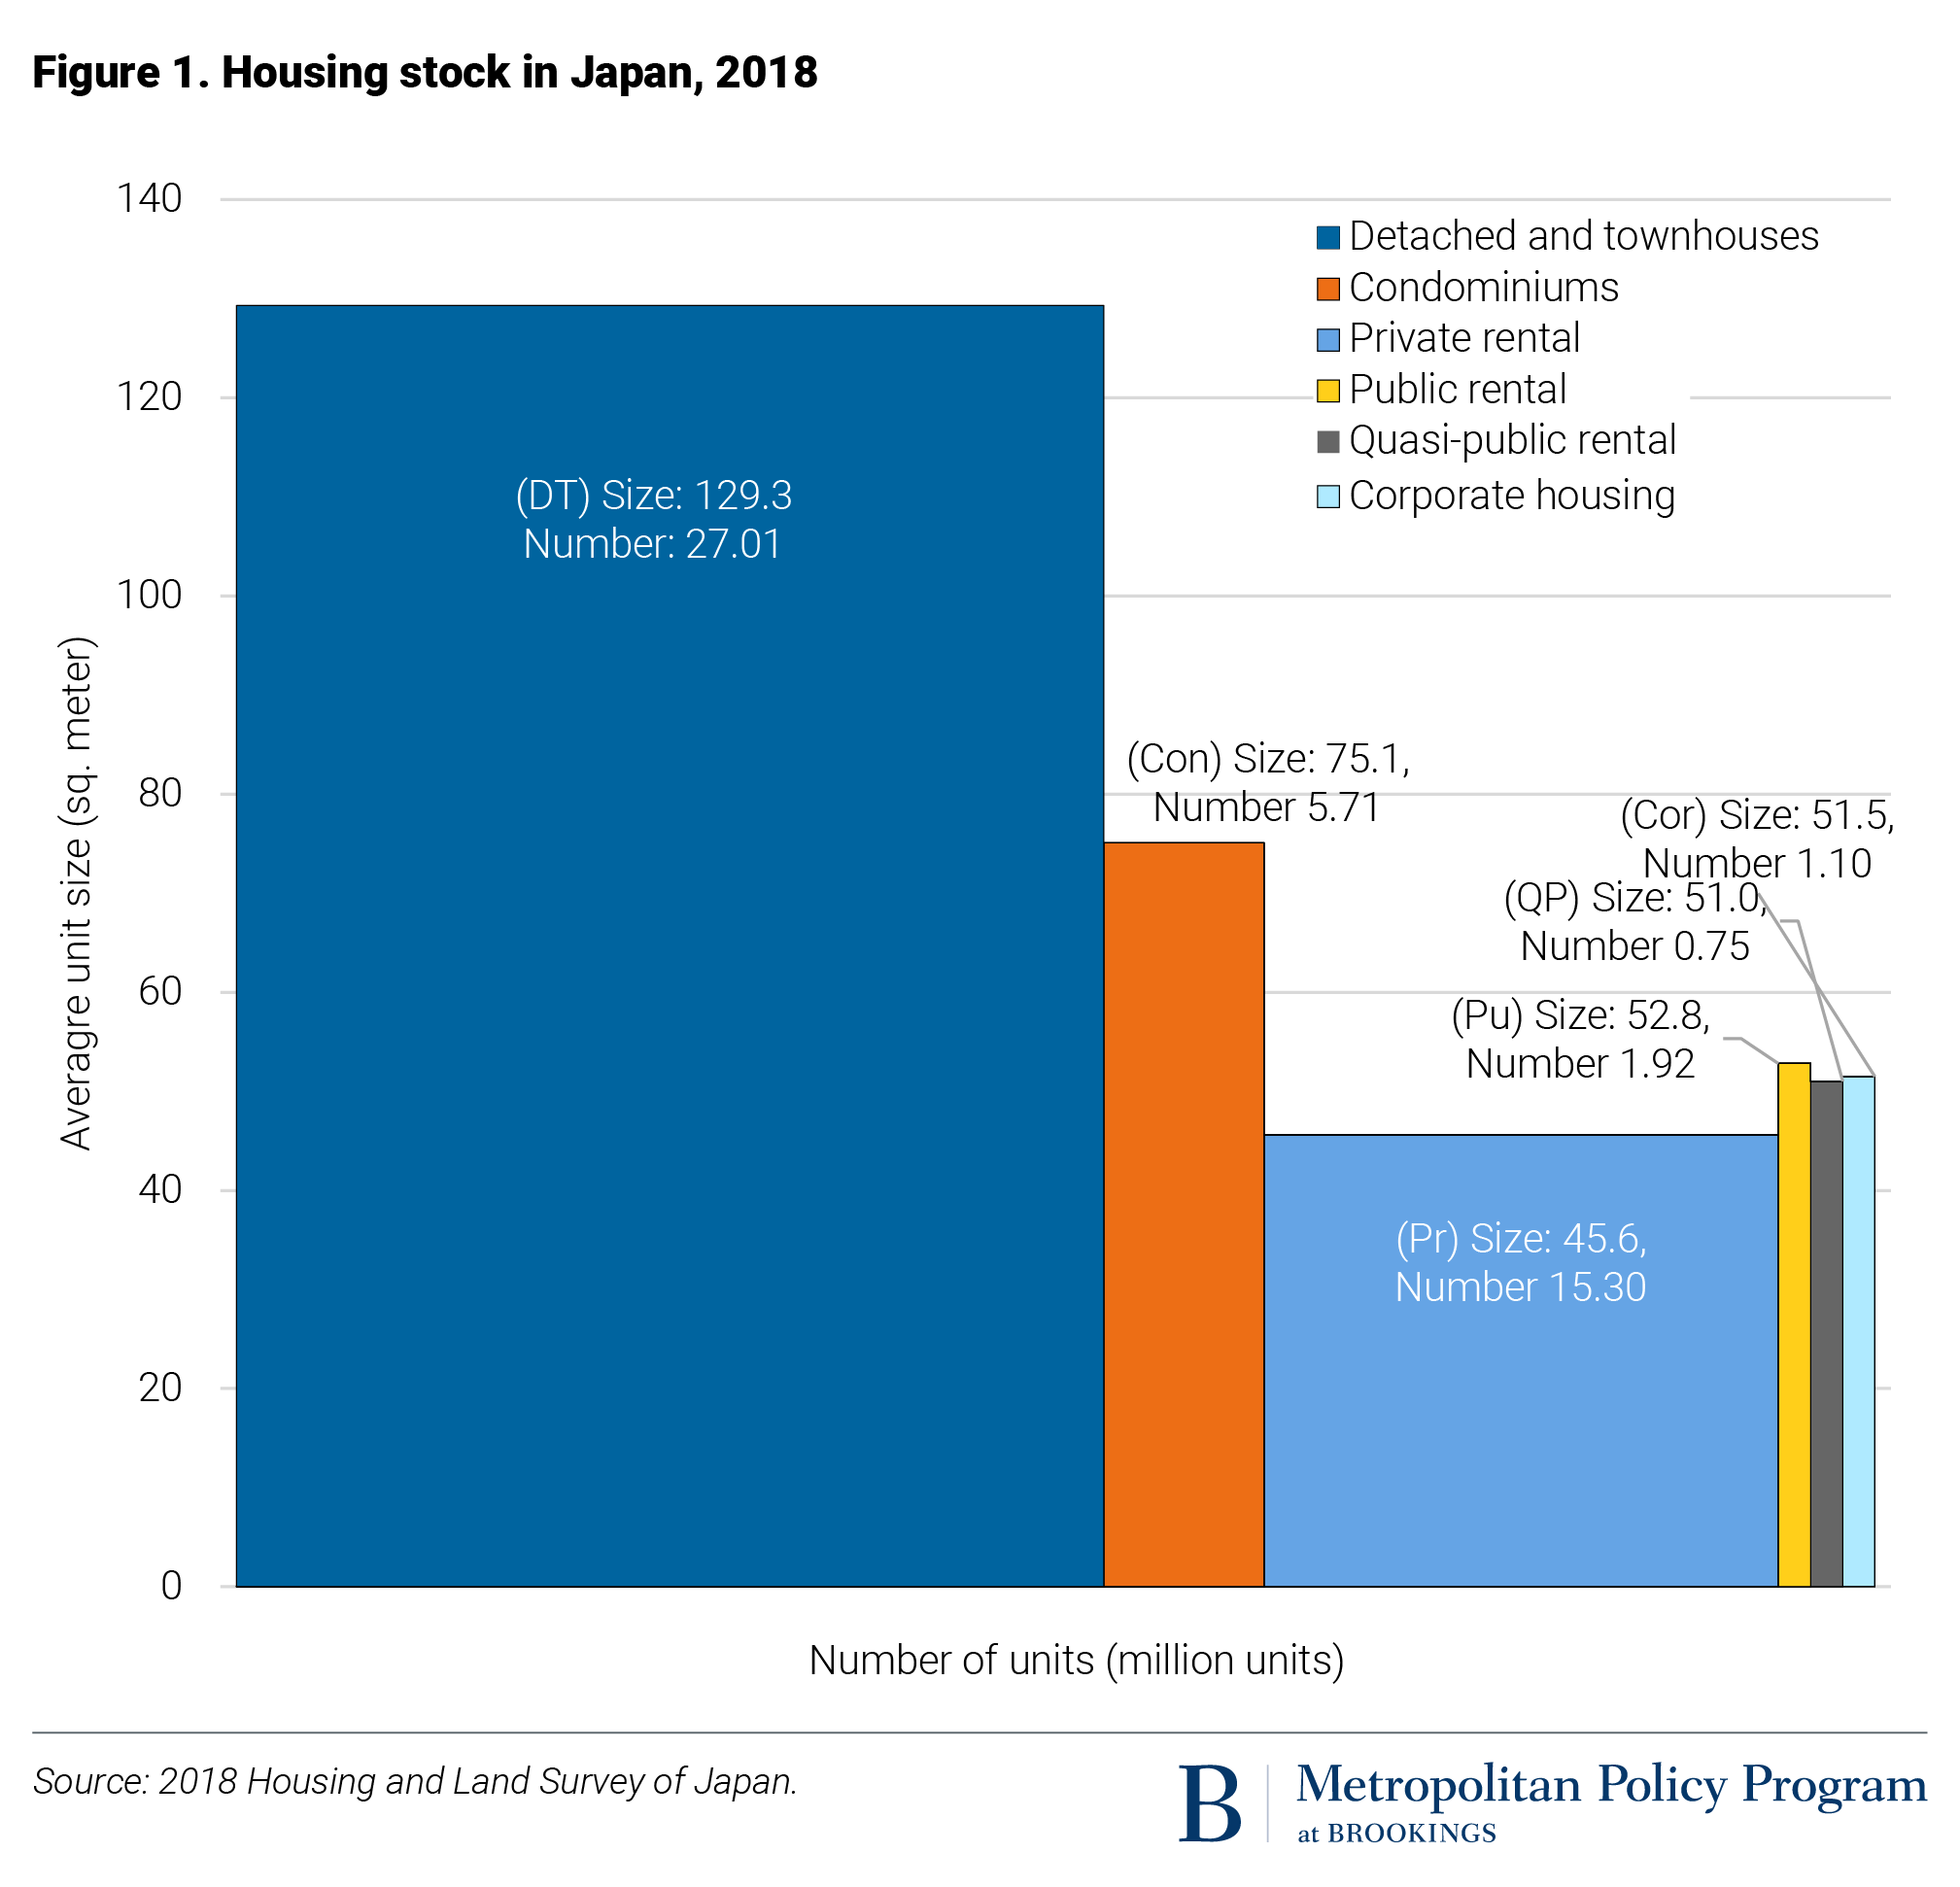
Figure 1 depicts the occupied housing stock in Japan based on the 2018 HLS. The horizontal axis represents the number of units, and the vertical axis represents the average unit size in square meters. Thus, the area of a rectangle represents the total floor area for each housing type. The total number of occupied housing units is 53.6 million, and the average unit size for all housing types is 93 square meters.
The homeownership rate is 61.2% for all housing types. This rate has been stable at around 60% for the past half-century, but significantly varies by the age of the household head. The rate is consistently around 80% for household heads 60 years or older, and decreases for heads ages 30 to 39 (39%) and 30 or younger (15%).
Rental unitsincluding public rental, quasi-public rental,iii and corporate housingaccount for 35.6% of the total number of occupied housing units. Among rental units, private rental housing accounts for approximately 80% of both floor area and the number of units. The share of private rental housing has steadily increased from 24.1% in 1963 to 28.5% in 2018. However, rental units are significantly smaller than owned houses; thus, rental units account for only 19% of the total floor area. Public, quasi-public, and corporate rental housing have decreased their significance over time and account for only 7.1% of housing units.
Figure 2 depicts a skewed floor size distribution for private rental housing, in which the average unit size is 45.6 square meters. Non-wooden apartments are the most prevalent housing type (72% of all private rental housing). However, units smaller than 30 square meters account for 26% of the total. It is more difficult to find a detached house or a townhouse of a decent size for rent.
Rental housing type is also correlated with location. Thus, there is significant variation in rental housing size by location. Tokyo’s rental housing is primarily small apartments in non-wooden buildings, whereas local cities have more detached rental housing and larger units.

According to the 2003 HLS, individuals own 85% of Japan’s private rental units. Residential investments by corporations (including REITs) are still minor, despite rapid growth in recent years. Individual ownership was accelerated during the property market boom in the 1980s, because banks promoted the redevelopment of houses into medium-rise rental properties to create lending opportunities. The 2015 inheritance tax change accelerated individual ownerships.
Individual owners disproportionately provide so-called “one-room mansions”—rental studio apartments typically 30 square meters or smaller located in medium- to high-rise multifamily properties with non-wooden structures. Renting studios is popular among individual property owners because a single household living in a studio tends to have a quick turnover.
Renter households
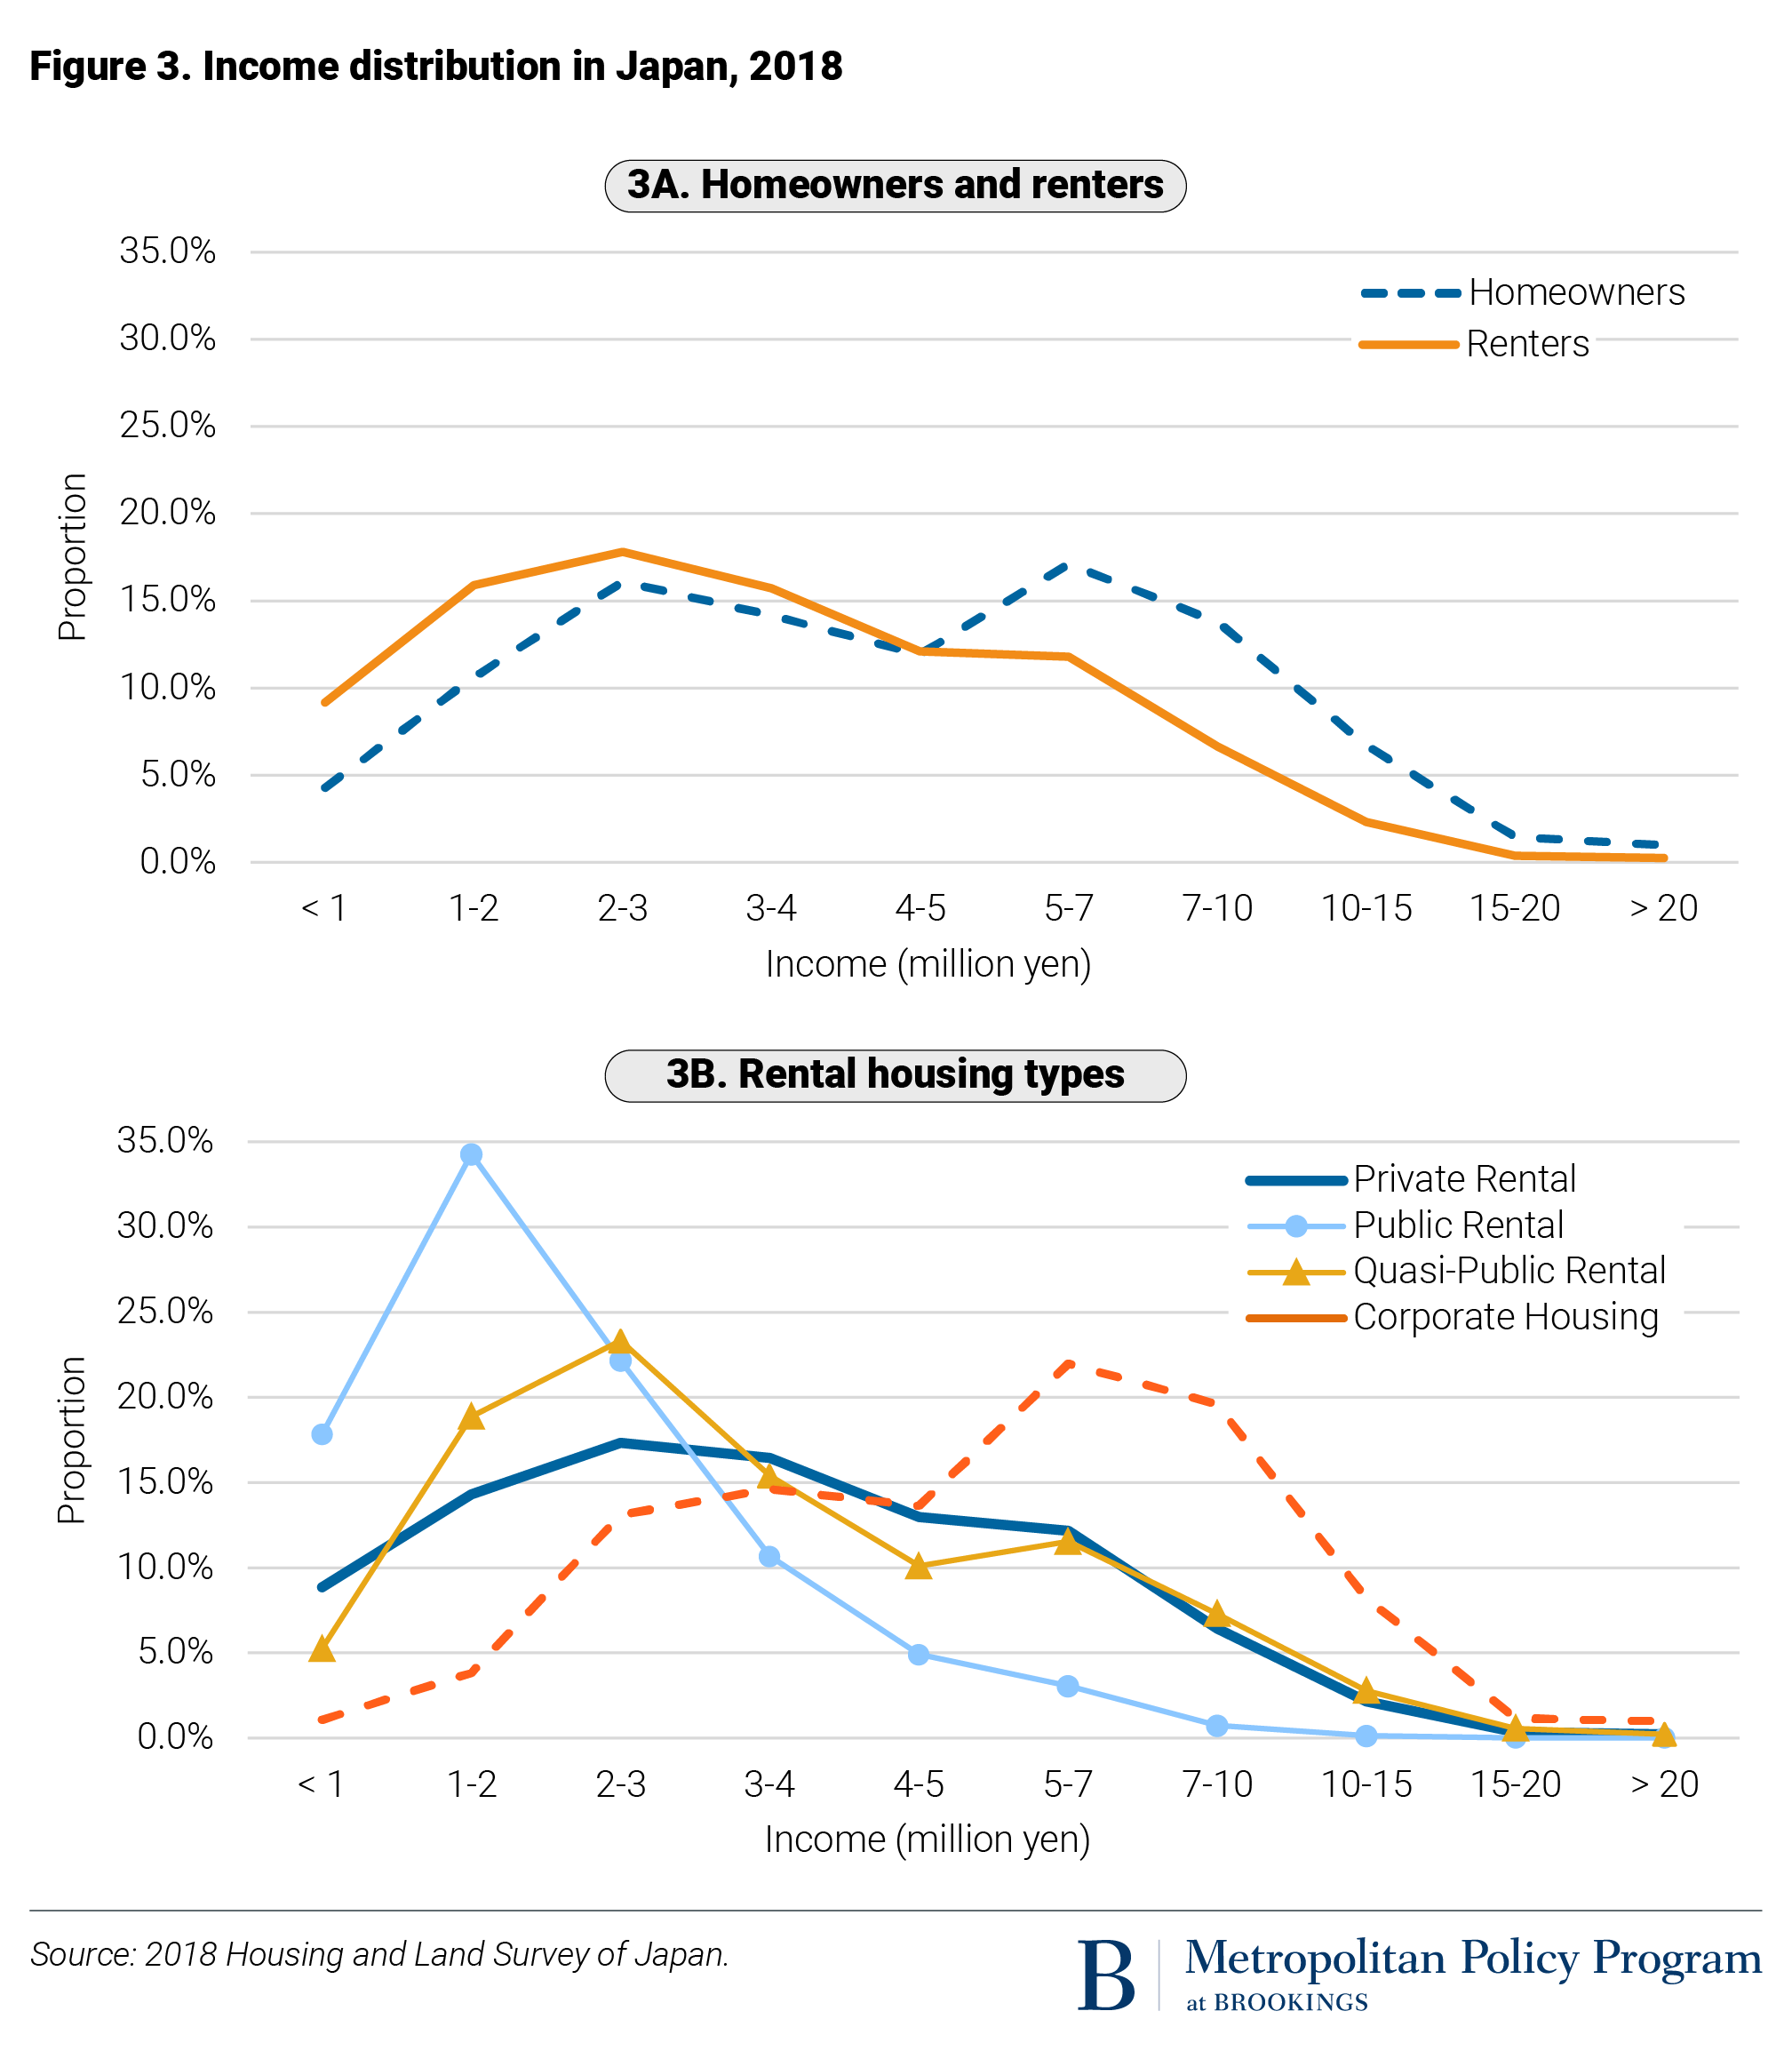
Renter households have lower incomes than homeowners on average (Figure 6, Panel A). The estimated mean income is 5.15 million yen for homeowners and 3.51 million yen for renters. Renter household income varies by housing type (Panel B). Households living in public rental housing have the lowest income, with a mode of 1 to 2 million yen (approximately $9,000 to $18,000). Income distributions for private rental housing and quasi-public housing are comparable. The distribution for corporate housing exhibits higher income than homeowners. This is because large companies typically provide corporate housing as a fringe benefit to retain workers. The estimated mean income is 5.97 million yen for corporate housing, 3.51 million yen for private rental housing, 3.70 million yen for quasi-public rental housing, and 2.02 million yen for public rental housing.
Young households tend to live in private rental housing. Among heads of households younger than 30 years old, 82% live in private rental housing, and only 9% own houses. For households between 40 and 49 years old, the private rental share decreases to 44%, and the ownership rate increases to 49%.
According to the Family Income and Expenditure Survey (FIES), the ratio of housing expenditures to annual income was 7.6% in 1985, and gradually increased to 10.6% in 2001. The average ratio is about 16% for homeowners, 13% for renters, 10% for public housing renters, and 4% for subsidized corporate housing renters.
Institutional and policy environment of rental housing
Legal environment
Real estate leases are governed by the Act on Land and Building Leases (ALBL), enacted in 1991, as well as the Civil Code. The ALBL and case law provide strong tenant protections by making it extremely difficult for landlords to terminate leases or refuse lease renewal. A landlord needs to file a lawsuit and successfully establish just cause to refuse renewal after lease expiration or to terminate a lease even upon a tenant’s breach. By contrast, tenants can renew leases indefinitely or terminate leases on one month’s notice without just cause. These provisions expose landlords to a high degree of risk, making the housing rental business less attractive.
The ALBL was amended in 1999 to create an option to alleviate these strong tenant protections by introducing a new lease contract type called a fixed-term lease. As the name suggests, a fixed-term lease lasts for a period of time agreed upon by the landlord and the tenant, and does not automatically renew after the term expires. Fixed-term leases were expected to resolve the rental housing supply problem, but this lease type is not commonly used for residential leases even 20 years after its launch because of ambiguities and complexities in contracting.
The economic consequences of the ALBL’s strong tenant protections have been extensively discussed (e.g., Seko 2014; Kanemoto, 2016). The limited rent adjustment at lease renewal can be considered a form of rent control, which has been shown to discourage the supply of rental housing. The ALBL can also result in longer vacant periods between leases. Professional and corporate investors have shied away from entering the rental market because of the risks involved. However, individuals motivated by tax advantages are willing to invest in “one-room mansions” rentals in large cities and select tenants who are less likely to stay for many years, such as college students and single young adults. As a result, high-quality rental apartments for families are scarce.
The public sector’s role in developing, financing, and owning rental housing
To address the housing shortage after WWII, the government carried out a series of Five-Year Housing Construction Plans (1966 to 2005) with three major programs. First, the government established the Government Housing Loan Corporation (GHLC) to encourage housing construction and homeownership through long-term, low-interest, pre-payable fixed-rate mortgages. These generous mortgage terms were made possible by annual government subsidies and low-cost financing from postal savings and insurance and public pensions (Fiscal Investment and Loan Program [FILP]). Low- to middle-income borrowers benefited significantly from a 5.5% rate cap during the high-interest rate environment until the 1970s, and free prepayments during the low-rate environment in the 1990s. Between 1950 and 2007, the GHLC financed 19.4 million housing units.
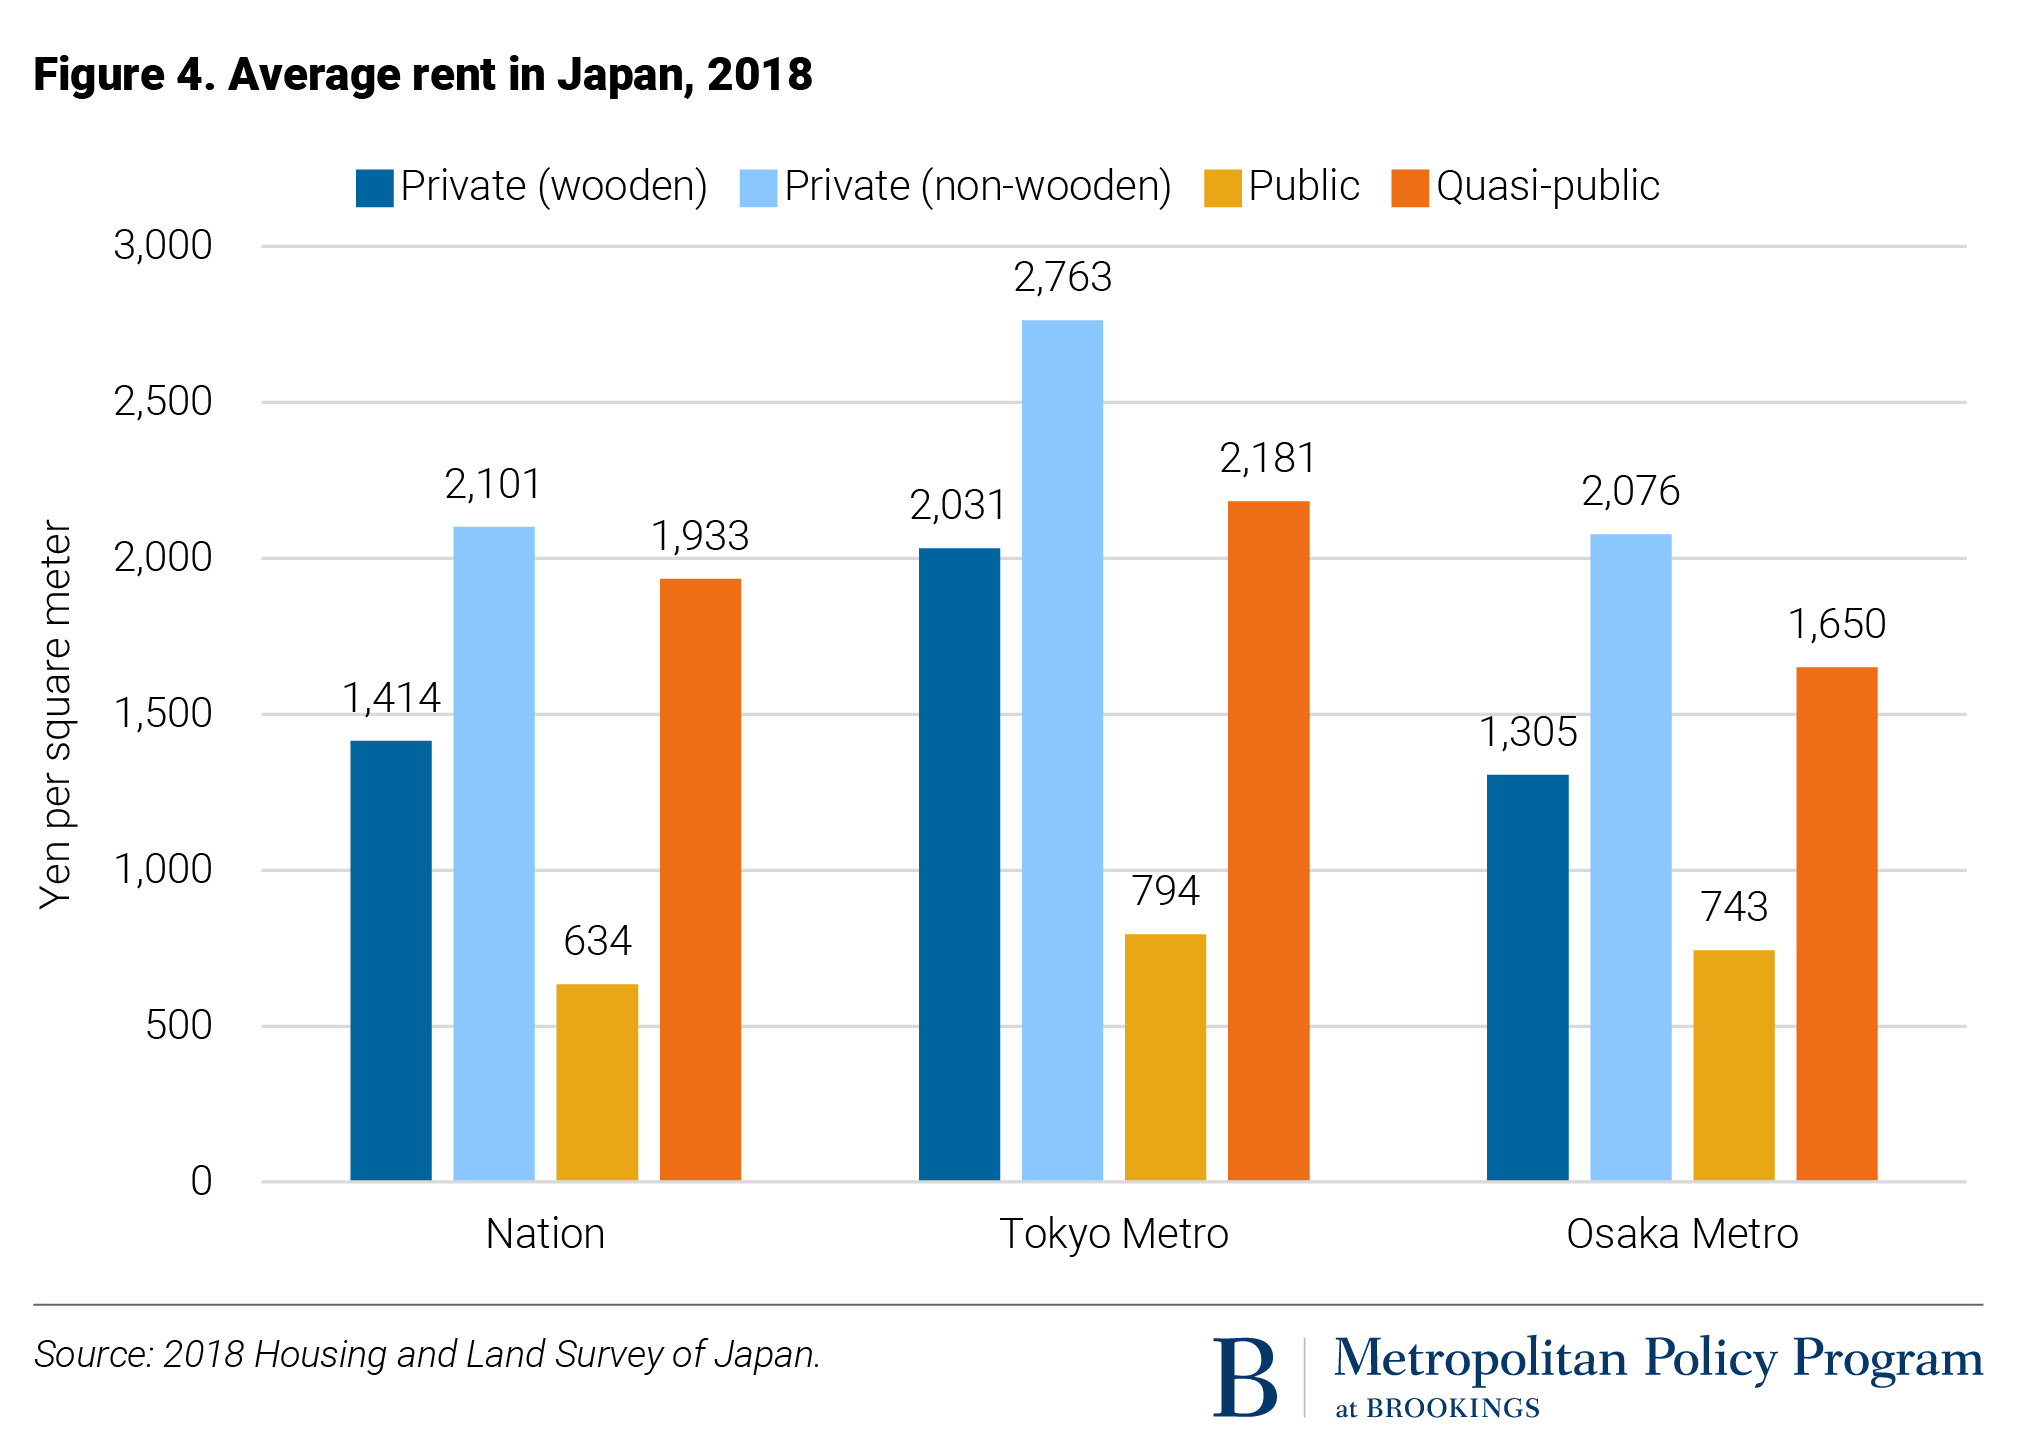
Second, local governments constructed and operated public rental housing for low-income renters. The average rent for public rental housing is significantly lower than for other rental housing, particularly in major metropolitan areas (Figure 6). Because public houses are almost fully occupied (99.2%), there is significant rationing; in 2014, the admission rate was 6.5% for the Tokyo metropolitan area and 17.2% nationally. One issue is that sitting tenants tend to not leave public housing even after they become ineligible.
Third, the government established the Japan Housing Corporation (JHC) to address the acute housing shortage in urban areas.iv Many prefectures also founded public housing corporations. The JHC and public housing corporations provided quasi-public rental housing through large-scale development in urban areas using the FILP financing. This program is unique because it supplies housing for middle-income households without many rent discounts. (Figure 6).
After the housing shortage was resolved, the government enacted the Basic Act for Housing in 2006 by focusing on housing quality issues such as elderly persons’ housing, low carbon emissions, and condominium management. The GHLC also stopped originating mortgages in 2007 and was reorganized as the Japan Housing Finance Agency (JHF) to securitize private mortgages in the form of covered bonds. The JHF assumes the credit risk of mortgage-backed securities but passes prepayment risks to investors, as in the U.S.
Tax incentives and subsidies
Japan’s nationally uniform property tax rate is 1.4%, with an additional city planning tax rate of 0.3% in urbanized areas. The tax system treats residential properties preferentially relative to commercial properties and financial assets. First, real estate tax assessment is reduced, especially for rental properties—whether it be residential or commercial. For owner-occupied properties, tax assessments are typically 70% of land value and 60% of structure value. For rental properties, the assessment is further reduced by the deduction of the leasehold right (70% of the land value) and the tenant right (30% of the structure value). Thus, the assessed real estate value can be less than half of the market value.
Second, residential properties (both owner-occupied and rented) have additional tax advantages. The assessed value for residential land is reduced by two-thirds for property taxes and one-third for city planning taxes. Furthermore, the assessment reduction is enhanced for small residential land up to 200 square meters (by five-sixths for property taxes and two-thirds for city planning taxes). Moreover, for multifamily rental properties, the assessment reduction for small residential land applies to each apartment.
Third, the inheritance tax system also favors residential properties in a similar manner through a low tax assessment, the leasehold-right deduction, the tenant-right deduction, and the small residential land treatment. The inheritance tax advantage has driven rental apartment investment because the marginal inheritance tax rate reaches 55% for the highest tax bracket.
Lastly, a mortgage borrower has an income tax credit based on loan amount, not income deduction for interest payments. Overall, the tax system significantly favors residential properties.
Key challenges facing the rental housing market
The biggest challenge is managing the housing stock in an aging and shrinking society. Japan saw its population peak in 2008 and is aging quickly. The old-age dependency ratiov was 47 in 2019, compared with 25 for the U.S.
As aggregate housing supply exceeds housing demand, the national vacancy rate reached 13.6% for all housing types and 18.5% for rental housing in 2018. This high vacancy rate for rental housing is caused partly by tax distortions and heavy tenant protections. Wealthy individuals motivated by tax advantages supply small apartment units, but do not lower rents to fill vacant units because low-rent tenants will sit in the apartment for an extended period. At the same time, owners try to avoid renting to families because of low turnover. Thus, the tax-induced supply of rental housing does not meet the demand for affordable family housing.
Furthermore, among owner-occupied housing, there is underutilized housing stock in the form of unused rooms, especially for elderly households (Seko et al., 2021). Moreover, a significant fraction of old housing stock does not meet the current housing standards. Demolishing or redeveloping some of the old properties will be inevitable, but utilizing the old stock is challenging due to the difficulty in collective decisionmaking for condominiums.
Footnotes
i Cabinet Office, 2012 White Paper on Disaster Management, Figure 1-1-1.
ii Report on Internal Migration in Japan based on Resident Registration System. Table 5, Number of Net Migration by Sex for Japan, Prefectures and Major Cities: since 1954. Tokyo Area is composed of Tokyo, Kanagawa, Chiba, and Saitama; Osaka Area is composed of Osaka, Kyoto, Hyogo, and Nara; and Nagoya Area is composed of Aichi, Gifu, and Mie.
iii Rental units provided by the Urban Renaissance Agency and Public Housing Supply Corporations. These corporations are explained in the institutional section.
iv The JHC merged with the Land Development Corporation and the Regional Development Corporation to become the Urban Renaissance Agency (UR).
v The old-age dependency ratio is the ratio of the number of elderly people aged 65 and over to the number of people of working-age people between 15 and 64 years old.
About the Author