

Editor’s Note: This white paper is part of the USC-Brookings Schaeffer Initiative for Health Policy, which is a partnership between the Economic Studies Program at Brookings and the USC Schaeffer Center for Health Policy & Economics. The Initiative aims to inform the national health care debate with rigorous, evidence-based analysis leading to practical recommendations using the collaborative strengths of USC and Brookings. This work was supported by a grant from the Robert Wood Johnson Foundation.
Under the Affordable Care Act (ACA), states have the option to expand their Medicaid programs to all non-elderly people with incomes below 138% of the federal poverty level (FPL). To date, twelve states have not done so. In these states, people with incomes below 100% of FPL are generally ineligible for any form of deeply subsidized coverage because subsidized Marketplace coverage is typically unavailable to people below the poverty line. Additionally, people with incomes between 100% and 138% of the FPL generally face higher cost-sharing—and, until recently, faced higher premiums—than in Medicaid.
The current draft of the Build Back Better Act (BBBA) proposes to fill this “coverage gap” by expanding eligibility for Marketplace coverage to people below the poverty line in these states. It would also make changes to Marketplace coverage for all people with incomes below 138% of the FPL to make that coverage more “Medicaid-like,” including eliminating almost all premiums and cost-sharing, adding coverage of certain services that are covered in Medicaid but not typically covered in the Marketplace, and allowing people to enroll in subsidized coverage even if they are offered coverage at work.
While the main beneficiaries of these changes would be low-income people in the coverage gap states, these coverage proposals would also have major implications for hospital finances.[1] This analysis uses the rich evidence base produced by state Medicaid expansions to estimate these effects on hospitals.
I estimate that aggregate hospital margins in the coverage gap states would improve by $11.9 billion if the proposals in the draft BBBA were fully in effect in 2023, as summarized in Table 1. The main reason for this improvement is that hospitals would now receive payment for some care that they already deliver but are not paid for; hospitals would also profit from higher volume as people gaining coverage sought more care. Those benefits would be partly offset by a modest migration of enrollees out of employer-sponsored plans, which likely pay hospitals more than Marketplace plans. Hospitals in the coverage gap states would also receive smaller Medicare disproportionate share hospital (DSH) payments since those payments are set using a formula that takes into account the national uninsured rate and the allocation of uncompensated care across hospitals, both of which would change. (By contrast, I estimate that hospitals in expansion states would receive larger Medicare DSH payments.)
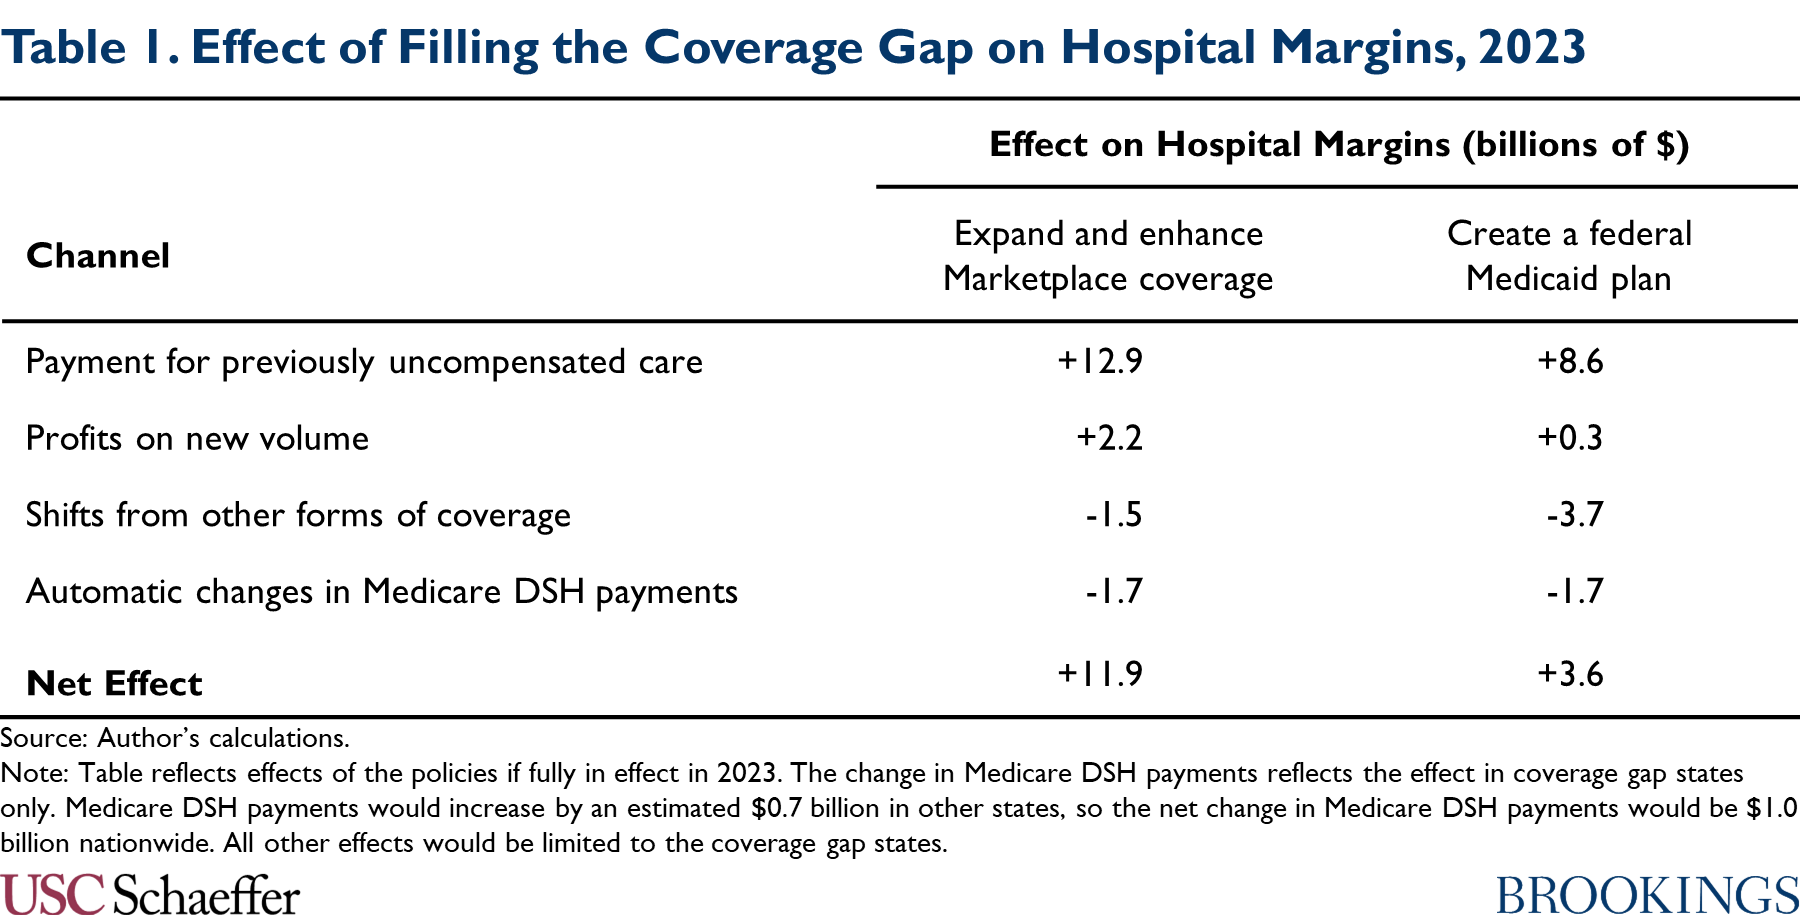
Hospitals in the coverage gap states would experience a smaller improvement in margins—$3.6 billion in my estimates—if policymakers instead filled the coverage gap by creating a federal Medicaid plan, as envisioned in an earlier House reconciliation proposal. A federal Medicaid plan would likely pay hospitals considerably less than Marketplace plans. As a result, hospitals would receive less revenue for previously uncompensated care, new volume would be less lucrative, and shifts of enrollment from other forms of coverage into the federal Medicaid plan would cause a larger reduction in hospital revenues.
The draft BBBA would claw back a portion of the windfall to hospitals created by its coverage gap provisions, specifically by reducing Medicaid DSH payments and restricting Medicaid uncompensated care pools. An important question for policymakers as they finalize reconciliation legislation is whether to go further. Allowing hospitals to retain part of this windfall could, in principle, benefit patients by allowing some hospitals, particularly less-resourced hospitals, to continue operating or invest in improving quality. On the other hand, many hospitals might simply accept higher profits or increase their costs in ways that do not meaningfully benefit patients, and recapturing these funds could give policymakers fiscal space to make improvements to the BBBA, such as continuing the legislation’s coverage expansions after 2025.
The remainder of this analysis examines these issues in much greater detail.
Two Approaches to Filling the Medicaid Coverage Gap
This analysis considers two different approaches to filling the Medicaid coverage gap: (1) expanding and enhancing subsidized Marketplace coverage, the approach taken in the draft BBBA; and (2) creating a federal Medicaid plan, the approach taken in an earlier House proposal. As described in detail below, either approach would offer a new subsidized coverage option to people in coverage gap states with incomes below the poverty line and make the coverage available to people with incomes between 100% and 138% of the FPL (who currently rely on the Marketplace) more Medicaid-like.[2]
Expand and Enhance Marketplace Coverage
The draft BBBA would fill the Medicaid coverage gap by extending eligibility for Marketplace subsidies (that is, the premium tax credit and cost-sharing reductions available for Marketplace plans) to people with incomes below the poverty line, who are generally not eligible for subsidized Marketplace coverage at present. (Nothing would change for people in expansion states since being eligible for Medicaid would continue to make a person ineligible for subsidized Marketplace coverage.)
The draft BBBA would also implement a variety of changes to make Marketplace coverage more “Medicaid-like” for all people with incomes below 138% of the FPL. In particular, changes to the premium tax credit would ensure that anyone in this group can enroll in the benchmark silver plan without paying a premium, mirroring the fact that Medicaid typically does not charge premiums.[3] These enrollees would also be eligible for a new, more generous tier of cost-sharing reduction that would offer an actuarial value of 99%, mirroring the nominal cost-sharing allowed in Medicaid, and require plans to cover services like non-emergency medical transportation that are mandatory in Medicaid but not in the Marketplace. They would also be exempt from the premium tax credit “reconciliation” process, which requires people who earn more during a year than they expect when they enroll to pay back part of their tax credit.
The draft bill would also make a variety of changes to the Marketplace enrollment process for these enrollees that would bring this coverage into closer alignment with Medicaid. These enrollees would not be subject to the “firewall” that bars most people offered employer coverage from obtaining subsidized Marketplace coverage. They would also be permitted to enroll in Marketplace coverage at any time during the year, rather than solely during the annual open enrollment period.[4]
Since the coverage made available under these policies would be similar to Medicaid coverage in most salient respects, I assume that this suite of policies would affect insurance coverage and hospital volume (though not the prices hospitals are paid, as discussed below) in a manner similar to existing Medicaid expansions. This assumption allows me to draw on empirical evidence on the effects of existing expansions to estimate how this suite of policies would affect these outcomes.
However, there are plausible arguments for why the effects of these policies could differ from the effects of existing expansions.[5] Notably, the draft BBBA does not provide for “retroactive” coverage of services delivered during a period prior to enrollment, coverage that is typically available in Medicaid. Additionally, because the enrollment process would be administered by the federal government via HealthCare.gov, the provisions in the draft bill would not benefit from any integration with state social service agencies that may exist under Medicaid expansion. On the other hand, under these policies, people in the coverage gap states with incomes above and below 138% of the FPL would be eligible for the same form of subsidized coverage, unlike under Medicaid expansion. This could increase insurance coverage relative to Medicaid expansion by reducing the risk that people who experience income volatility that causes their incomes to rise above or fall below this eligibility threshold experience a loss of coverage.[6]
The coverage gap provisions in the draft would phase in starting in 2022 and continue through 2025.
Create a Federal Medicaid Plan
Earlier draft reconciliation legislation released in September by the House Energy and Commerce Committee took an alternative approach to filling the coverage gap (for years 2025 and later). That draft legislation would have created a Medicaid-like federal program open to people living in Medicaid non-expansion states who would be eligible for Medicaid if their state adopted expansion.
The House draft envisioned that the coverage offered under this “federal Medicaid plan” would closely resemble Medicaid in almost all respects, including benefit design, enrollment rules, and provider payment rates. As such, I assume that this policy would also affect insurance coverage and hospital utilization in a manner similar to existing Medicaid expansions, which again allows me to draw on the evidence base on the effects of Medicaid expansion in estimating the effects of this policy.
As above, there are arguments for why the effect of introducing a federal Medicaid plan could be larger or smaller than the effect of existing expansions. Like a Marketplace-based coverage gap program, a federal Medicaid plan would not benefit from any integration with state social service programs that may exist under expansion. On the other hand, because a federal Medicaid plan would be federally administered, it might reduce the risk of coverage loss among people who experience a change in program eligibility when their incomes rise above or fall below 138% of the FPL (although, unlike a Marketplace-based coverage program, it would not eliminate these transitions entirely).
Policy Baseline
I estimate the effect of each policy option relative to a current law baseline. Notably, that means that the baseline for this analysis does not include an extension of the temporary expansion of the premium tax credit included in the American Rescue Plan (ARP) Act. The effect of the coverage gap policies would likely be modestly smaller if analyzed relative to a baseline in which the ARP tax credit enhancements were extended since those enhancements reduced the premium for the benchmark plan for people with incomes between 100% and 138% of the FPL from just over 2% of income to zero, thereby closing some of the gap between Marketplace coverage and Medicaid coverage for this group.[7]
I also assume that, under current law, no states would adopt (or terminate) expansion through 2023, the year I focus on in my analysis. If states did begin or end expansion, the effect of policies filling the coverage gap would be commensurately larger or smaller. Similarly, I assume that Wisconsin will continue to offer Medicaid coverage to people with incomes below the poverty line through its pre-ACA waiver program. Correspondingly, I simplify the analysis by treating the policies considered here as having no effect in Wisconsin; in reality, they would have some effect with respect to people with incomes between 100% and 138% of the FPL, who currently receive Marketplace coverage in Wisconsin.
Estimating Financial Effects on Hospitals
Filling the Medicaid coverage gap would affect hospital finances in several ways. First, hospitals would now receive payment for some care that they already deliver but are not paid for. Second, hospitals would profit from higher volume as the people who gained coverage sought more care. Third, hospitals would lose revenue as some people switched into the coverage gap program from private plans that paid higher prices. Fourth, some hospitals would lose Medicare DSH payments since payments under the program depend on the overall uninsured rate in the United States and the distribution of uncompensated care across hospitals, both of which would change. In what follows, I summarize how I estimate each of these effects and present my results. The appendix provides additional methodological detail.
Payment for Previously Uncompensated Care
Hospitals deliver a large amount of care for which they receive little or no payment. Much of this care is delivered in emergency situations since federal law requires hospitals to deliver emergency care without regard to the patient’s ability to pay. Under a federal program that filled the Medicaid coverage gap, some currently uncompensated care would become eligible for payment.
To quantify the resulting increase in hospital revenue, I examine trends in uncompensated care costs (as reported on hospitals’ Medicare cost reports) after implementation of Medicaid expansion in 2014, following a large prior literature that has estimated the effect of Medicaid expansion on hospital uncompensated care. Figure 1 replicates the basic finding that emerges from this literature: starting in 2014, the share of hospital expenses consumed by uncompensated care fell sharply in states that expanded Medicaid without declining similarly in states that did not expand Medicaid.
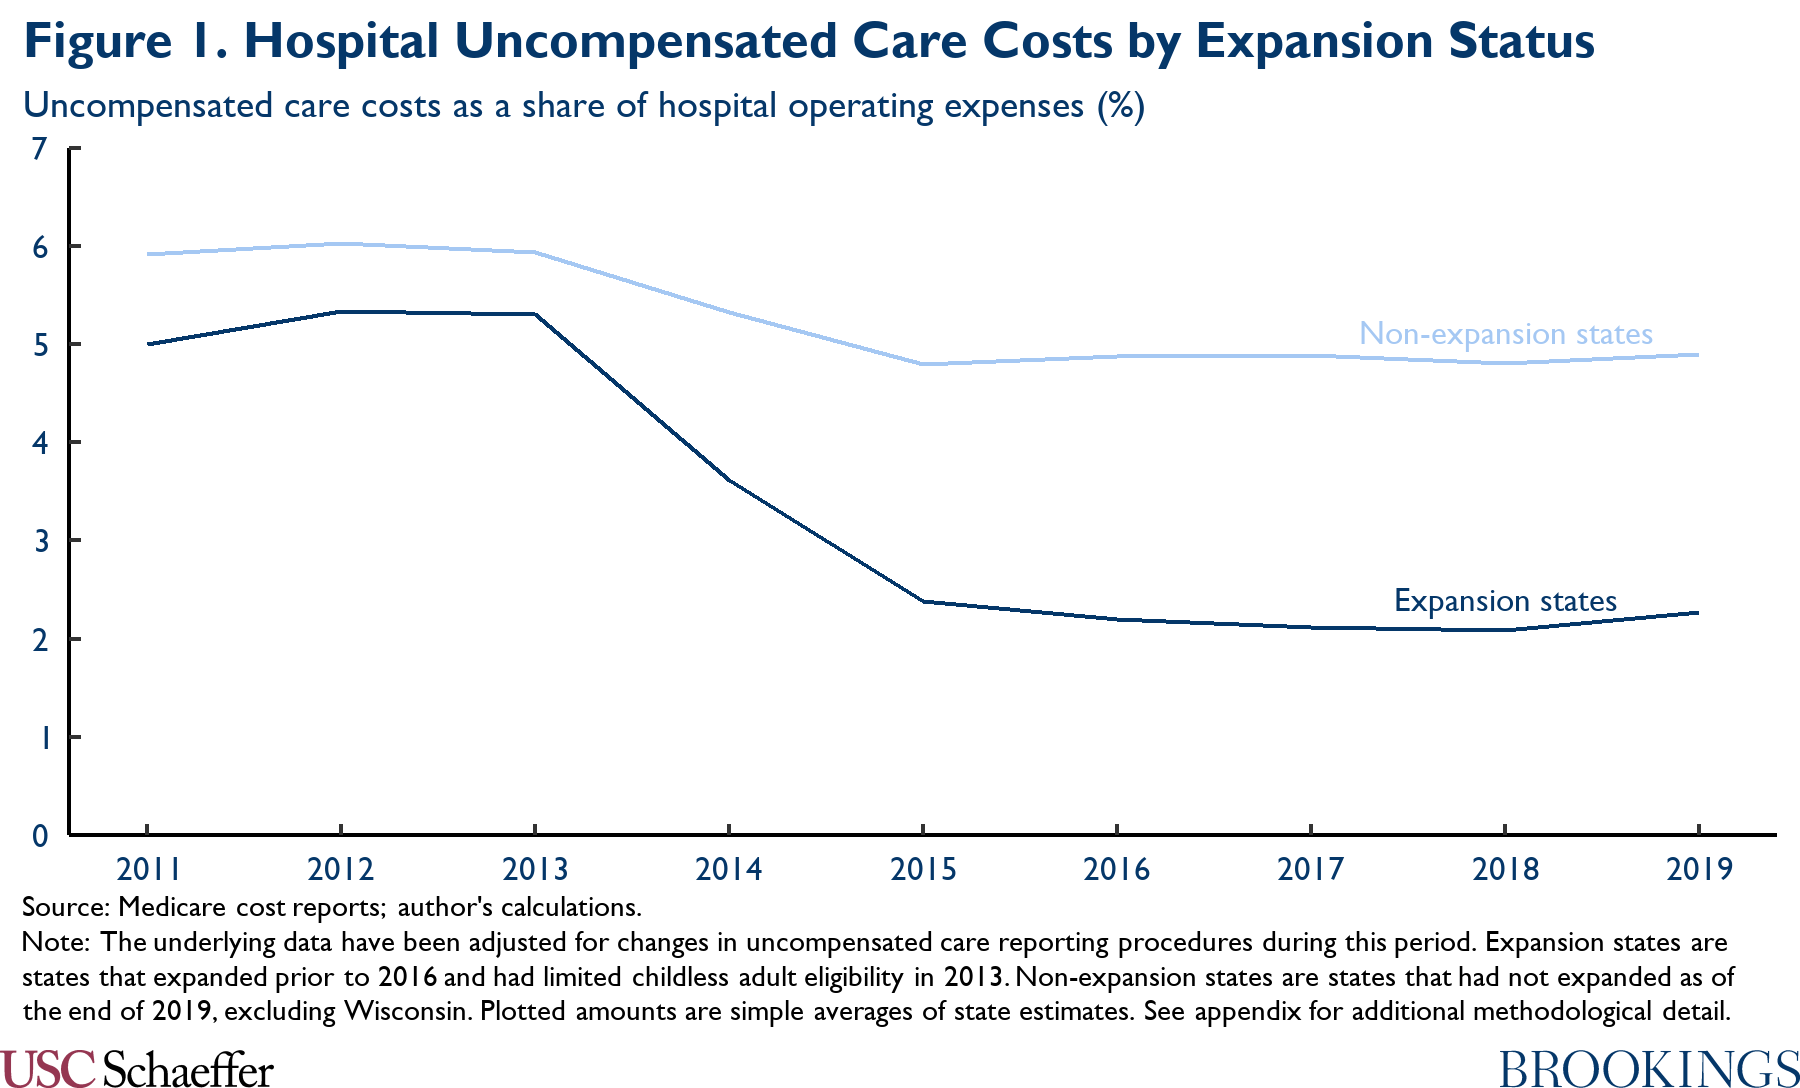
As described in the appendix, I use a difference-in-differences approach to distill the data underlying Figure 1 into state-specific estimates of the causal effect of Medicaid expansion on uncompensated care costs; my approach accounts for the possibility that Medicaid expansion (and the ACA’s other coverage provisions) may have had different effects in states with different baseline characteristics. Using the results, I estimate that the uncompensated care costs reported by hospitals in the coverage gap states would fall by $9.4 billion in 2023 if a coverage gap program were fully in effect in that year.
The ultimate effect on hospitals’ bottom lines would depend on the prices the coverage gap program paid for the previously uncompensated care. I translate the estimated change in reported uncompensated care costs into an estimated effect on hospitals’ bottom lines by multiplying by the ratio of the coverage gap program’s hospital prices to hospitals’ average cost of delivering care.[8]
For the scenario where policymakers fill the coverage gap with a federal Medicaid plan, I assume that the program would pay hospitals prices equivalent to Medicare’s payment rates. As context, research by the Medicaid and CHIP Access and Payment Commission (MACPAC) estimated that Medicaid payments to hospitals averaged 106% of Medicare’s prices, but this amount includes various forms of supplemental payments to hospitals that might not be fully incorporated into payments made by a Medicaid-like federal program.[9] The Medicare Payment Advisory Commission (MedPAC) estimates that Medicare’s prices currently cover 92% of hospitals’ average costs, implying that the reduction in uncompensated care costs would improve hospital margins by $8.6 billion in 2023 in this policy scenario.[10]
For the scenario where policymakers fill the coverage gap by expanding Marketplace coverage, estimating the prices hospitals would receive is more challenging since there are no published estimates of the prices that individual market plans pay for hospital care. As a general matter, it is commonly believed that these prices are higher the prices paid by Medicare and lower than the prices paid by employer-sponsored plans, with the latter belief often attributed to individual market plans’ narrower provider networks.[11]
Consistent with that view, research by Lissenden and colleagues using data that individual market insurers submit for risk adjustment purposes finds that per enrollee claims spending was 29% lower in the individual market than in large employer plans in 2017, after adjusting for health status differences. A portion of that difference likely reflects differences in utilization rather than prices since narrow networks and other features of individual market plans may reduce utilization relative to employer plans (in addition to reducing prices). On the other hand, to the extent that individual market plans are able to negotiate lower prices than employer plans, it is plausible that those price reductions are concentrated in the hospital sector since that is where concerns about provider market power are most acute.
In the absence of better data on this question, I therefore assume that the prices individual market plans pay hospitals are 29% lower than those paid by employer plans. Research generally finds that employer plans pay around twice what Medicare pays for inpatient hospital care and somewhat more than that for outpatient hospital care. Adopting the specific estimates of employer prices presented by Chernew, Hicks, and Shah and weighting inpatient and outpatient care as described in detail in the appendix, I therefore estimate that a Marketplace-based coverage gap program would pay hospitals 149% of what Medicare pays for hospital services, which would cover 137% of hospitals’ average costs. This implies that the reduction in uncompensated care costs would total $12.9 billion in 2023 in this policy scenario.
Profits on New Volume
Research examining Medicaid expansion has generally found that that people who gain health insurance under expansion use more care, and it is likely the same would be true under a program that filled the Medicaid coverage gap. If the coverage gap program paid hospitals more than their (marginal) cost of delivering that care, this increase in volume would translate into higher hospital profits.
To gauge the effect on hospitals’ bottom lines, I begin by examining how state Medicaid expansions have affected hospital utilization. To do so, I use data from the Health Care Cost and Utilization Project, similar to the approach taken by Garthwaite and colleagues. Figure 2 depicts trends in hospital utilization, disaggregated by payer and utilization type. Following expansion, Medicaid expansion states experienced a large (relative) increase in hospital encounters paid for by Medicaid. This gross increase in Medicaid encounters was offset in part, but seemingly not fully, by a substantial relative reduction in uninsured encounters and a smaller relative reduction in privately insured encounters.
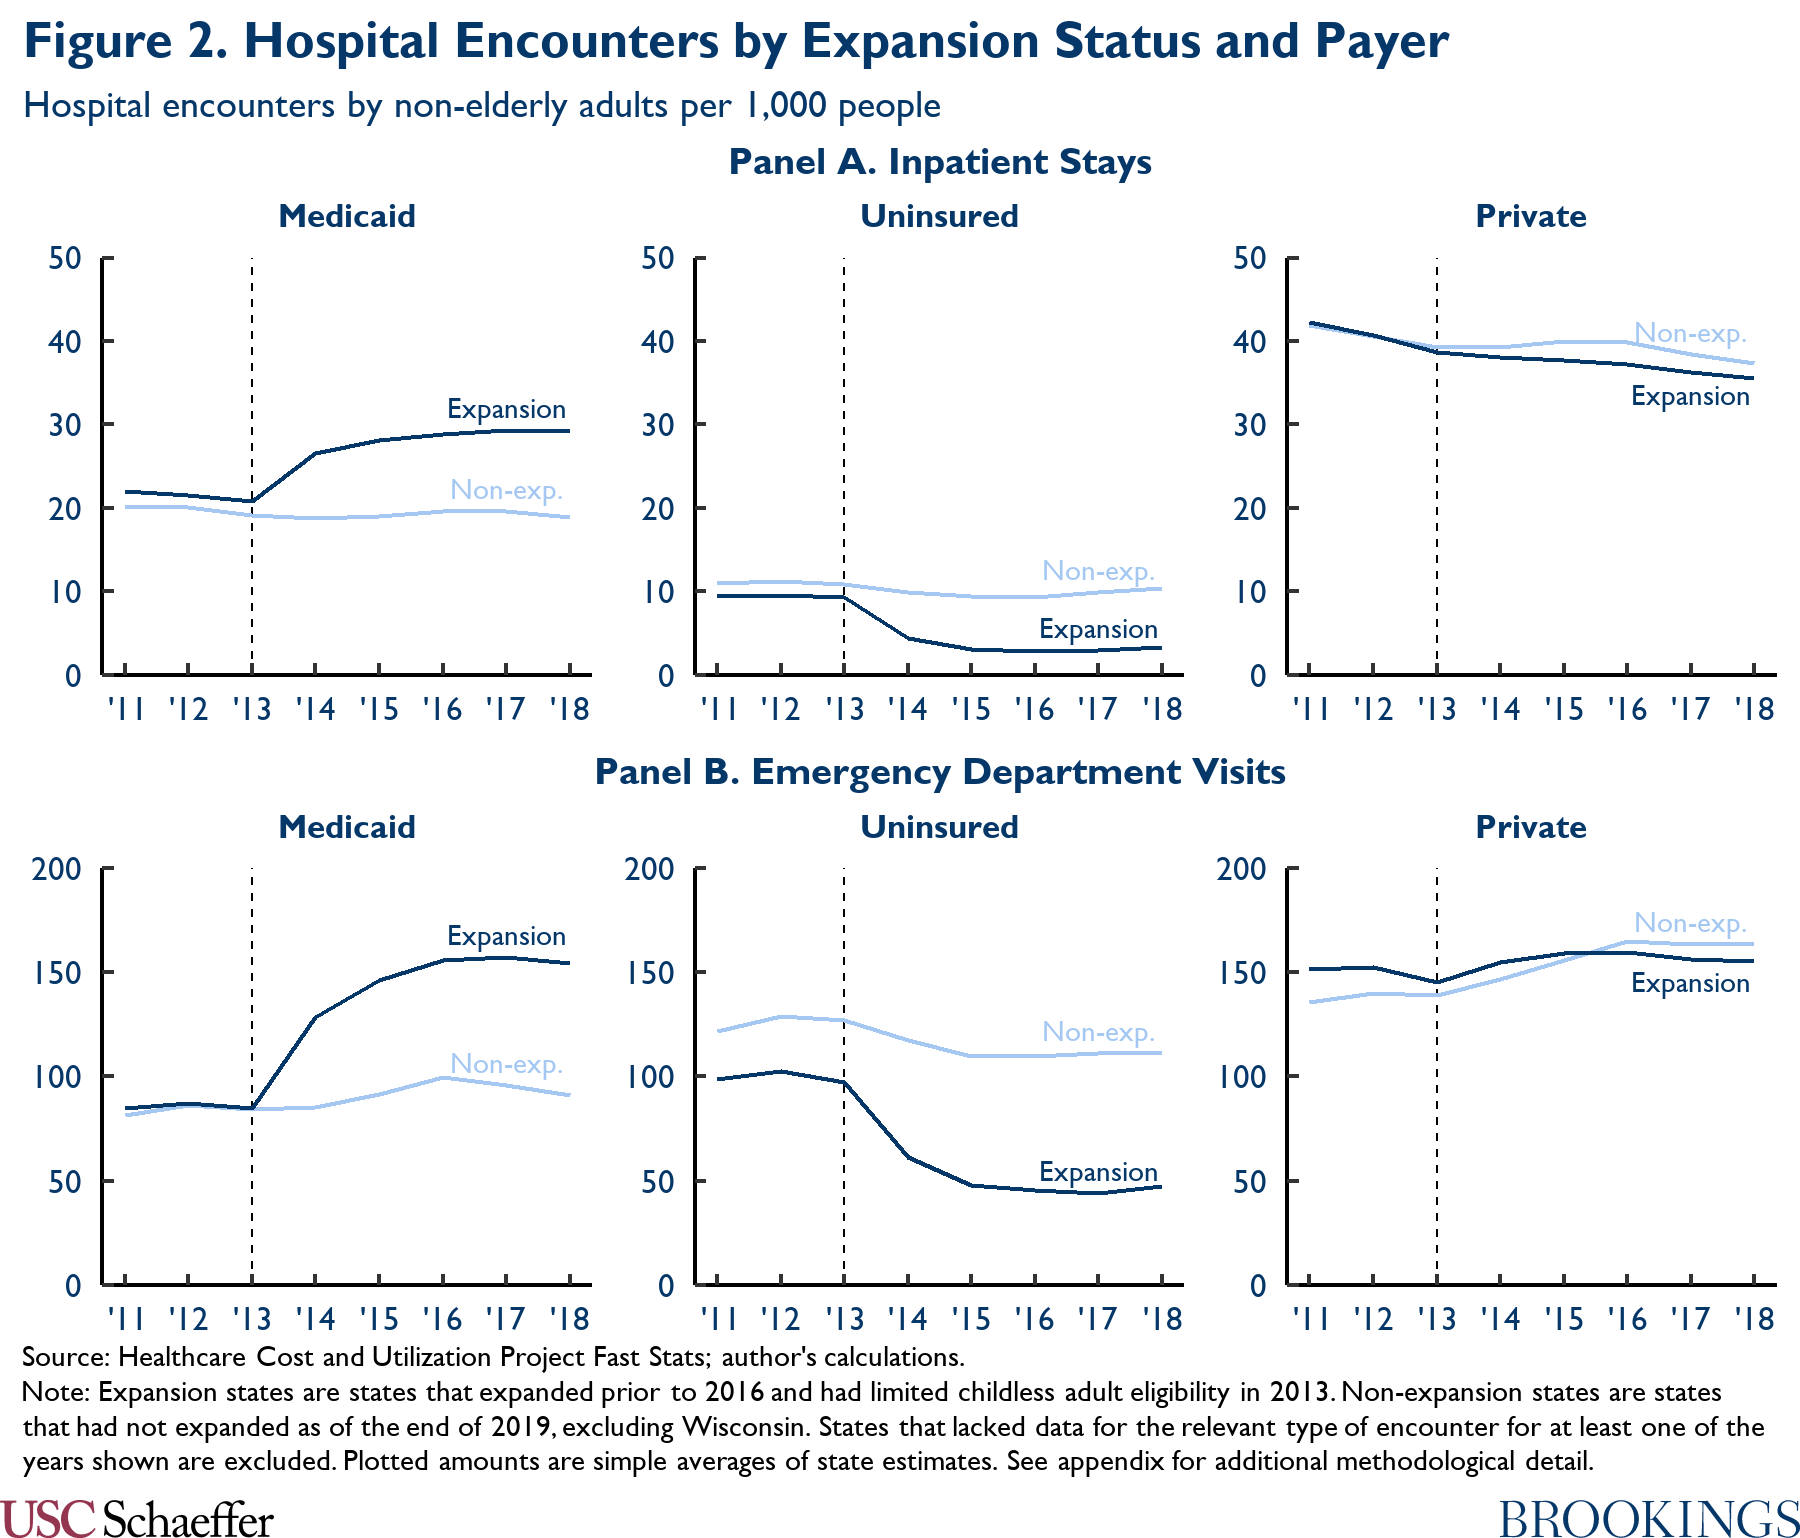
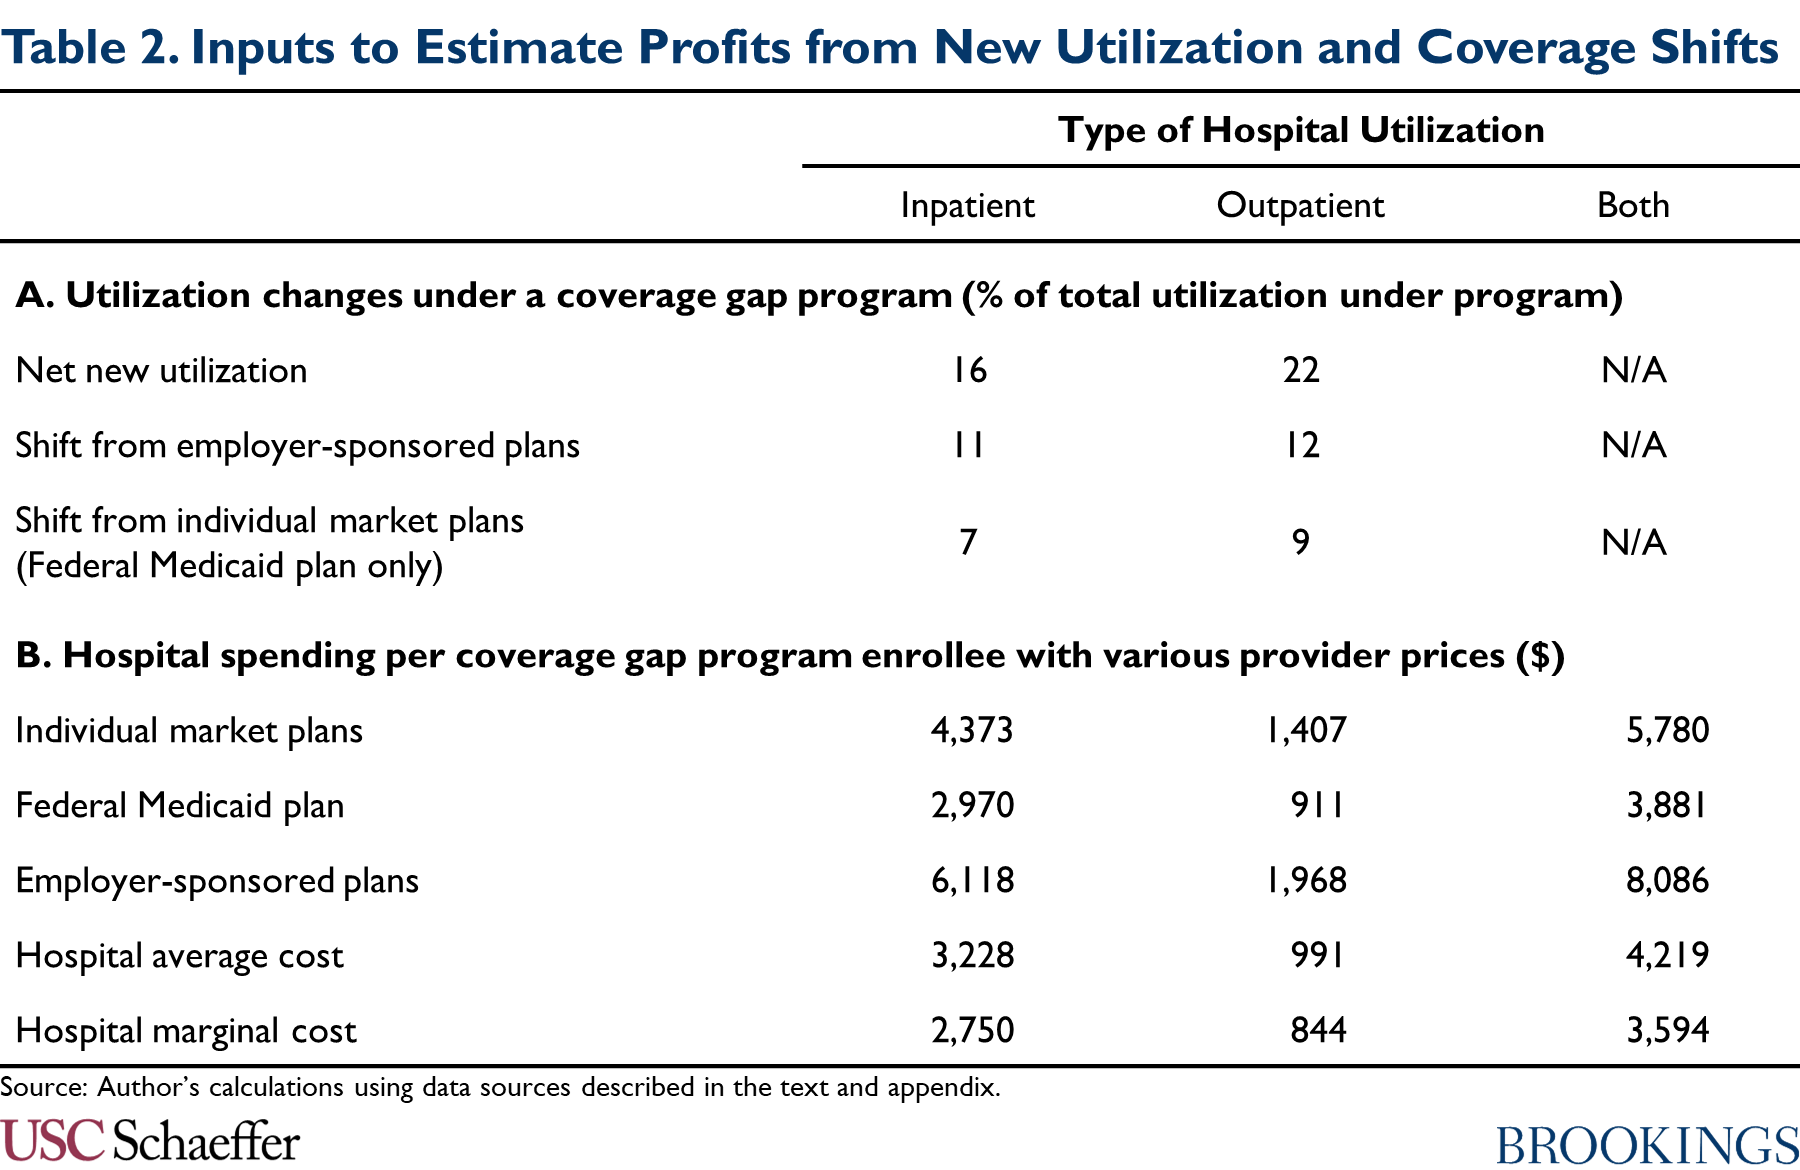
Once again, I use a difference-in-differences approach to distill the data underlying Figure 2 into state-specific estimates of the causal effect of Medicaid expansion on hospital utilization. Using those estimates, I estimate that 16% of inpatient encounters and 22% of emergency department encounters paid for by a coverage gap program would represent net new utilization, as reported in Panel A of Table 2.[12] (In the absence of data on all hospital outpatient utilization, I use the estimate for emergency department encounters as a proxy for the corresponding estimate for hospital outpatient encounters overall.)
To obtain an estimate of the resulting effect on hospitals’ finances, I multiply these shares by an estimate of the difference between: (1) the aggregate amount a coverage gap program would pay for hospital care; and (2) the aggregate (marginal) costs hospitals would incur to deliver that care. I estimate those aggregate amounts by multiplying the revenue hospitals would receive (and the costs they would incur) per person who enrolled in a coverage gap program by an estimate of total program enrollment.
I estimate per enrollee revenue using the following data: CBO projections of benefit spending on Medicaid expansion enrollees; data from MACPAC, the Centers for Medicare and Medicaid Services, and Milliman on how spending is allocated across services; and the estimates of the prices paid by different payers described above. To estimate hospitals’ marginal cost of delivering care, I use MedPAC’s estimates that Medicare’s prices were 8% above hospitals’ marginal cost of delivering services as of 2019. The resulting per enrollee estimates are summarized in Panel B of Table 2. Full details are in the appendix.
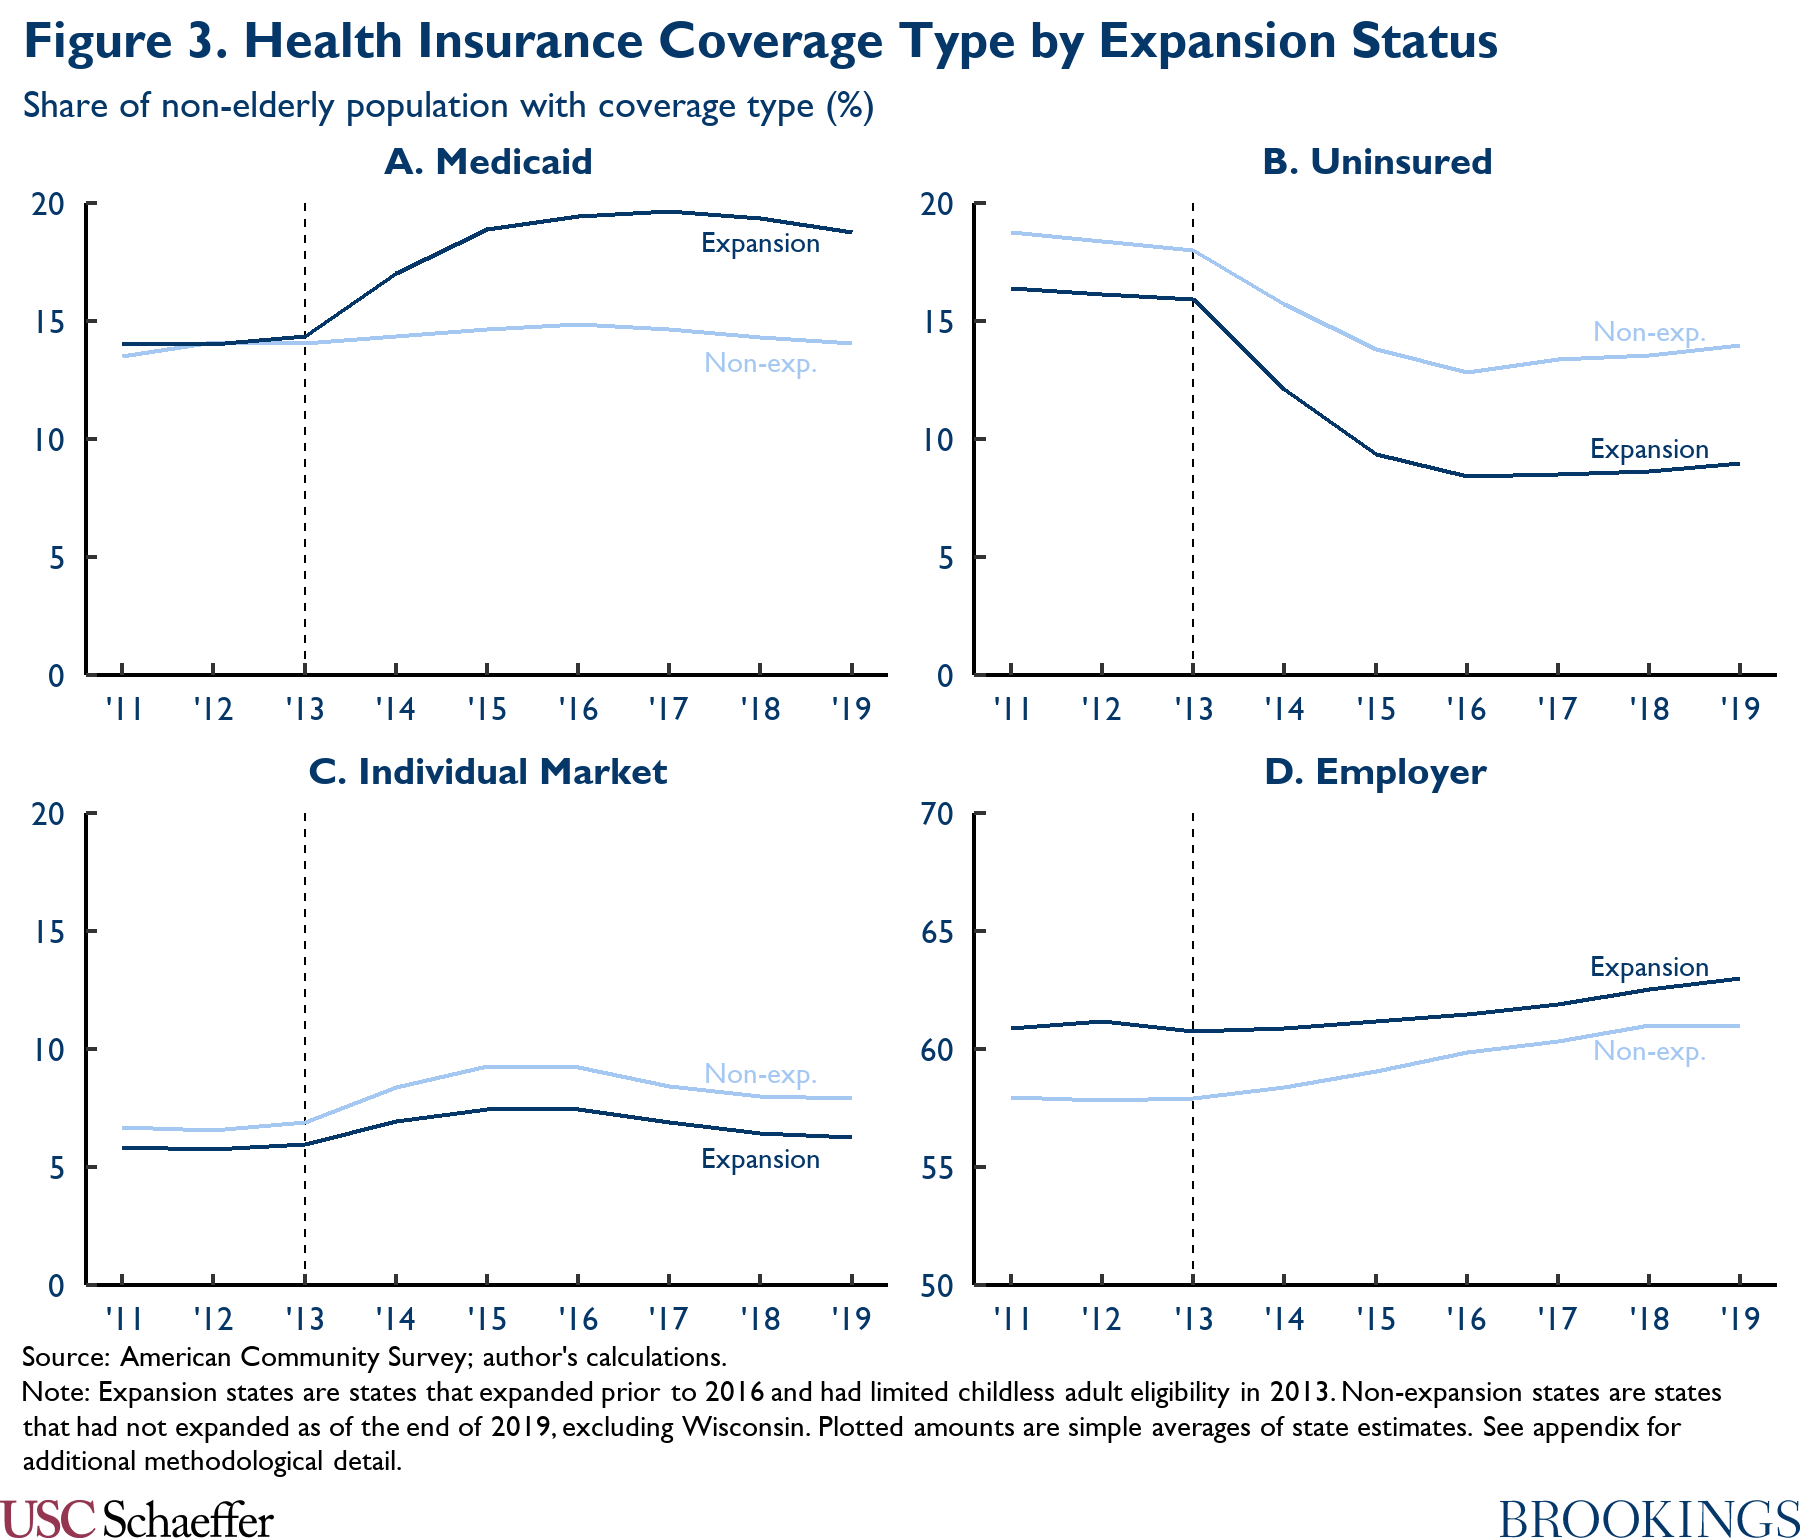
I estimate enrollment in a coverage gap program by comparing trends in Medicaid enrollment between Medicaid expansion and non-expansion states, again following substantial prior literature; these trends are depicted in Panel A of Figure 3. As in other parts of this analysis, I use a difference-in-differences approach to convert the data underlying Figure 3 into state-specific estimates of the causal effect of Medicaid expansion. Using these estimates, I estimate that 5.8 million people would enroll in a coverage gap program, paralleling the large increase in Medicaid enrollment observed following expansion.
In this fashion, I estimate that hospitals’ profits on new volume would amount to $0.3 billion under a federal Medicaid plan and $2.2 billion under a Marketplace-based coverage gap program.
Transitions from Other Forms of Coverage to a Coverage Gap Program
A portion of the services paid for by a coverage gap program would likely be services that are currently paid for by private insurance plans. That would occur for two main reasons. First, some people who currently have employer-sponsored plans would likely opt for the coverage gap program instead because it offered lower premiums and out-of-pocket costs. Second, in the case of a federal Medicaid plan, people with incomes between 100% and 138% of the FPL who are currently enrolled in subsidized Marketplace coverage would become eligible for the federal Medicaid plan instead. To the extent that a coverage gap program paid providers less than the plans enrollees shifted out of, hospital revenues would fall.[13]
To estimate the effect on hospital finances, I first estimate how much utilization would shift out of other forms of coverage. As above, I use a difference-in-differences approach to distill the data underlying Figure 2 into state-specific estimates of the causal effect of Medicaid expansion on hospital utilization by payer.[14] Applying those estimates to a coverage gap program, I estimate that shifts out of employer-sponsored coverage would account for 11% of inpatient utilization and 12% of emergency department utilization under a coverage gap program, as reported in Panel A of Table 2. Under a federal Medicaid plan, I estimate that utilization that shifted out of individual market plans would account for an additional 7% of inpatient utilization and 9% of emergency department utilization under the plan.
To obtain an estimate of the effect on hospital finances, I multiply these shares by an estimate of the difference between the aggregate amount a coverage gap program would pay for hospital care and the aggregate amount that would be paid with alternative provider prices (either individual or employer market prices depending on the type of shifting involved). I calculate those aggregate estimates using the estimates of per enrollee hospital spending in Panel B of Table 2 and the estimate of total enrollment in a coverage gap program reported in the last section. Using this approach, I estimate that hospitals would lose $1.5 billion through these types of coverage shifts under a Marketplace-based coverage gap program and a larger $3.7 billion through this channel from creation of a federal Medicaid plan.
Automatic Changes in Medicare DSH Payments
Medicare makes disproportionate share hospital (DSH) payments to hospitals that are intended to offset hospitals’ uncompensated care costs. Most of those payments are now set using a formula established in the ACA.[15] That formula establishes an aggregate national payment pool that scales up and down proportionally with the national uninsured rate and allocates the pool across hospitals in proportion to each hospital’s uncompensated care costs (as reflected on Medicare cost reports). Because filling the Medicaid coverage gap would reduce the national uninsured rate and uncompensated care costs in the coverage gap states, it would change the total amount and distribution of these DSH payments.
To estimate these effects, I begin by estimating the total amount of Medicare DSH payments that will be allocated based on uncompensated care costs under current law; based on the pool established for fiscal year 2022, I estimate this amount at $7.9 billion in calendar year 2023.[16] Using the estimates of how filling the coverage gap would affect insurance coverage described above (and described further in the appendix), I estimate that a policy filling the coverage gap would reduce the national uninsured rate by 12% if fully in effect for 2023 and thus reduce this national pool of DSH payments by $1.0 billion.
To estimate how this change would be distributed across hospitals, I use the estimates of how filling the coverage gap would affect hospitals’ uncompensated care costs that were described above to estimate aggregate uncompensated care costs in each state in 2023 under current law and under these policies. Under this approach, I estimate that hospitals in the coverage gap states would receive $1.7 billion less in Medicare DSH payments in 2023 if the coverage gap policies were fully in effect than under current law. By contrast, hospitals in other states would receive $0.7 billion in additional DSH payments. This occurs because the reduction in uncompensated care in the coverage gap states would increase the share of uncompensated care accounted for by the expansion states, which would more than offset the reduction in the size of the national pool of uncompensated-care-based DSH payments.
I note that states also make payments designed to offset uncompensated care costs, including through the Medicaid DSH program and through uncompensated care pools set up under Medicaid waivers. If implementation of a coverage gap program caused states to reduce those payments, that could also reduce hospital revenues. I exclude those reductions here because implementing them would generally require states to implement additional policy changes. Additionally, states may be less likely to make these types of cutbacks if federal policymakers take steps to claw back all or part of the benefits to hospitals from filling the coverage gap, so the estimates presented here may be a better estimate of the total amount that federal policymakers could recapture from hospitals without leaving them worse off.
A Note on Alternative Estimation Approaches
In this analysis, I estimate the effect of a coverage gap program on hospital finances by explicitly specifying the channels through which a coverage gap program would affect hospitals and then estimating the effects that would arise through each channel. An alternative approach would be to directly estimate the effect that prior Medicaid expansions have had on hospital profit margins (presumably using difference-in-differences methods similar to those I use in the rest of this analysis). This “direct” approach has some potential advantages relative to my “disaggregated” approach: it avoids the risk that I might fail to consider an important channel through which a coverage gap program would affect hospitals or that I might incorrectly estimate the effects that would arise through one of the channels that I do consider. Both of these risks are important sources of uncertainty in the estimates I present here.
However, the disaggregated approach I use here has important advantages that, in my view, outweigh the potential advantages of the direct approach. First, my goal is to estimate how much space there is for policymakers to reduce other payments to hospitals without leaving hospitals worse off than they would be in the absence of a coverage gap program. For that reason, my goal is to estimate the “shock” to hospital finances from filling the coverage gap—excluding any changes hospitals make to their operations in response to that shock. By contrast, the direct approach estimates the realized change in hospital margins caused by Medicaid expansion, and, thus, incorporates the effect of any such operational changes. In particular, if positive financial shocks cause hospitals to increase their operating costs, then the realized change in hospital margins would underestimate the initial positive shock.
Second, the disaggregated approach I take here makes it straightforward to account for ways in which a coverage gap program might differ from Medicaid expansion. In particular, it allows me to easily account for the fact that a Marketplace-based coverage gap program would likely pay prices well above Medicaid prices and, thus, have a more positive effect on hospitals’ financial position than Medicaid expansion. Related, a disaggregated approach makes it clearer how effects on hospital margins would arise.
Third, the evolution of hospital margins is influenced by many factors other than Medicaid expansion, notably including changes in the commercial pricing environment and changes in input costs. The effects of these factors are potentially large relative to the effect of Medicaid expansion, which creates “background noise” that reduces the precision of estimates obtained from the direct approach and opens the door to various forms of bias. By contrast, by building up the overall effect on hospital margins from estimates of the effect on outcomes where the influence of Medicaid expansion is larger in relation to the background noise, my disaggregated approach is less vulnerable (albeit not immune) to this concern.
Regardless, my estimates appear to be broadly compatible with prior research that has used difference-in-differences methods to directly estimate how Medicaid expansion affected realized hospital margins. Notably, Moghtaderi and colleagues estimate that expansion improved the margins of expansion state hospitals by 0.5 percentage points, with a 95% confidence interval that extends from -0.5 percentage points to 1.5 percentage points.[17] For comparison, I estimate that creation of a federal Medicaid plan would result in a $3.6 billion positive shock to hospital margins if fully in effect in 2023, which translates to 1.1% of projected aggregate patient revenue in the coverage gap states in that year.[18]
Conclusion
This analysis estimates that filling the Medicaid coverage gap would meaningfully improve the finances of hospitals in the coverage gap states. I estimate that hospital margins would improve by $11.9 billion relative to current law if the Marketplace-based coverage gap program envisioned in the draft BBBA were fully in effect in 2023. The improvement in hospital margins would be smaller, but still substantial—$3.6 billion—if policymakers created a federal Medicaid plan, as envisioned in earlier House proposals.
An important question for policymakers as they work to finalize reconciliation legislation is whether they should try to recapture all or part of these benefits to hospitals. Allowing hospitals to retain this windfall could, in principle, benefit patients by allowing some hospitals, particularly less resourced hospitals, to continue operating or to make investments that improved quality of care. On the other hand, many hospitals might simply accept higher profits or increase their costs in ways that do not meaningfully benefit patients, and recapturing some of the benefits to hospitals could give policymakers fiscal space to make improvements to the BBBA, such as continuing the legislation’s coverage provisions past 2025.
The draft BBBA already contains some provisions aimed at clawing back some of the financial benefits to hospitals. Starting in fiscal year 2023, the bill reduces Medicaid DSH allotments by 12.5% in non-expansion states; the resulting reduction in federal funding for Medicaid DSH payments would start at around $400 million per year and rise gradually over time.[19] The draft bill also imposes some limits on the scope of uncompensated care pools funded via Medicaid waivers non-expansion states. Estimating the impact of those provisions is beyond the scope of this analysis; however, the total amount of federal funding for existing uncompensated care pools is on track to total only around $4.4 billion per year, which provides an upper bound on the potential reduction in federal funding from this provision.[20],[21]
It thus seems clear that there is room to claw back more money from hospitals in the coverage gap states without leaving them worse off than they would be without legislation filling the coverage gap. If policymakers wanted to go further in this direction, there are natural options for doing so. For example, they could implement larger reductions in Medicaid DSH payments in the coverage gap states or more tightly limit Medicaid uncompensated care pools. They could also consider reducing Medicare DSH payments in the coverage gap states. Even after the automatic reductions in Medicare DSH payments described above, I estimate that Medicare will still make $3.0 billion in uncompensated-care-based DSH payments to hospitals in the coverage gap states in 2023, with similar payments in later years.
Methodological Appendix
Footnotes:
[1] Throughout, I use the term “coverage gap states” to refer to the twelve non-expansion states other than Wisconsin. Wisconsin has not adopted Medicaid expansion, but offers Medicaid coverage to people with incomes below the poverty line through a pre-ACA waiver program, so coverage gap policies would have somewhat different—and generally smaller—effects in Wisconsin than in the other non-expansion states.
[2] Both proposals also include provisions designed to dissuade existing expansion states from ending their expansions. While a detailed analysis of those provisions is beyond the scope of this piece, I do assume that these provisions would be effective, so neither policy would have direct effects in the current expansion states.
[3] For the purposes of this analysis, I consider only the increase in the generosity of the premium tax credit that applies to people with incomes below 138% of the FPL, not the broader increases included in the draft BBBA.
[4] The administration recently made an administrative change that allows people eligible for zero-premium benchmark silver plans to enroll at any time during the year. The provision in the draft BBBA provision would, in effect, codify that policy with respect to the coverage gap population.
[5] There are also plausible arguments that the effect of Medicaid expansion could be smaller in the coverage gap states since those states might erect larger administrative barriers to enrollment. Because federal coverage gap programs would not depend on state cooperation, this would not affect the applicability of evidence from existing Medicaid expansions. However, this line of argument does suggest that a federal coverage gap program could have larger effects on the outcomes of interest than Medicaid expansion in these states.
[6] Medicaid expansion itself could be less effective in the coverage gap states than in other states since those states appear to be less motivated to expand coverage. This raises the possibility that experience with Medicaid expansion in other states could overstate the effect of Medicaid expansion in the coverage gap states and also that federal programs targeted at the coverage gap population (including both the draft BBBA proposals and a federal Medicaid plan) could have larger effects relative to Medicaid expansion in the coverage gap states.
[7] While the comparison to a current law baseline is of interest in its own right, one analytic advantage of focusing on this baseline is that the baseline policy environment closely resembles the one that existed when most existing data were collected and when most existing Medicaid expansions were implemented. This makes it more straightforward to apply experience from the historical period to analyze the effect of the coverage gap policies.
[8] This calculation would be exactly correct if reported uncompensated care costs solely reflected the cost of delivering care to uninsured patients—and those patients made no payment at all for that care. In reality, reported uncompensated care costs net out partial payments from uninsured patients and additionally include cost-sharing obligations of insured patients that a hospital is unable to collect. The appendix considers this and related complications and concludes that these issues may engender a downward bias in my estimate of the improvement in hospital finances, but that this bias is likely relatively slight, less than $1 billion under either form of coverage gap program. Thus, I retain the simplified calculation in the main text for ease of exposition.
[9] In particular, some of these payments are intended to defray a portion of hospitals’ uncompensated care costs rather than compensate hospitals for treating Medicaid enrollees. Policymakers might not see the need to expand the latter type of payments in the context of a program filling the Medicaid coverage gap.
[10] As a cross-check on this estimate, I also estimated how much revenue hospitals would receive for care being delivered to people who are currently uninsured using the data on hospital volume by payer considered later in this analysis. Under that approach, I estimated that hospitals would receive $14.4 billion for this care under a federal Medicaid plan and $21.4 billion under a Marketplace-based coverage gap program. Because those estimates do not net out any amounts hospitals are able to collect for care delivered to these uninsured patients (either from the patients themselves or from sources like indigent care programs), they are not directly comparable to the estimates that I derive based on reported uncompensated care costs. Taking account of that difference, however, these estimates are broadly compatible with the uncompensated-care-based estimates.
[11] Features of the individual market other than differences in network breadth may also affect prices. Notably, enrollees may be more sensitive to premium differences, which may in turn increase insurers’ leverage when bargaining with providers, even holding a plan’s network characteristics fixed.
[12] Throughout, when I refer to services paid for by a coverage gap program or enrollment in such a program, I include people with incomes between 100 and 138% of the FPL who already receive Marketplace subsidies.
[13] Some patients might also transition from having their care paid for by state or local indigent care programs into a coverage gap program. Those transitions are not captured here, but at least in the case of a Marketplace-based coverage gap program, they would likely generate some additional financial benefit to hospitals.
[14]The data underlying Figure 2 do not disaggregate utilization in individual market and employer-sponsored coverage. As described in the appendix, I use estimates of the effect of Medicaid expansion on each form of coverage to split apart the overall change in private insurance utilization into its constituent components.
[15] Medicare also makes some DSH payments using a pre-ACA formula based on how many Medicaid and Supplemental Security Income enrollees the hospital treats. Payments under the pre-ACA formula are also one of the inputs used to determine the national pool of uncompensated-care-based DSH payments. I assume that people enrolled in a federal Medicaid plan would not be considered Medicaid enrollees for Medicare DSH purposes, so neither policy considered here would affect Medicare DSH payments under the pre-ACA formula.
[16] The final rule setting Inpatient Prospective Payment System payment policies for federal fiscal year 2022 establishes an aggregate uncompensated care DSH payment pool of $7.2 billion. I trend that amount forward to fiscal years 2023 and 2024 using the March 2020 National Health Expenditure projections of Medicare hospital spending, and I then take a 25/75 weighted average of those amounts to get a calendar year 2023 estimate.
[17] Other studies estimate larger (and statistically significant) positive effects on hospital margins. As Moghtaderi and colleagues note, however, the other studies in this literature have generally weighted all hospitals equally, rather than assigning greater weight to larger hospitals. Since all of these studies agree that Medicaid expansion had larger positive effects on smaller hospitals, studies that use equal weighting may overstate the positive effect on aggregate hospital margins, which is what I aim to estimate here.
[18] To estimate aggregate patient revenue in these states in 2023, I begin with an estimate of this amount as of 2019 derived from hospital cost reports. I then trend this amount forward to 2023 using the National Health Expenditure projections of cumulative growth in aggregate hospital spending from 2019 to 2023.
[19] Total Medicaid DSH allotments for non-expansion states, as published by MACPAC, are $3.3 billion for fiscal year 2022, of which 12.5% is $407 million. Under current law, aggregate national Medicaid DSH allotments will be reduced by $8 billion relative to the basic Medicaid DSH formula in fiscal years 2024-2027. But the language in the draft BBBA appears to be intended to calculate this additional reduction without regard to those reductions, so this $407 million estimate is likely a reasonable guide to the effect of the draft BBBA provision in futures years. In any case, the nationwide reductions have been repeatedly delayed by Congress and may never take effect.
[20] These pools currently exist in Florida, Kansas, Tennessee, and Texas. I obtained information on the total size of each state’s pool from the terms and conditions governing its waiver. For Florida, Kansas, and Tennessee, I used the approved amounts for the first year that extends into fiscal year 2023. For Texas, I used the amount currently in effect since amounts for later years have not been determined. I determined federal funding for each state’s pool by projecting forward each state’s federal share for fiscal year 2022, excluding the 6.2 percentage point increase in the federal share in effect under the Families First Coronavirus Response Act.
[21] In principle, the reduction in payments to hospitals under these arrangements could exceed the reduction in federal funding if states reduced their contributions to these programs. However, in the case of the uncompensated care pools in particular, the state’s notional contribution to these programs is often ultimately provided by the hospitals themselves, so the scope for this to occur is limited or non-existent.

Disclosures: The Brookings Institution is financed through the support of a diverse array of foundations, corporations, governments, individuals, as well as an endowment. A list of donors can be found in our annual reports published online here. The findings, interpretations, and conclusions in this report are solely those of its author(s) and are not influenced by any donation.
Acknowledgments: I thank Loren Adler and Richard Frank for helpful comments on a draft of this piece. I thank Kathleen Hannick and Conrad Milhaupt for excellent research assistance. All errors are my own.