

Editor’s Note: This analysis is part of the USC-Brookings Schaeffer Initiative for Health Policy, which is a partnership between Economic Studies at Brookings and the University of Southern California Schaeffer Center for Health Policy & Economics. The Initiative aims to inform the national health care debate with rigorous, evidence-based analysis leading to practical recommendations using the collaborative strengths of USC and Brookings. This work was supported by a grant from the Robert Wood Johnson Foundation. This piece was edited on September 14, 2022 to correct the effective date of a regulation and an associated hyperlink.
There is considerable empirical evidence that requiring consumers to pay even very small health insurance premiums—as little as a few dollars per month (or less)—can meaningfully reduce enrollment. This is likely because remitting a premium involves significant cognitive and hassle costs, which can cause enrollees to miss payments—and thus lose coverage—even when a premium imposes a minimal financial burden. In light of this evidence, this analysis examines how many Health Insurance Marketplace enrollees currently pay very small premiums, how policymakers could eliminate those premiums if they wished to do so, and how those steps would affect insurance coverage, federal costs, and other outcomes of interest.
In brief, I estimate that 404,000 Marketplace enrollees in the states served by HealthCare.gov currently owe a small positive premium (defined as a positive premium of less than 0.5% of the gross premium of the enrollee’s plan, which translates to around $3 per month on average). About three-fifths of these cases result from special rules that govern how the premium tax credit applies to plans that include benefits that are not considered essential health benefits (EHB);[1] the premium tax credit cannot be used to pay the part of a plan’s premium attributable to non-EHB benefits, and these amounts are excluded when calculating the “benchmark” premium that determines the credit’s value. These quirks of the credit’s design cause some enrollees to owe a small premium that exclusively covers the cost of their plan’s non-EHB benefits, a scenario highlighted in prior work. In other cases, enrollees owe small positive premiums simply because their plan’s premium is slightly larger than their tax credit.
Around three-fifths of enrollees who owe small positive premiums have incomes at or below 150% of the federal poverty level (FPL), which reflects the fact that higher-income enrollees are eligible for smaller tax credits and, as such, have fewer plans with zero or near-zero premiums available to them. Closely related, I estimate that small positive premiums will become much rarer if Congress allows the premium tax credit enhancements included in the American Rescue Plan Act to lapse, as many enrollees who currently pay small positive premiums will instead owe larger premiums. On the other hand, small positive premiums would become much more common if Congress extended eligibility for the premium tax credit to people in the Medicaid coverage gap, as proposed in the House-passed Build Back Better Act, since this step would greatly increase Marketplace enrollment below 150% of the FPL.
As a normative matter, eliminating these small positive premiums is likely desirable as long as increasing insurance coverage in this group is desirable (in the sense that the benefits of covering these enrollees outweigh the fiscal cost of subsidizing their coverage). If policymakers wished to eliminate these premiums, one option would be to increase the premium tax credit to cover an enrollee’s full premium in cases where the enrollee would otherwise owe a small residual premium (e.g., a premium of less than 0.5% of the plan’s gross premium). I estimate that this approach would have increased insurance coverage in the HealthCare.gov states by 48,000 person-years in 2022 at a federal cost of $336 million.
Alternatively, policymakers could allow or require insurers to treat payment of a large enough fraction of the plan’s premium (e.g., 99.5% of the gross premium) as payment in full. Unlike modifying the premium tax credit, it is likely that at least some versions of this approach could be implemented administratively. However, it is unclear how many insurers would actually choose to waive small positive premiums if allowed but not required to do so, and all versions of this approach would do less to reduce administrative hassles for enrollees and insurers than simply increasing the premium tax credit to cover small residual premiums. I also consider certain narrower policy changes that would have more limited effects on the prevalence of small positive premiums. Finally, while my focus in this analysis is on steps that could be taken by federal policymakers, I note that essentially all of the policy options considered in this analysis could be implemented by individual states that operate their own Marketplaces.
The remainder of this analysis examines these issues in greater detail.
Premium tax credit background
To set the stage, I first review how the premium tax credit is calculated. The credit equals a “benchmark” premium, typically the premium of the second-lowest-cost silver plan available to the enrollee, minus an enrollee contribution that varies with family size and family income (subject to the constraint that an enrollee’s credit cannot exceed the premium of the enrollee’s chosen plan).[2] Figure 1 illustrates the calculation of the tax credit for a single enrollee with a $500 benchmark premium in 2022.
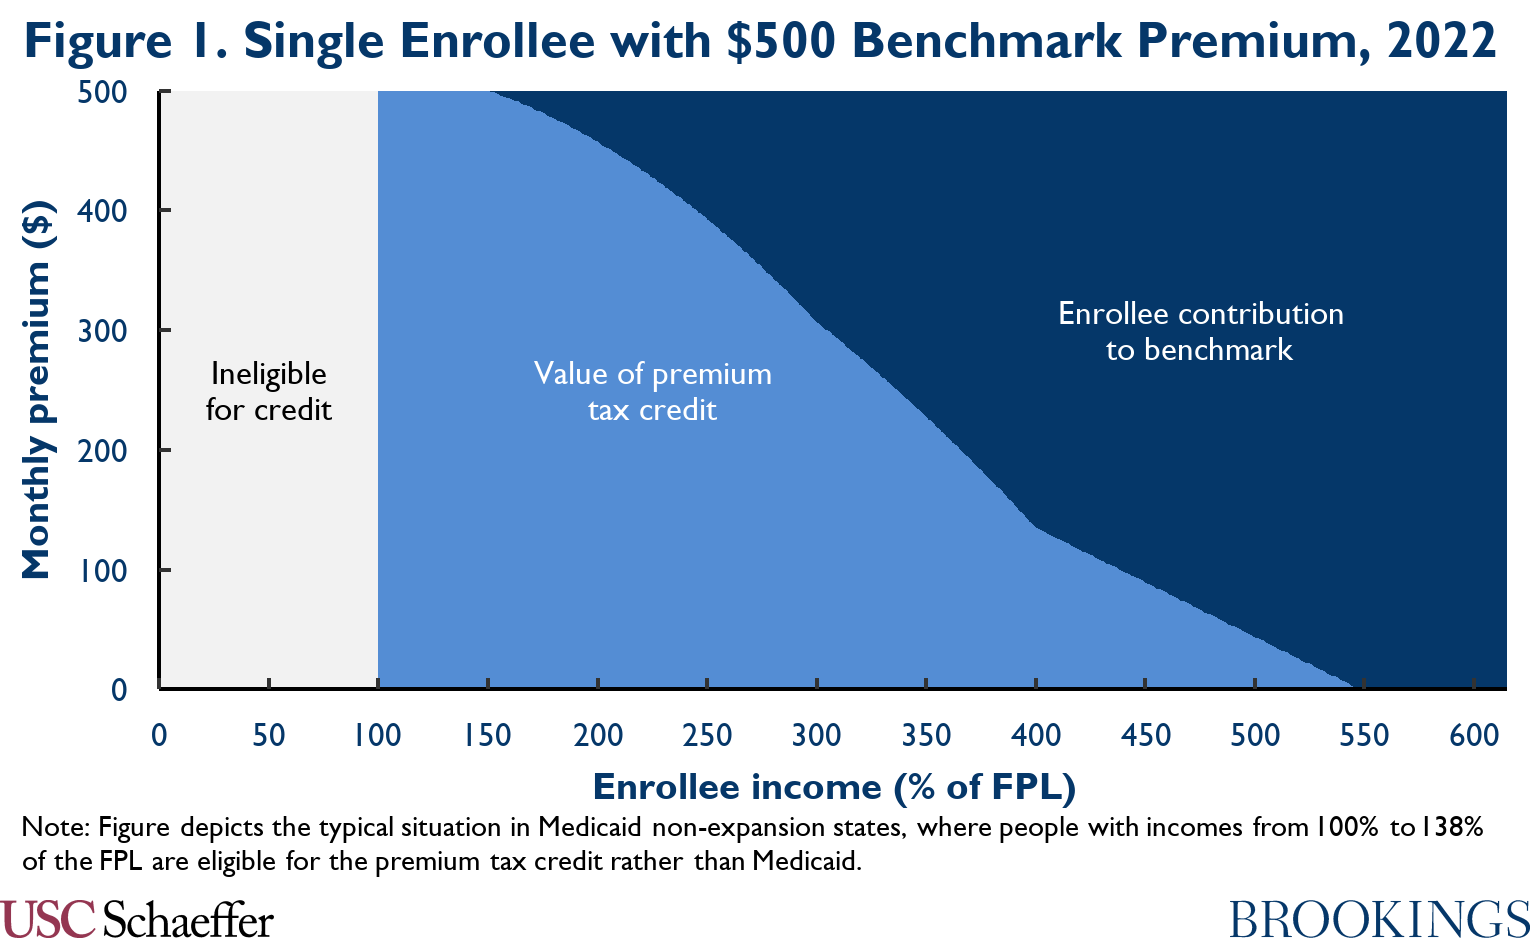
At present, the enrollee contribution is determined according to parameters established by the American Rescue Plan (ARP) Act for 2021 and 2022; one notable feature of that contribution schedule is that the enrollee contribution is zero for enrollees with incomes at or below 150% of the FPL. Prior to the ARP, enrollee contributions were larger. Those larger enrollee contributions will return in 2023 if Congress does not pass new legislation extending the ARP subsidy schedule.
Importantly for this analysis, special rules apply when plans include benefits that are not considered essential health benefits (EHB). In particular, the tax credit cannot be used to pay for non-EHB portions of a plan’s premium, even if an enrollee has tax credit dollars “left over” after paying for the EHB portion of the premium.[3] Additionally, portions of plans’ premiums that are attributable to non-EHB benefits are excluded when calculating the benchmark premium, so the benchmark premium is sometimes lower than the full premium of the second-lowest-cost silver plan available to an enrollee.
In practice, the types of non-EHB benefits included in Marketplace plans vary widely. Among current plans on HealthCare.gov with some premium attributable to non-EHB benefits, a majority offer some non-EHB dental and vision coverage.[4] Other common examples of covered non-EHB services include certain behavioral health, foot care, nutritional counseling, fertility, and abortion services. In some cases, state law requires plans to offer non-EHB benefits, while in other cases plans offer these benefits voluntarily.
Under these rules, there are two basic ways that an enrollee can owe a small positive premium. One is to buy a plan with a premium slightly larger than her tax credit. The other is to purchase a plan that has a premium equal to or smaller than her tax credit but that includes some non-EHB benefits.
Estimating the prevalence of small positive Marketplace premiums
I now turn to estimating how many Marketplace enrollees currently owe small positive premiums. Ideally, this type of analysis would use enrollee-level microdata that reported which plan each enrollee selected and the data needed to compute the enrollee’s premium tax credit: location, income, and family structure. Unfortunately, the Centers for Medicare and Medicaid Services (CMS) does not publish these data.
Instead, I rely on CMS tabulations of enrollment by county, income, age, and metal level, as well as data on how many enrollees owe premiums of $10 per month or less (either zero or non-zero). As described in the appendix, I use these data to produce a population of “synthetic” Marketplace enrollees that is likely to mirror the actual Marketplace population along the dimensions that matter most for this analysis. That synthetic population can then be used to produce the estimates presented below. Producing this synthetic population necessarily involves making some assumptions and strategic simplifications, which are fully described in the appendix, but any resulting biases are unlikely to affect my qualitative findings.
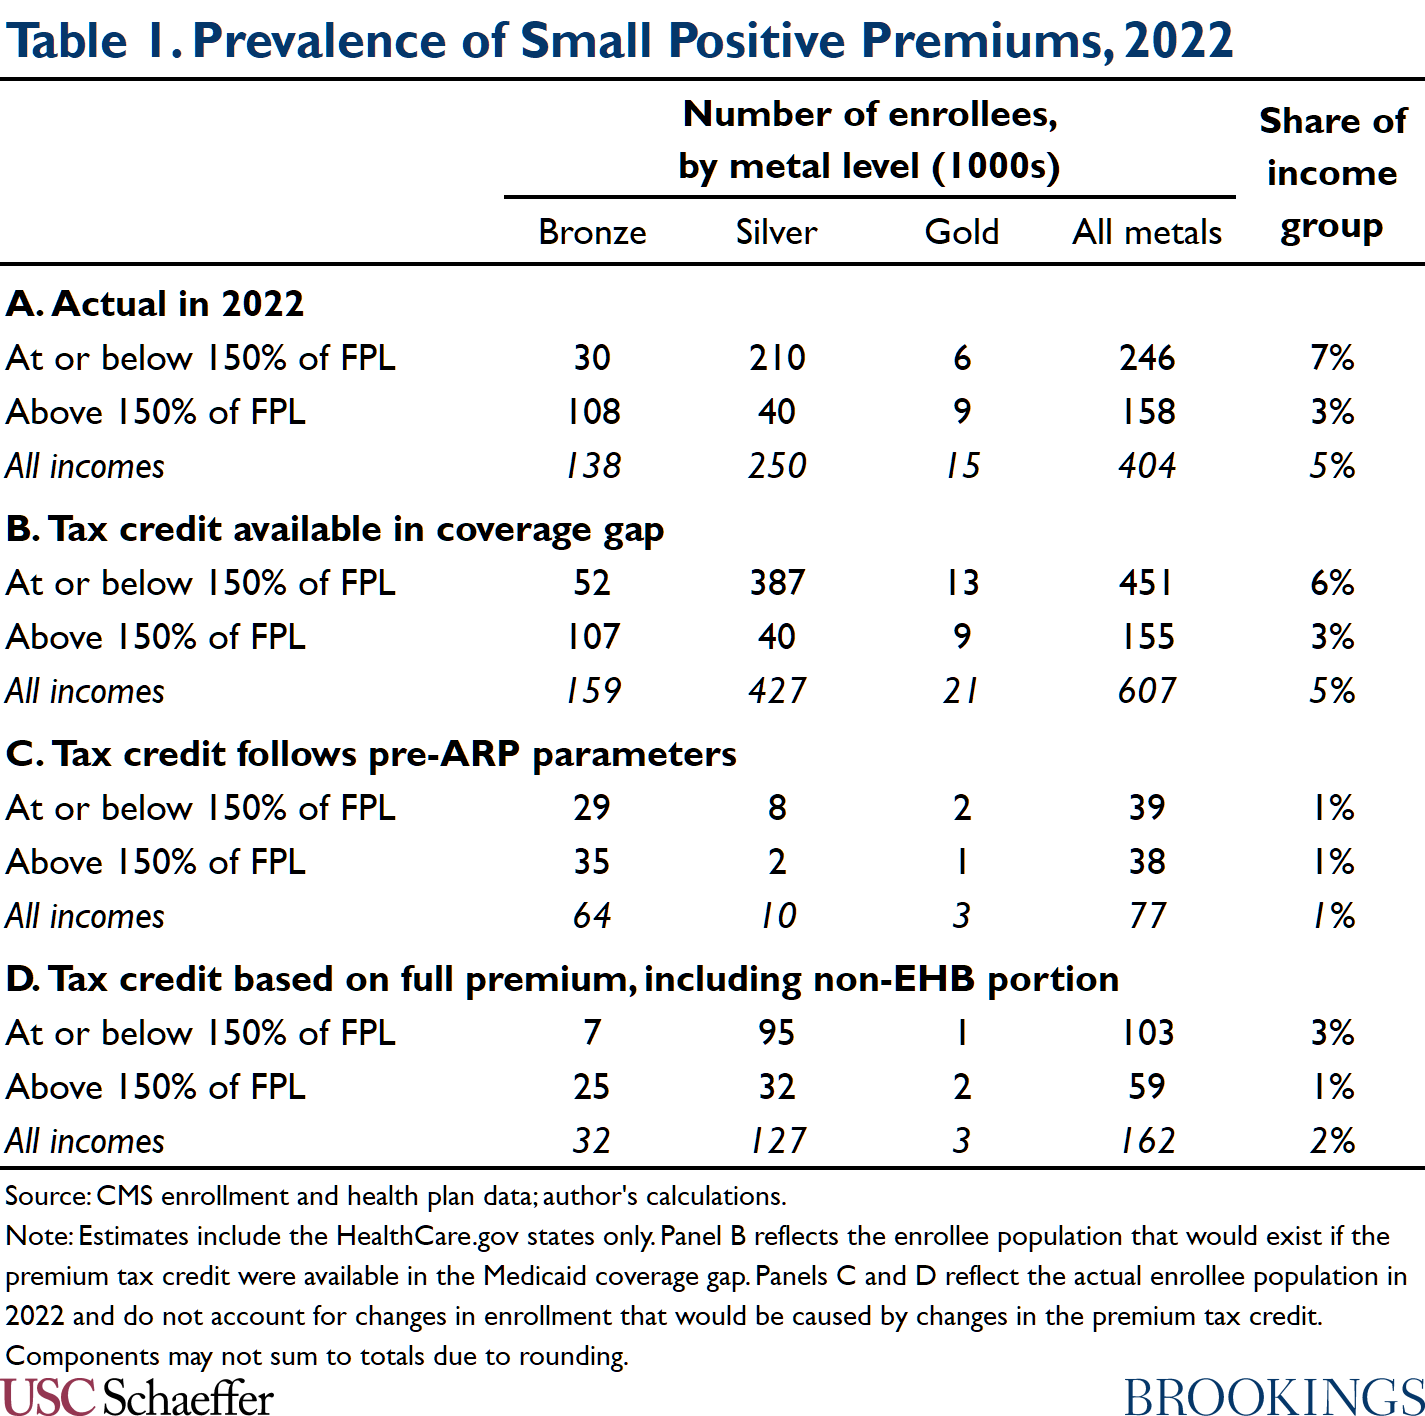
Table 1 displays the resulting estimates. Panel A reports that an estimated 404,000 Marketplace enrollees in the HealthCare.gov states, accounting for 5% of total HealthCare.gov enrollment, currently pay small positive premiums (where a small premium is defined as a premium of less than 0.5% of the gross premium).[5] In what follows, I highlight two particularly salient features of the estimates in Table 1.
Most enrollees facing small positive premiums have incomes at or below 150% of the FPL
To start, Table 1 shows that most enrollees facing small positive premiums have incomes at or below 150% of the FPL and that these enrollees are particularly likely to owe small positive premiums. This is a straightforward consequence of the fact that these enrollees are eligible for larger premium tax credits than higher-income enrollees. Because the enrollee contribution to (the EHB portion of) the benchmark plan is currently zero for enrollees with incomes at or below 150% of the FPL, these enrollees are eligible for a tax credit comparable to the premium of low-cost silver plans. Thus, enrollees in this group can generally access some silver plans and many bronze plans at zero or near-zero premiums.
By contrast, for enrollees with incomes even modestly above 150% of the FPL, the tax credit is smaller than the premium of the lowest-cost silver plans, so all silver plans carry meaningful net premiums. For enrollees at somewhat higher income levels, the value of the tax credit falls below the premium of the lowest-cost bronze plans, so all bronze plans carry meaningful premiums as well.
A corollary of the fact that small positive premiums arise primarily among enrollees with incomes at or below 150% of the FPL is that enrollees who owe small positive premiums are concentrated in Medicaid non-expansion states, where people with incomes between 100% and 138% of the FPL are eligible for subsidized Marketplace coverage rather than Medicaid. In my estimates, 68% of all enrollees facing small positive premiums are in non-expansion states. Related, as shown in Panel B of Table 1, if eligibility for subsidized Marketplace coverage was expanded to people in the Medicaid coverage gap, as proposed in the House-passed Build Back Better Act, the number of enrollees facing small positive premiums would increase markedly to 607,000 because of the much larger number of enrollees below 150% of the FPL.
Another corollary is that small positive premiums will become much rarer if the expansion of the premium tax credit enacted in the ARP expires after 2022, as shown in Panel C of Table 1. In this case, enrollees with incomes at or below 150% of the FPL would always be required to make a premium contribution to the benchmark plan, which would virtually eliminate zero or near-zero premiums silver plans.
Special rules for non-EHB benefits are the primary reason enrollees owe small positive premiums
Table 1 also shows that the special rules related to non-EHB benefits are the primary reason that enrollees owe small positive premiums. In particular, Panel D presents estimates of the number of enrollees who would owe small positive premiums if the tax credit could be used to pay for non-EHB benefits and the benchmark was set based on the full premium rather than just the EHB portion. In this scenario, the number of Marketplace enrollees facing small positive premiums would shrink by around three-fifths.
In the silver tier, this decline occurs almost entirely in the minority of areas where one or both of the two lowest-cost silver plans includes non-EHB benefits, which are depicted in Figure 2 and have been highlighted in prior work.[6],[7] In areas where both lowest-cost silver plans include non-EHB benefits, the special rules for non-EHB benefits cause both plans to carry positive premiums for people with incomes at or below 150% of the FPL; in areas where one of these two plans includes non-EHB benefits, these rules will cause one of the two plans to carry a positive premium. By contrast, absent the special rules related to non-EHB benefits, the two lowest-cost silver plans would always be available at zero premium.
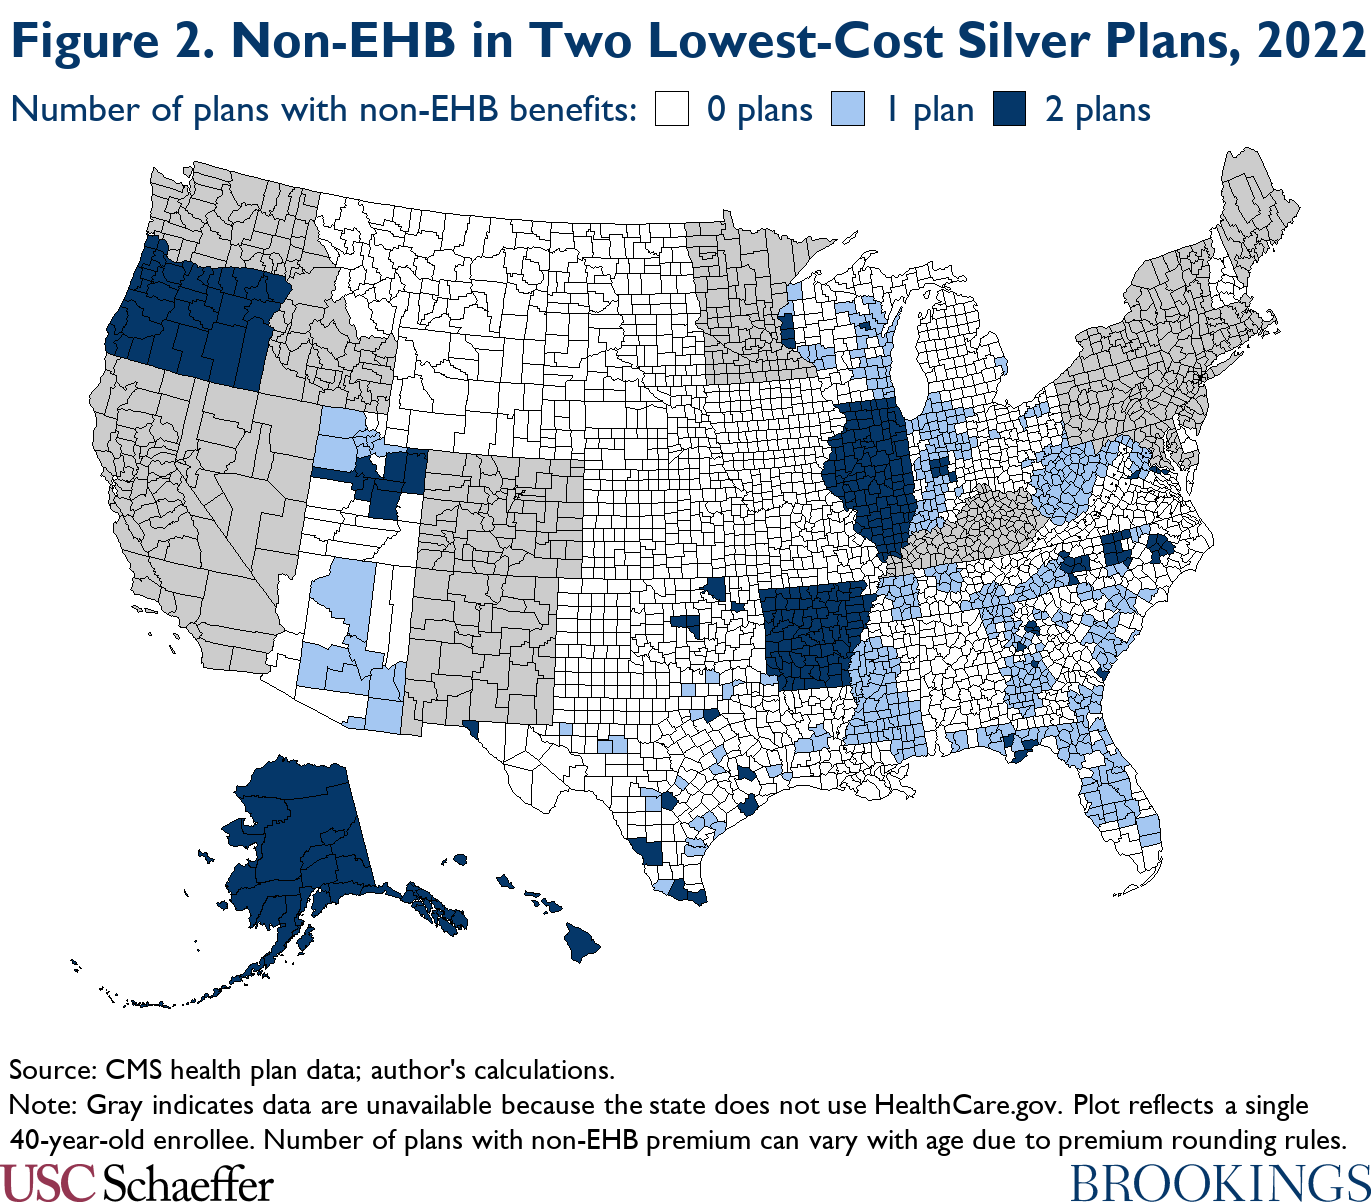
The net premiums that enrollees with incomes at or below 150% of the FPL owe for low-cost silver plans in the areas highlighted in Figure 2, though not zero, are usually small. As reported in Table 2, the net premium of the silver plan with the second-lowest net premium averages only 0.2% of the plan’s gross premium in counties where at least one of the two lowest-cost silver plans includes non-EHB benefits. In absolute terms, these small residual premiums average around $1 per month.
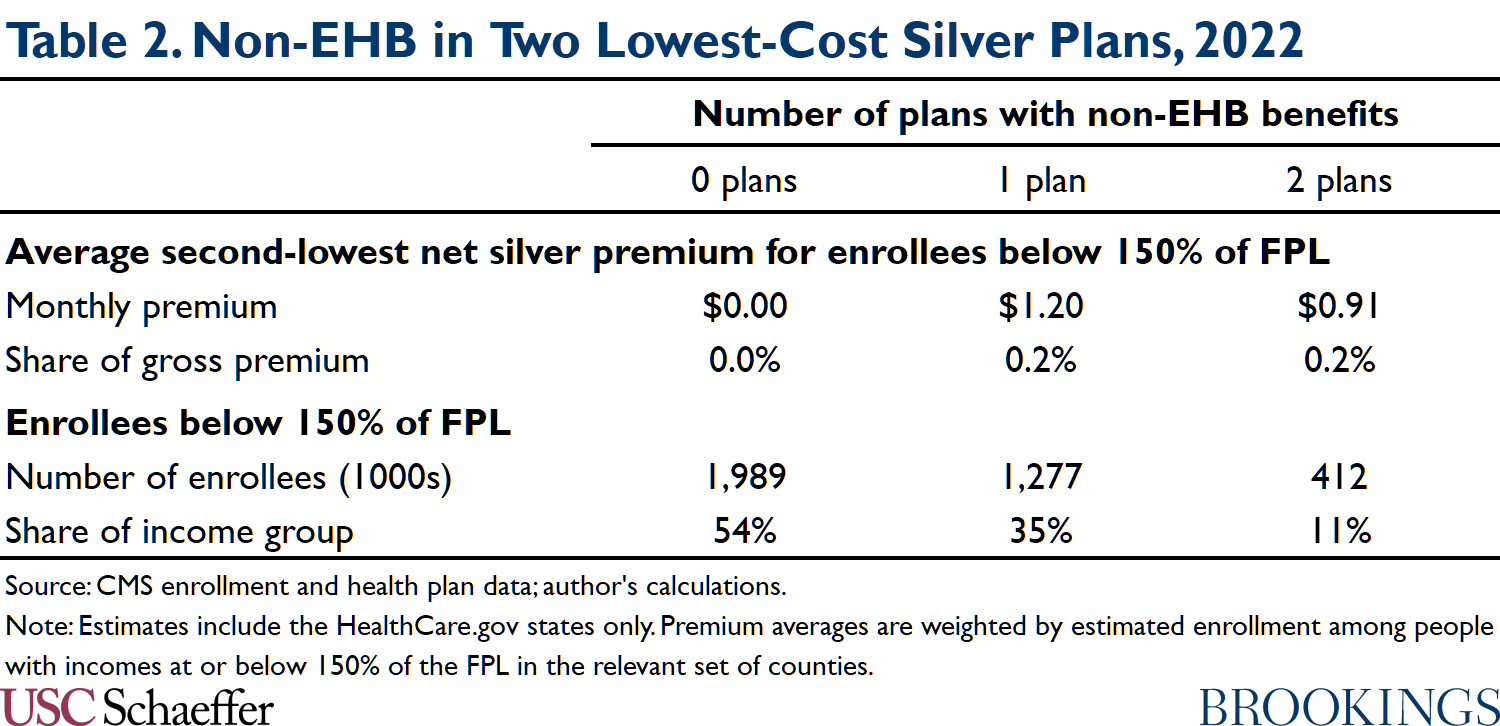
Low-cost silver plans are popular with enrollees in this income range, so many low-income enrollees in these areas end up owing small positive premiums. And these areas contain substantial enrollment at or below 150% of the FPL. Table 2 shows that the HealthCare.gov counties where both of the two lowest-cost silver plans include non-EHB benefits contain 412,000 enrollees at or below 150% of the FPL (11% of all enrollees in this income group). Counties where one of the two lowest-cost silver plans includes non-EHB benefits contain an additional 1.3 million enrollees with incomes at or below 150% of the FPL (35% of all enrollees in this income group).
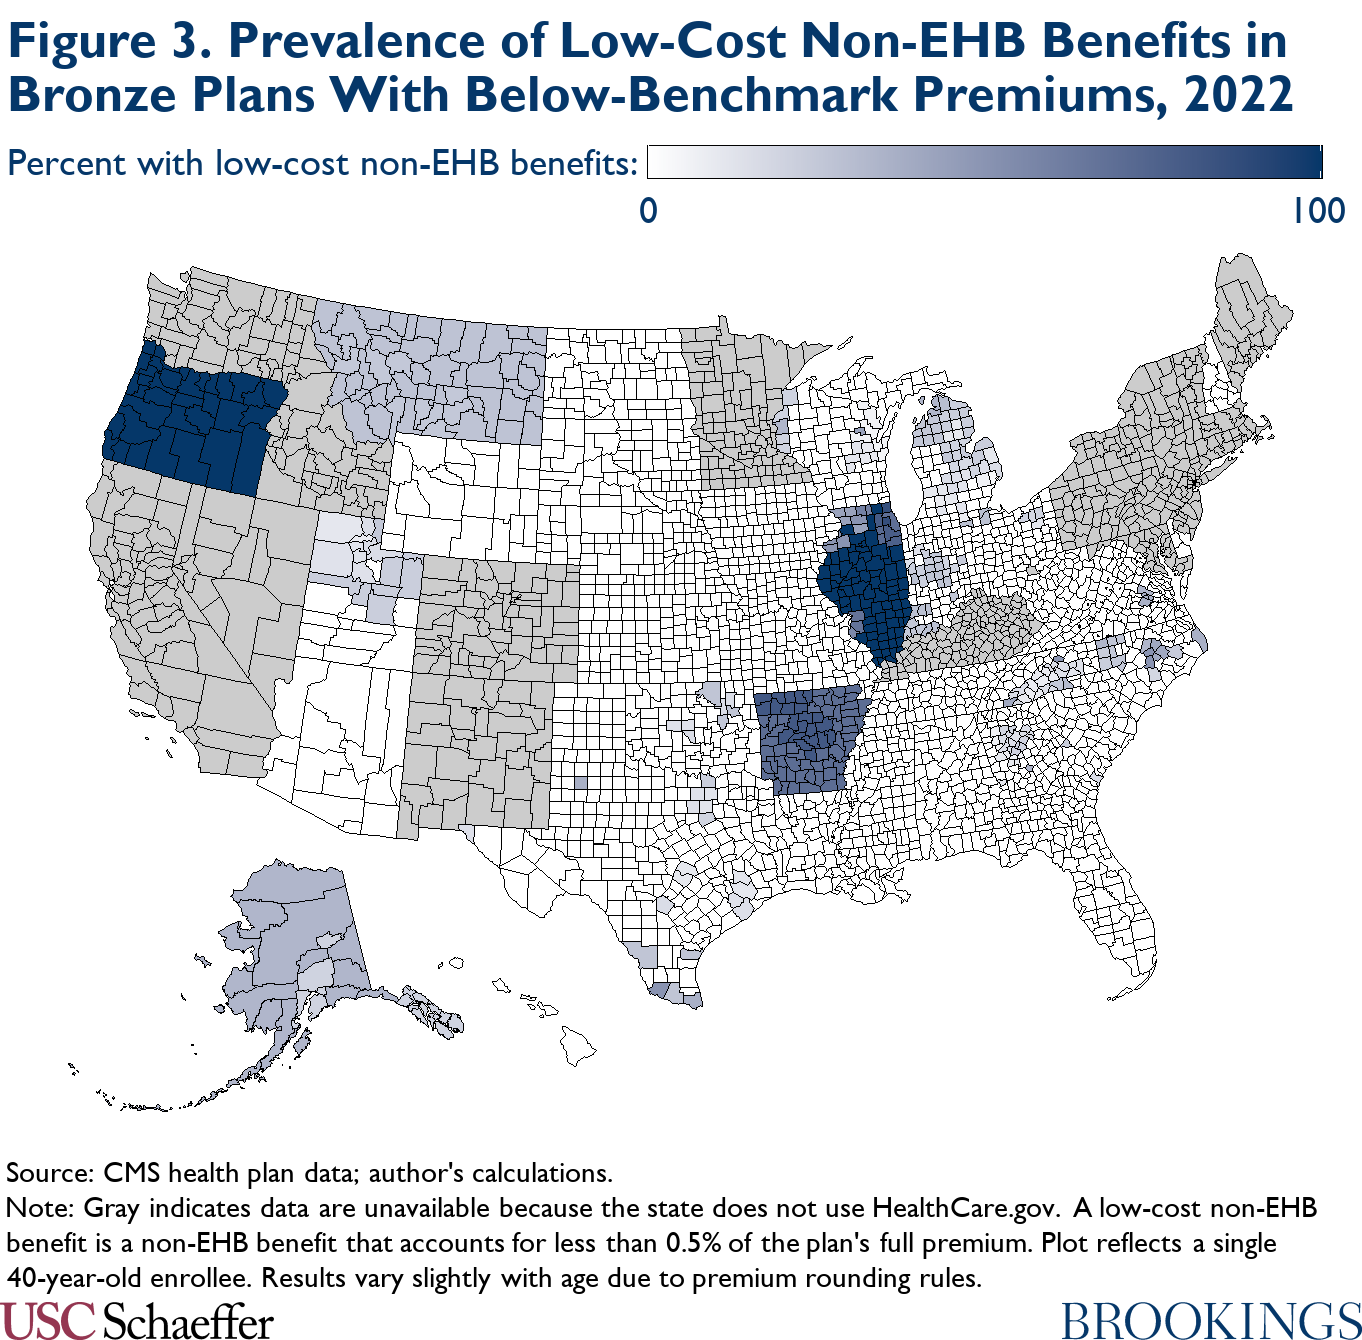
In the bronze tier, the special rules related to non-EHB benefits matter in a somewhat different way. Because the tax credits available to low- and moderate-income enrollees often exceed the EHB portion of the premium of a broad range of bronze plans, the extent to which the special rules related to non-EHB benefits cause bronze plan enrollees to pay small positive premiums depends primarily on how many plans in this broader set contain small non-EHB benefits, not just the features of the lowest-cost plans.
Figure 3 displays the share of bronze plans with premiums below the benchmark premium (the set of plans that are available at zero or near-zero premiums for at least some enrollees) that contain non-EHB benefits that account for less than 0.5% of the gross premium. In three states (Arkansas, Illinois, and Oregon), a large majority of bronze plans meet this criterion. Consistent with this, these three states account for 38% of the decline in the number of bronze plan enrollees owing small positive premiums that would occur without the special rules related to non-EHB benefits; this is despite the fact that these states are Medicaid expansion states and thus have comparatively few low-income Marketplace enrollees.
Consequences of small positive Marketplace premiums
As noted above, there is clear empirical evidence that requiring enrollees to pay even small positive premiums meaningfully reduces insurance enrollment. This section briefly reviews that evidence and then considers what it implies about the normative desirability of relieving enrollees of these premiums.
Empirical evidence on the effect of small positive premiums
The most direct evidence on the effects of small positive premiums comes from research by Coleman Drake and colleagues on differences in enrollment between people with incomes just below and just above the level that would provide access to a zero-premium (bronze) plan in the context of Colorado’s Marketplace. They find little evidence that availability of a zero-premium plan affects initial take-up or plan selection decisions. However, they find that selecting a zero-premium plan increases the number of days a person is covered over the course of the year by 8-16% (depending on the empirical specification used), seemingly mostly by reducing delays in initiation of premium payments.[8]
Evidence in closely related settings supports similar conclusions. Laura Dague examines changes in enrollment behavior at income thresholds at which enrollees lost eligibility for zero-premium coverage in the context of Wisconsin’s Medicaid program. She finds that being subject to a premium reduced average enrollment duration by 13%. By contrast, enrollment behavior changed little at income thresholds at which the premium increased in size, suggesting that the effect of being subject to a premium arises largely from the hassles of remitting a premium, not the direct financial burden of that premium.
Similarly, Adrianna McIntyre, Mark Shepard, and Myles Wagner present evidence on people whose plan changes from having a zero premium to having a positive premium at the start of a new plan year in the context of Massachusetts’ pre-ACA insurance exchange. Their results indicate that, absent a Massachusetts policy that automatically switched these enrollees into a zero-premium plan in the event of non-payment, these enrollees would have been much more likely to attrit from coverage, mostly due to failure to initiate premium payments.[9] This was the case even when the premium was very small.
Normative desirability of eliminating small premiums
This evidence that requiring enrollees to pay even a very small premium causes a discrete drop in insurance coverage has clear implications for the normative desirability of eliminating small premiums. In particular, this evidence implies that policymakers weighing a policy that would pay these premiums on enrollees’ behalf would need to consider two main effects—and likely only these two effects.
The first is the direct benefits and costs of the increase in insurance coverage that would be caused by removing these small premiums; the benefits of that increase in coverage would likely include improved financial protection, access to care, and health outcomes for the newly covered individuals as well as reduced uncompensated care costs for health care providers who treat these individuals, while the cost would be the federal cost of subsidizing these enrollees’ premiums.[10] The second is the benefit of eliminating the hassle and cognitive costs that enrollees incur to remit small positive premiums (which are likely non-trivial given that they sometimes prevent payment) as well as the administrative costs that insurers incur to collect those small premiums. While different policymakers may weigh these benefits and costs in different ways, these are the principal (economic) effects they would need to consider.
Paying these small premiums on enrollees’ behalf would, of course, have other effects. It would impose a direct fiscal cost on the federal government (while delivering a corresponding benefit to enrollees). It would also reduce the relative price of enrolling in the relevant plans, which could shift enrollment toward these plans and change insurers’ plan offerings; for example, it could make plans that include small non-EHB benefits more attractive to enrollees and make insurers more likely to offer them. However, these effects all scale proportionally with the premiums in question, so for negligible premiums like those at issue here, they are likely small. (The finding by Drake and colleagues that availability of a zero premium plan has no apparent effect on plan selection is consistent with this view.) Thus, whether policymakers view these effects as positive or negative, they are likely unimportant to the ultimate policy choice.
An important implication of this discussion is that, if increasing insurance coverage among enrollees who currently owe small positive premiums is desirable (in the sense that the benefits of covering these enrollees outweighs the fiscal cost of subsidizing their coverage), then eliminating these small premiums will also be desirable. Indeed, even if the fiscal cost of paying for these enrollees’ coverage outweighed the direct benefits of that coverage, eliminating small premiums might still be worthwhile to reduce hassle costs. Only if the fiscal cost of paying for these enrollees’ coverage meaningfully outweighed the benefits of that coverage would relieving enrollees of these small premiums likely be undesirable.
Policy options to eliminate small positive premiums
If policymakers wished to relieve enrollees of small positive premiums, there are at least three ways they could do so. First, policymakers could simply pay these premiums on enrollees’ behalf by increasing the premium tax credit to cover an enrollee’s full premium in cases where the enrollee would otherwise owe a small residual premium. Second, they could require insurers to treat enrollees with small premium balances as having paid in full. Finally, they could consider certain other administrative changes that would reduce the prevalence of small premiums or mitigate their effects on enrollment. I discuss each in turn.
Before proceeding, I note that my focus is on steps that could be implemented by federal policymakers. However, essentially all of the polices I consider could be adapted for implementation at the state level, at least in the case of states that operate their own Marketplaces. Policies in this vein could be particularly attractive from the perspective of state policymakers because the state would realize all of the benefits of increased coverage, but much of the fiscal cost would be borne by the federal government.
Modify the premium tax credit
One direct way to eliminate small positive premiums would be to modify the calculation of the premium tax credit via legislation. Concretely, in cases where the enrollee would owe a net-of-tax-credit premium of less than 0.5% of a plan’s gross premium under the premium tax credit rules that would otherwise apply, the credit would be increased to cover the enrollee’s full gross premium.[11]
To estimate the effects that this type of policy would have on insurance coverage and federal outlays, I use the synthetic Marketplace population that was described earlier (and is described in more detail in the appendix). I assume that the realized enrollment durations of enrollees who currently owe a positive premium and would owe no premium under the policy would increase by 12%, which corresponds to the midpoint of the range of estimates provided by Drake and colleagues. I assume that there would be no other changes in enrollment behavior (e.g., changes in initial take-up decisions or shifts of enrollment across plans), which is consistent with the findings of Drake and colleagues and reasonable on a priori grounds since the policy would only slightly change the relative premiums of alternative coverage options.
I also assume that plan offerings and premiums would be unchanged by implementation of the policy. In practice, that assumption would likely be violated to some degree. Indeed, it is plausible that the enrollees most likely to overlook a small premium payment have somewhat lower health care needs than other enrollees. Consistent with that, the McIntyre, Shepard, and Wagner research examining Massachusetts’ pre-ACA exchange discussed above estimates that enrollees who fail to pay premiums have claims spending that is, on average, 9% lower than other enrollees. On the other hand, the silver-tier enrollees that would be affected by this policy predominantly have income at or below 150% of the FPL and, as such, are eligible for cost-sharing reductions (CSRs) that raise the actuarial value (AV) of a silver plan to 94%. This is higher than the overall average AV of a silver plan, which is in the high-80s (inclusive of CSRs), implying that these enrollees would be somewhat more costly than other silver tier enrollees. On balance, it appears likely that the additional enrollment brought about by this policy might slightly reduce premiums, which would in turn slightly reduce federal subsidy costs relative to what I estimate here; regardless, accounting for these effects is unlikely to qualitatively change my estimates.[12]
Under these assumptions, it is straightforward to use the synthetic population to estimate the changes in insurance coverage and federal outlays that would result from implementing this type of policy. Panel A of Table 3 presents the resulting estimated coverage and fiscal effects. I estimate that implementing this policy in 2022 would have increased Marketplace enrollment in the HealthCare.gov states by 48,000 person-years at a federal cost of $336 million. If the premium tax credit had been available to people in the Medicaid coverage gap, the increase in coverage and the corresponding fiscal costs would have been larger, reflecting the greater number of enrollees with incomes below 150% of the FPL.
Table 3 also shows that the new federal costs would almost entirely reflect the cost of subsidizing coverage for the new enrollees. That cost (labeled the “coverage” effect in Table 3) would amount to $330 million under current premium tax credit eligibility rules. By contrast, the cost of providing larger tax credits to existing enrollees (termed the “mechanical” effect in the table) would be just $6 million.
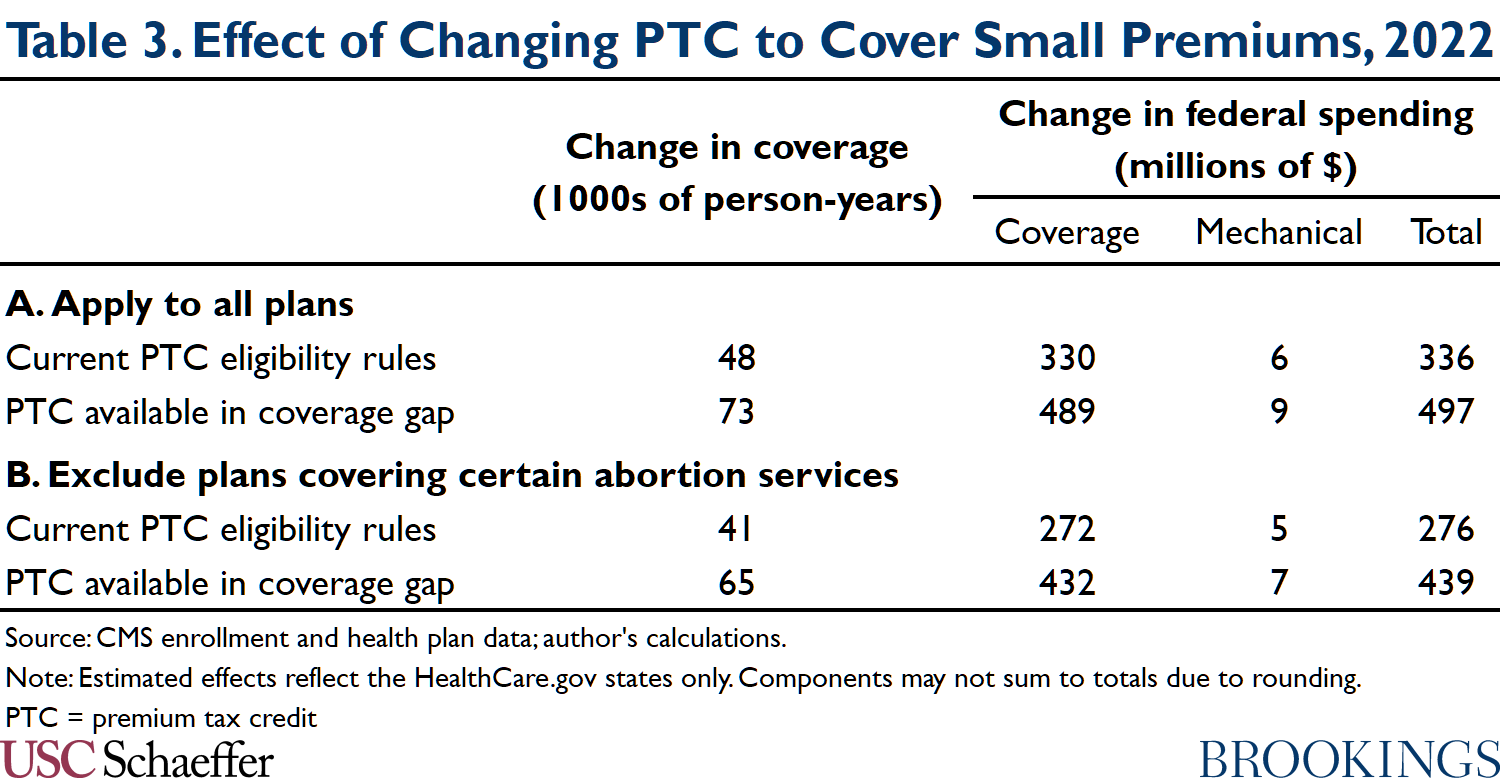
One potential concern with this approach is that the federal government would pay for small amounts of non-EHB services and, in particular, certain non-EHB abortion services. If policymakers wished to avoid this possibility, they could limit the increase in the premium tax credit to people enrolled in plans that do not cover abortion services for which the Hyde Amendment prohibits federal funding, services for which ACA already imposes special rules. As shown in Panel B of Table 3, this alternative policy would have similar effects on insurance coverage and federal outlays. This is because a relatively small fraction of cases where enrollees owe small positive premiums involve plans that cover these abortion services.
Allow or require insurers to waive small premium balances
Another approach would be to allow or require insurers to treat enrollees as having paid in full in cases where the outstanding premium is less than some specified percentage (e.g., 0.5%) of the plan’s gross premium. In the version of this approach where insurers were allowed to waive small premium balances, insurers would presumably be required to apply this policy on a uniform basis in order to prevent insurers from selectively disenrolling people with high claims costs. Under the approach that I am envisioning here, insurers would still be permitted to bill enrollees for these small premiums as they do today but would not take action to terminate enrollment in the event of non-payment.
There are a few key questions about this family of approaches. A first question is whether insurers would elect to waive small premium balances if allowed (but not required) to do so. The discussion above suggests that the enrollees who would newly retain coverage in this scenario—particularly those enrolled in plans outside the silver tier—have somewhat lower claims spending than other enrollees. This suggests that retaining these enrollees would be attractive to insurers and, thus, that insurers would take up an option to waive small premium balances if it were available to them. In at least some cases, the administrative savings from declining to collect these balances might offer an additional incentive.
There are, however, reasons to question whether insurers would take up this option in practice. First, the risk adjustment system could make these enrollees less attractive to an individual insurer than they are from the perspective of the risk pool as a whole. In particular, to the extent that enrollees who retained coverage because of this type of policy were healthier than other enrollees, the insurer’s measured claims risk would fall and it would correspondingly pay more into (or receive less from) the risk adjustment system, thereby making these enrollees somewhat less appealing (although the evidence provided by McIntyre, Shepard, and Wagner suggests that these enrollees would remain attractive along this dimension even after risk adjustment).[13] Second, even assuming that insurers had a financial incentive to retain these enrollees, there is no guarantee that all insurers would recognize that fact or act on it in a timely fashion. Thus, if policymakers wanted to be confident that all insurers would waive small premium balances in practice, they would likely need to require insurers to take this step.
A second question about this family of approaches is whether they would require legislation or could be implemented administratively using existing legal authorities. It is quite likely that CMS could allow insurers to waive small premium balances under existing authorities. Regulations promulgated in 2016 already allow insurers in the HealthCare.gov states to treat enrollees as having paid in full if the enrollee has paid a large enough percentage of what the enrollee owes toward the plan’s premium.[14],[15] While the rule contemplated here differs from CMS’ existing rule in that the threshold would apply with respect to the total premium, not just the enrollee portion, this existing policy is a very close precedent.[16]
It is also conceivable that CMS could require insurers to do this under its existing legal authorities. The Affordable Care Act gave CMS broad authority to set rules governing the Marketplaces, and CMS has used that authority to establish a variety of standards governing the enrollment and disenrollment process. However, resolving this legal question is beyond the scope of this analysis, and it is possible that requiring insurers to waive small premium balances would require legislation.
Broadly speaking, this family of policies would have similar effects on insurance coverage and federal costs as the modifications to the premium tax credit discussed above, at least assuming that all insurers did indeed waive small premium balances (whether by choice or by requirement). There would, however, be some differences between the policies. First, because insurers would retain the right to bill enrollees for small outstanding premiums and many enrollees would presumably continue to pay these premiums, enrollees (and insurers) would continue to incur the associated hassle costs. Second, this approach would likely have a slightly lower fiscal cost since the federal government would not be responsible for paying these small premiums; those savings would likely be partially offset by slightly higher premiums since insurers would likely set somewhat higher premiums in light of the forgone revenue.[17]
Other policy options
If policymakers do not wish to pursue the approaches outlined above, there are some other steps they could take that could reduce the prevalence of near-zero premiums or mitigate reductions in coverage caused by those premiums, though not to the same extent as the options considered above.
One option is to step up enforcement of an Affordable Care Act provision that requires states that require Marketplace plans to cover non-EHB benefits to defray the cost of those benefits; when states fail to do so, that can cause many enrollees who would otherwise pay zero premiums to instead pay positive premiums. CMS has noted that compliance with this requirement is imperfect and recently finalized (but then retracted) a proposal to collect information that would help it better enforce these rules. CMS could seek to reinvigorate these enforcement efforts. While this approach may merit consideration, it would only modestly reduce the prevalence of near-zero premium; relatively few states appear to mandate coverage of non-EHB, and those that do are all Medicaid expansion states, so they contain relatively small numbers of low-income enrollees who would otherwise owe zero premiums.
Another option, which has been discussed elsewhere, would be to discourage insurers from offering plans with small non-EHB benefits or, at a minimum, encourage insurers to offer plans that do not include non-EHB benefits alongside plans that do. This approach could indeed reduce the number of enrollees paying small positive premiums since, as discussed earlier, these premiums often result from the presence of plans that include non-EHB benefits. However, it would also reduce the number of enrollees receiving non-EHB benefits, which could be a cause for concern depending on the nature of the benefits that enrollees would no longer receive. Adding plans that do not include non-EHB benefits alongside plans that do could also make it more difficult for prospective enrollees to choose a plan.
A final option is to take steps that reduce the risk that an enrollee will lose coverage if she fails to pay her premium. For example, policymakers could automatically transition enrollees who miss premium payments into a zero-premium plan when one is available. The McIntyre, Shepard, and Wagner research on Massachusetts’ pre-ACA exchange described above shows that this type of policy can substantially increase insurance enrollment (although in this context such a policy would often require transitioning people enrolled in silver plans into bronze plans). CMS’ new rule that allows people with incomes at or below 150% of the FPL to enroll in Marketplace coverage at any time during the year, rather than solely during open enrollment, also gives people who are disenrolled due to nonpayment a path back to coverage. Both of these policy steps have consequences that extend beyond just the scenario I focus on here but would indeed mitigate the extent to which small positive premiums reduce coverage.
Appendix
This appendix provides more detail on how I estimate the number of enrollees paying small positive premiums in 2022 and the coverage and fiscal impacts of policies to eliminate those premiums. In brief, I first use data on 2022 open enrollment plan selections to estimate county-level enrollment by income, age, and metal level in the HealthCare.gov states, which I then use to construct a synthetic population of Marketplace enrollees. Next, I obtain information on the plans available to each synthetic enrollee (within the relevant metal tier) from CMS’ plan landscape, plan rates, and benefits files,[18] and I assign each enrollee a probability of selecting each of those plans so that the estimated number of enrollees paying net premiums of $10 per month or less aligns with the actual number of enrollees that CMS reports pay such premiums. The resulting simulated population can then be used to answer the questions of interest.
Step #1: Estimate county-level enrollment by income, age, and metal level
My first step is to produce county-level estimates of enrollment that are disaggregated by income category, age category, and metal level. To that end, I begin with county-level tabulations of Marketplace plan selections in the HealthCare.gov states during 2022 open enrollment published by CMS, which provide the univariate distribution of enrollment across several income and age categories.[19]
One limitation of these data is that CMS suppresses county-level tallies for cells with values between 1 and 10. To address this limitation, I impute the missing data as follows. For the small number of counties with missing data on aggregate plan selections, I calculate the number of statewide plan selections that are accounted for by counties with non-missing data and then distribute the remaining plan selections equally across the counties with missing data. For the larger number of counties with missing data on plan selections with specific characteristics, I calculate the number of statewide plan selections with those characteristics that are accounted for by counties with non-missing data and then distribute the remaining plan selections across the counties with missing data in proportion to the counties’ total plan selections.
The next step is to use the univariate distributions included in the imputed county-level file to impute the joint distribution by income category, age category, and metal level. I do so using the following method:
- Allocate each income group’s enrollment across metal levels based on the corresponding statewide distributions: While CMS does not publish county-level tabulations that disaggregate enrollment in each income group by metal level, CMS does publish these tabulations at the state level. Thus, I impute county-level metal mix within each income group by assuming that each county’s within-income-group metal mix matches the statewide average. In allocating enrollment to metal tiers, I ignore the negligible amount of enrollment in the catastrophic and platinum tiers and allocate all enrollment to the bronze, silver, and gold tiers.
- Assume the age distribution in each income/metal-level cell matches the overall county-level age distribution: To allocate enrollment in each county-level income/metal-level cell across age groups, I assume that the age distribution in each cell matches the overall county-level age distribution of Marketplace enrollment. This assumption is clearly imperfect. Notably, lower-income categories are presumably less likely to include enrollees under the age of 19 because low-income children are typically eligible for Medicaid or the Children’s Health Insurance Program. Additionally, age is likely correlated with enrollees’ choice of metal tier. However, there is no straightforward way to remedy this problem given the data CMS publishes.
A final adjustment is necessary to account for the fact that the number of plan selections during open enrollment is typically higher than average enrollment over the course of the year because some people who select plans during open enrollment never effectuate their coverage and because some enrollees attrit over the course of the year (and are not fully replaced by people entering through special enrollment periods). To account for this pattern, I multiply all county-level plan selection estimates by 0.86, the ratio of total plan selections to average effectuated enrollment in all states in 2019.
Some of my analyses consider a scenario in which the premium tax credit is made available to people in the Medicaid coverage gap. To estimate enrollment in that scenario, I draw on my prior work to estimate that this policy would add 3.3 million enrollees to the Marketplace in the Medicaid coverage gap states (that is, the Medicaid non-expansion states except Wisconsin, which covers enrollees below the FPL via a pre-ACA program).[20] I allocate these new enrollees by county, age, and metal level by the assuming that they are distributed in the same way as existing enrollees with incomes below 138% of the FPL.
Step #2: Create synthetic population of Marketplace enrollees
My next step is to create a synthetic population of Marketplace enrollees using these county-level estimates. To do so, I make 100,000 draws (with replacement) from the set of county/age-category/income-category/metal-level cells, where each cell’s probability of selection is proportional to its estimated enrollment. For each draw, I create a synthetic enrollee with the specified county and metal level of enrollment, and I assign the enrollee an age and income by making a random draw from uniform (and independent) distributions on the relevant age and income categories. The resulting population of 100,000 synthetic enrollees is large enough to ensure that sampling error is negligible.
In creating this synthetic population, I cannot account for how enrollees are grouped into families because of the limitations of the underlying CMS data. Instead, I treat all enrollees as being part of one-person households. The direction of any resulting bias is unclear. Depending on family characteristics, this approach can cause me to either over- or underestimate enrollees’ premium tax credits and, in turn, either over- or underestimate of the number of enrollees facing small positive premiums.[21]
For two reasons, however, it is likely that any resulting biases are small. First, for enrollees with incomes at or below 150% of the FPL, the enrollee contribution to (the EHB portion of) the benchmark plan is always zero, regardless of family size. Thus, for these enrollees—the most important population for this analysis—ignoring family structure is innocuous. Second, as an empirical matter, Marketplace households often consist of only a single person. CMS’ open enrollment data indicate that each application for Marketplace coverage in the HealthCare.gov states includes, on average, only 1.46 people, indicating that more than half of applications seek coverage for only one person. While there may sometimes be other people in the household who are not included on the Marketplace application (e.g., children eligible for Medicaid or the Children’s Health Insurance Program), this nevertheless suggests that Marketplace households are frequently small, which should limit the size of the bias from ignoring family structure.
Step #3: Allocate enrollment across plans
The prior two steps result in a synthetic population of enrollees where each enrollee has a known county of residence, income, age, and metal tier. To facilitate the analyses presented here, however, it is necessary to know how enrollees are allocated across plans within a metal tier.
I obtain information on each enrollee’s set of plan choices from the Marketplace landscape file. I then assume that an enrollee’s choice of plan within the relevant metal tier follows a simple multinomial logit model in which the only characteristic determining enrollees’ choices is each plan’s net premium; this model produces a probability that an enrollee selects each plan in the metal tier. I assume that the magnitude of the coefficient applied to net premium is age-specific and varies inversely proportionally with an enrollee’s age rating factor, which roughly corresponds to an assumption that enrollees of different ages at the same income level make the same plan choices. I calibrate the coefficient on net premium so that the estimated number of enrollees paying net premiums of $10 per month or less aligns with the actual number of such enrollees, as reported by CMS in its open enrollment reports.
This calibration approach has the important strength that it ensures that my estimates of the number of enrollees with zero or near-zero premiums align with the actual number of such enrollees in the HealthCare.gov states. This means that my estimates of the number of enrollees who pay small positive premiums will go awry only to the extent that I misestimate the share of all enrollees with small net premiums who pay small positive premiums as opposed to zero premiums.

Acknowledgements
I thank David Anderson, Richard Frank, Jason Levitis, Adrianna McIntyre, and Tara Straw for helpful comments on a draft of this piece. I thank Vani Agarwal, Kathleen Hannick, and Conrad Milhaupt for excellent research assistance, and I thank Caitlin Rowley for excellent editorial assistance. All errors are my own.
Disclosures: The Brookings Institution is financed through the support of a diverse array of foundations, corporations, governments, individuals, as well as an endowment. A list of donors can be found in our annual reports published online here. The findings, interpretations, and conclusions in this report are solely those of its author(s) and are not influenced by any donation.
Footnotes:
[1] Essential health benefits are a set of health care services defined by the Affordable Care Act. All individual market and small group market plans are required to cover all EHB.
[2] In practice, when calculating the tax credit amount that enrollees can receive on an advance basis during the year, HealthCare.gov appears to round up to the nearest whole dollar. I do the same in this analysis since my focus is on what enrollees must pay in real time over the course of the year.
[3] There are additional special rules that apply to plans that cover certain abortion services, which require enrollees to pay at least $1 toward these plans, even if the actual cost of the abortion benefits is smaller than this.
[4] This calculation treats a county-plan pair as a single observation. Weighting each county-plan pair by county enrollment leads to similar conclusions about the prevalence of non-EHB benefits.
[5] Here and throughout, I limit the analysis to the 33 states served by HealthCare.gov because CMS does not publish the needed data on county-level enrollment, plan offerings, premiums and benefits for states that do not use HealthCare.gov. The HealthCare.gov states account for 80% of all Marketplace enrollees who pay net premiums of $10 or less (including zero premiums), which suggests that these states account for the large majority of all Marketplace enrollees who pay small positive premiums.
[6] Here, I use “lowest” and “second-lowest” to refer to plans ranked by the EHB portion of the premium, consistent with the rules used to determine the benchmark premium. Ties are broken using the full premium.
[7] In rare cases, eliminating the special rules related to non-EHB benefits could have effects on silver plans offered in other areas. For example, because CMS appears to round up to the nearest whole dollar when calculating an enrollee’s advance premium tax credit, this change can cause the third-lowest-cost silver plan to become available at zero premium in cases where that plan includes a small non-EHB benefit.
[8] Specifically, the authors estimate that enrollment in a zero-premium plan increases enrollment duration by 23-45 days, which corresponds to 8-16% of the roughly 289-day average enrollment duration they report for enrollees just above the threshold at which enrollees become ineligible for zero-premium coverage. Ideally, the 23-45 day estimate would be compared to the average baseline duration for just the “compliers” (that is, the enrollees who are enrolled for longer when enrolled in a zero-premium plan), rather than all enrollees. However, the authors do not report the relevant estimate, and it is unlikely that it would differ dramatically.
[9] McIntyre, Shepard, and Wagner do not report a point estimate of the effect of facing a small positive premium. However, the authors’ Figure 2 reports the plan switching rate for enrollees who newly owe a premium as well as for those who continue to owe no premium. In their setting, the difference between these two series (for months after the first month) is a plausible estimate of the excess attrition that would be caused by forcing enrollees to pay a positive premium. Under that assumption (and ignoring other sources of attrition over the year), their data imply that imposing a premium on these enrollees would have reduced enrollment by 17% on average over the year. The authors’ results suggest that the degree of premium-related attrition would decline slightly as the premium in question shrinks but remain sizeable for even very small positive premiums, which suggests that the enrollee behavior they document is quite consistent with the other estimates catalogued here.
[10] The cost to the federal government may differ from just the direct cost of subsidizing these enrollees’ premiums because adding these enrollees to the individual market risk pool may affect gross premiums and, in turn, change subsidy costs more broadly. Changes in gross premiums may also have consequences for other enrollees. I return to these effects below and conclude that they would likely be relatively small in this instance.
[11] California has implemented a version of this policy that pays small premiums linked to non-EHB abortion coverage (but not small premiums that arise in other ways).
[12] This policy could also cause insurers to include more non-EHB benefits in their low-cost plans since some low-income enrollees would now be insulated from those costs, making these enrollees less likely to leave for other plans or become disenrolled for non-payment. Consistent with the discussion in the last section, however, any such effects would be quite modest since enrollees would be insulated from these costs only to the extent that the non-EHB benefits constituted less than 0.5% of a plan’s gross premium. I estimate that even if every enrollee that currently has a zero or small positive premium became enrolled in a plan that included non-EHB benefits worth 0.5% of the plan’s gross premium, this would only increase federal costs by $68 million.
[13] On the other hand, there is some evidence, albeit evidence with some limitations, that the risk adjustment system systematically overcompensates insurers for lower-income enrollees. Most of the enrollees in question here have relatively low incomes, which could make these enrollees more attractive to insurers.
[15] States operating their own Marketplaces are allowed to adopt this policy if they wish.
[16] Indeed, CMS seems to have explicitly contemplated adopting a policy that would allow insurers to waive all small premium balances when it changed its rules governing how insurers must bill enrollees for plans that include certain abortion services. CMS did not ultimately implement those billing changes and then never followed up on the policy related to small premium balances.
[17] Relative to the premium tax credit policy, this approach would likely make it somewhat less attractive for insurers to include non-EHB benefits in their low-cost plans since insurers would no longer always receive payment for those benefits. However, to the extent that insurers viewed these enrollees as profitable, it might still be more attractive to offer those benefits than under the status quo since offering those benefits would now be less likely to result in enrollees failing to pay a small positive premium and thereby becoming disenrolled.
[18] I use the plan landscape file to define which plans are available to an enrollee in a particular county. While some data on plan premiums is available from the landscape file, I obtain age-specific plan premiums from the plan rate public use file in order to avoid introducing small errors related to how premiums are rounded.
[19] The data use the following income categories: less than 100% of the FPL; 100-138% of the FPL; 138-150% of FPL; 150-200% of FPL; 200-250% of FPL; 250-300% of FPL; 300-400% of FPL; 400-500% of the FPL; and greater than 500% of FPL; and not reported. When analyzing the data, I aggregate all enrollees with incomes at or below 138% of the FPL into a single category and do the same for enrollees with incomes above 400% of the FPL. The age categories available in the data are 0-17, 18-25, 26-34, 35-44, 45-54, 55-64, and 65 and older.
[20] My earlier work estimates that 5.8 million people in the coverage gap states who would be eligible for Medicaid under expansion would enroll in Marketplace coverage (in 2023) if all were eligible. Using the CMS enrollment data used throughout this analysis, I estimate that there are currently 2.5 million people with incomes between 100% and 138% of the FPL enrolled in the Marketplace in the coverage gap states, implying that extending eligibility to people in the coverage gap would raise enrollment among people below 150% of the FPL by 3.3 million people.
[21] In greater detail, I observe income as a percentage of the FPL in this analysis. When an enrollee’s household includes other members who are not covered by the Marketplace (e.g., children who are covered by Medicaid or the Children’s Health Insurance Program), ignoring the presence of the other household members will cause me to underestimate the household’s income when converting its income from a percentage of the FPL to dollar terms. Because households at the same percentage of the FPL are expected to contribute the same percentage of income toward the benchmark plan, this will cause me to underestimate how much these enrollees are expected to contribute to the benchmark plan and, in turn, overestimate the size of their premium tax credits.
On the other hand, when an enrollee’s household includes other Marketplace enrollees, the bias runs in the opposite direction. Consider two enrollees who I treat as being members of separate households but are, in fact, members of the same household. Because the FPL increases less-than-proportionally with family size, treating these two enrollees as separate one-person households will cause me to overestimate the household’s income and, in turn, overestimate the household’s required contribution to the benchmark plan, which will cause me to underestimate the value of the household’s premium tax credit.