A primer on elementary and secondary education in the United States
Editor’s Note: This report is an excerpt, with minor edits, from Addressing Inequities in the US K-12 Education System, which first appeared in Rebuilding the Pandemic Economy, published by the Aspen Economic Strategy Group in 2021.
This report reviews the basics of the American elementary and secondary education system: Who does what and how do we pay for it? While there are some commonalities across the country, the answers to both questions, it turns out, vary considerably across states.1
Who does what?
Schools are the institution most visibly and directly responsible for educating students. But many other actors and institutions affect what goes on in schools. Three separate levels of government—local school districts, state governments, and the federal government—are involved in the provision of public education. In addition, non-governmental actors, including teachers’ unions, parent groups, and philanthropists play important roles.
Schools
Most 5- to 17-year-old children – about 88%– attend public schools.2 (Expanding universal schooling to include up to two years of preschool is an active area of discussion which could have far-reaching implications, but we focus on grades K-12 here.) About 9% attend private schools; about a quarter of private school students are in non-sectarian schools, and the remaining three-quarters are about evenly split between Catholic and other religious schools. The remaining 3% of students are homeschooled.
Magnet schools are operated by local school districts but enroll students from across the district; magnet schools often have special curricula—for example, a focus on science or arts—and were sometimes designed specifically to encourage racial integration. Charter schools are publicly funded and operate subject to state regulations; private school regulations and homeschooling requirements are governed by state law and vary across states. Nationally, 6.8% of public school students are enrolled in charter schools; the remainder attend “traditional public schools,” where students are mostly assigned to schools based on their home address and the boundaries school districts draw. Washington, D.C. and Arizona have the highest rates of charter enrollment, with 43 and 19% of their public school students attending charter schools. Several states have little or no charter school enrollment. Prior to the COVID-19 pandemic, nearly all public schooling took place in person, with about 0.6% of students enrolled in virtual schools.
Local School Districts
Over 13,000 local education agencies (LEAs), also known as school districts, are responsible for running traditional public schools. The size and structure of local school districts, as well as the powers they have and how they operate, depend on the state. Some states have hundreds of districts, and others have dozens. District size is mostly historically determined rather than a reflection of current policy choices. But while districts can rarely “choose” to get smaller or larger, district size implicates important trade-offs. Having many school districts operating in a metropolitan area can enhance incentives for school and district administrators to run schools consistent with the preferences of residents, who can vote out leaders or vote with their feet by leaving the district. On the other hand, fragmentation can lead to more segregation by race and income and less equity in funding, though state laws governing how local districts raise revenue may address the funding issues. Larger districts can benefit from economies of scale as the fixed costs of operating a district are spread over more students and they are better able to operate special programs, but large districts can also be difficult to manage. And even though large districts have the potential to pool resources between more- and less-affluent areas, equity challenges persist as staffing patterns lead to different levels of spending at schools within the same district.
School boards can be elected or appointed, and they generally are responsible for hiring the chief school district administrator, the superintendent. In large districts, superintendent turnover is often cited as a barrier to sustained progress on long term plans, though the causation may run in the other direction: Making progress is difficult, and frustration with reform efforts leads to frequent superintendent departures. School districts take in revenue from local, state, and federal sources, and allocate resources—primarily staff—to schools. The bureaucrats in district “central offices” oversee administrative functions including human resources, curriculum and instruction, and compliance with state and federal requirements. The extent to which districts devolve authority over instructional and organizational decisions to the school level varies both across and within states.
State Governments
The U.S. Constitution reserves power over education for the states. States have delegated authority to finance and run schools to local school districts but remain in charge when it comes to elementary and secondary education. State constitutions contain their own—again, varying—language about the right to education, which has given rise to litigation over the level and distribution of school funding in nearly all states over the past half century. States play a major role in school finance, both by sending aid to local school districts and by determining how local districts are allowed to tax and spend, as discussed further below.
State legislatures and state education agencies also influence education through mechanisms outside the school finance system. For example, states may set requirements for teacher certification and high school graduation, regulate or administer retirement systems, determine the ages of compulsory schooling, decide how charter schools will (or will not) be established and regulated, set home-schooling requirements, establish curricular standards or approve specific instructional materials, choose standardized tests and proficiency standards, set systems for school accountability (subject to federal law), and create (or not) education tax credits or vouchers to direct public funds to private schools. Whether and how states approach these issues—and which functions they delegate to local school districts—varies considerably.
Federal Government
The authority of the federal government to direct schools to take specific actions is weak. Federal laws protect access to education for specific groups of students, including students with disabilities and English language learners. Title IX prohibits sex discrimination in education, and the Civil Rights Act prohibits discrimination on the basis of race. The U.S. Department of Education issues regulations and guidance on K-12 laws and oversees grant distribution and compliance. It also collects and shares data and funds research. The Bureau of Indian Education is housed in the Department of the Interior, not the Department of Education.
The federal government influences elementary and secondary education primarily by providing funding—and through the rules surrounding the use of those funds and the conditions that must be met to receive federal funding. Federal aid is typically allocated according to formulas targeting particular populations. The largest formula-aid federal programs are Title I of the Elementary and Secondary Education Act (ESEA), which provides districts funds to support educational opportunity, and the Individuals with Disabilities Education Act (IDEA), for special education. Both allocate funding in part based on child poverty rates. State and school district fiscal personnel ensure that districts comply with rules governing how federal funds can be spent and therefore have direct influence on school environments. Since 1965, in addition to specifying how federal funds can be spent, Congress has required states and districts to adopt other policies as a condition of Title I receipt. The policies have changed over time, but most notably include requiring school districts to desegregate, requiring states to adopt test-based accountability systems, and requiring the use of “evidence-based” approaches.
IDEA establishes protections for students with disabilities in addition to providing funding. The law guarantees their right to a free and appropriate public education in the least restrictive setting and sets out requirements for the use of Individualized Educational Programs. Because of these guarantees, IDEA allows students and families to pursue litigation. Federal law prohibits conditioning funding on the use of any specific curriculum. The Obama Administration’s Race to the Top program was also designed to promote specific policy changes—many related to teacher policy—but through a competitive model under which only select states or districts “won” the funds. For the major formula funds, like Title I and IDEA, the assumption (nearly always true) is that states and districts will adopt the policies required to receive federal aid and all will receive funds; in some cases, those policy changes may have more impact than the money itself. The federal government also allocated significant funding to support schools during the Great Recession and during the COVID-19 pandemic through specially created fiscal stabilization or relief funds; federal funding for schools during the COVID crisis was significantly larger than during the Great Recession.
The federal tax code, while perhaps more visible in its influence on higher education, also serves as a K-12 policy lever. The controversial state and local tax deduction, now limited to $10,000, reduces federal tax collections and subsidizes progressive taxation for state and local spending, including for education. As of 2018, 529 plans, which historically allowed tax-preferred savings only for higher education expenses, can also be used for private K-12 expenses.
Non-Governmental Actors
Notable non-governmental actors in elementary and secondary education include teachers’ unions and schools of education, along with parents, philanthropists, vendors, and other advocates.The nation’s three million public school teachers are a powerful political force, affecting more than just teachers’ compensation. For example, provisions of collective bargaining agreements meant to improve teachers working conditions also limit administrator flexibility. Teachers unions are also important political actors; they play an active role in federal, state, and school board elections and advocate for (or, more often, against) a range of policies affecting education. Union strength varies considerably across U.S. states.
Both states and institutions of higher education play important roles in determining who teaches and the preparation they receive. Policies related to teacher certification and preparation requirements, ranging from whether teachers are tested on academic content to which teachers are eligible to supervise student teachers, vary considerably across states.3 Meanwhile, reviews of teacher training programs reveal many programs do not do a good job incorporating consensus views of research-based best practices in key areas. To date, schools of education have not been the focus of much policy discussion, but they would be critical partners in any changes to how teachers are trained.
Parents play an important role, through a wide range of channels, in determining what happens in schools. Parents choose schools for their children, either implicitly when they choose where to live or explicitly by enrolling in a charter school, private school, participating in a school district choice program, or homeschooling, though these choices are constrained by income, information, and other factors. They may also raise money through Parent Teacher Associations (PTAs) or other foundations—and determine how it is spent. And they advocate for (or against) specific policies, curriculum, or other aspects of schooling through parent organizations, school boards, or other levels of government. Parents often also advocate for their children to receive certain teachers, placements, evaluation, or services; this is particularly true for parents of students with disabilities, who often must make sure their children receive legally required services and accommodations. Though state and federal policymakers sometimes mandate parent engagement, these mechanisms do not necessarily provide meaningful pathways for parental input and are often dominated by white and higher-SES parents.
Philanthropy also has an important influence on education policy, locally and nationally. Not only do funders support individual schools in traditional ways, but they are also increasingly active in influencing federal and state laws. Part of these philanthropic efforts happen through advocacy groups, including civil rights groups, religious groups, and the hard-to-define “education reform” movement. Finally, the many vendors of curriculum, assessment, and “edtech” products and services bring their own lobbying power.
Paying for school
Research on school finance might be better termed school district finance because districts are the jurisdictions generating and receiving revenue, and districts, not schools, are almost always responsible for spending decisions. School districts typically use staffing models to send resources to schools, specifying how many staff positions (full-time equivalents), rather than dollars, each school gets.
Inflation-adjusted, per-pupil revenue to school districts has increased steadily over time and averaged about $15,500 in 2018-19 (total expenditure, which includes both ongoing and capital expenditure, is similar but we focus on revenue because we are interested in the sources of revenue). Per-pupil revenue growth tends to stall or reverse in recessions and has only recently recovered to levels seen prior to the Great Recession (Figure 1). On average, school districts generated about 46% of their revenue locally, with about 80% of that from property taxes; about 47% of revenue came from state governments and about 8% from the federal government. The share of revenue raised locally has declined from about 56% in the early 1960s to 46% today, while the state and federal shares have grown. Local revenue comes from taxes levied by local school districts, but local school districts often do not have complete control over the taxes they levy themselves, and they almost never determine exactly how much they spend because that depends on how much they receive in state and federal aid. State governments may require school districts to levy certain taxes, limit how much local districts are allowed to tax or spend, or they may implicitly or explicitly redistribute some portion of local tax revenue to other districts.
Both the level of spending and distribution of revenue by source vary substantially across states (Figure 2), with New York, the highest-spending state, spending almost $30,000 per pupil, while Idaho, Utah, and Oklahoma each spent under $10,000 per pupil. (Some, but far from all, of this difference is related to higher labor costs in New York.) Similarly, the local share of revenue varies from less than 5% in Hawaii and Vermont to about 60% in New Hampshire and Nebraska. On average, high-poverty states spend less, but there is also considerable variation in spending among states with similar child poverty rates.
Discussions of school funding equity—and considerable legal action—focus on inequality of funding across school districts within the same state. While people often assume districts serving disadvantaged students spend less per pupil than wealthier districts within a state, per-pupil spending and the child poverty rate are nearly always uncorrelated or positively correlated, with higher-poverty districts spending more on average. Typically, disadvantaged districts receive more state and federal funding, offsetting differences in funding from local sources. Meanwhile, considerable inequality exists between states, and poorer states spend less on average. Figure 3 illustrates an example of this dynamic, showing the relationship between district-level per-pupil spending and the child poverty rate in North Carolina (a relatively low-spending state with county- and city-based districts) and Illinois (a higher-spending state with many smaller districts). In North Carolina, higher poverty districts spend more on average; Illinois is one of only a few states in which this relationship is reversed. But this does not mean poor kids get fewer resources in Illinois than in North Carolina. Indeed, nearly all districts in Illinois spend more than most districts in North Carolina, regardless of poverty rate.
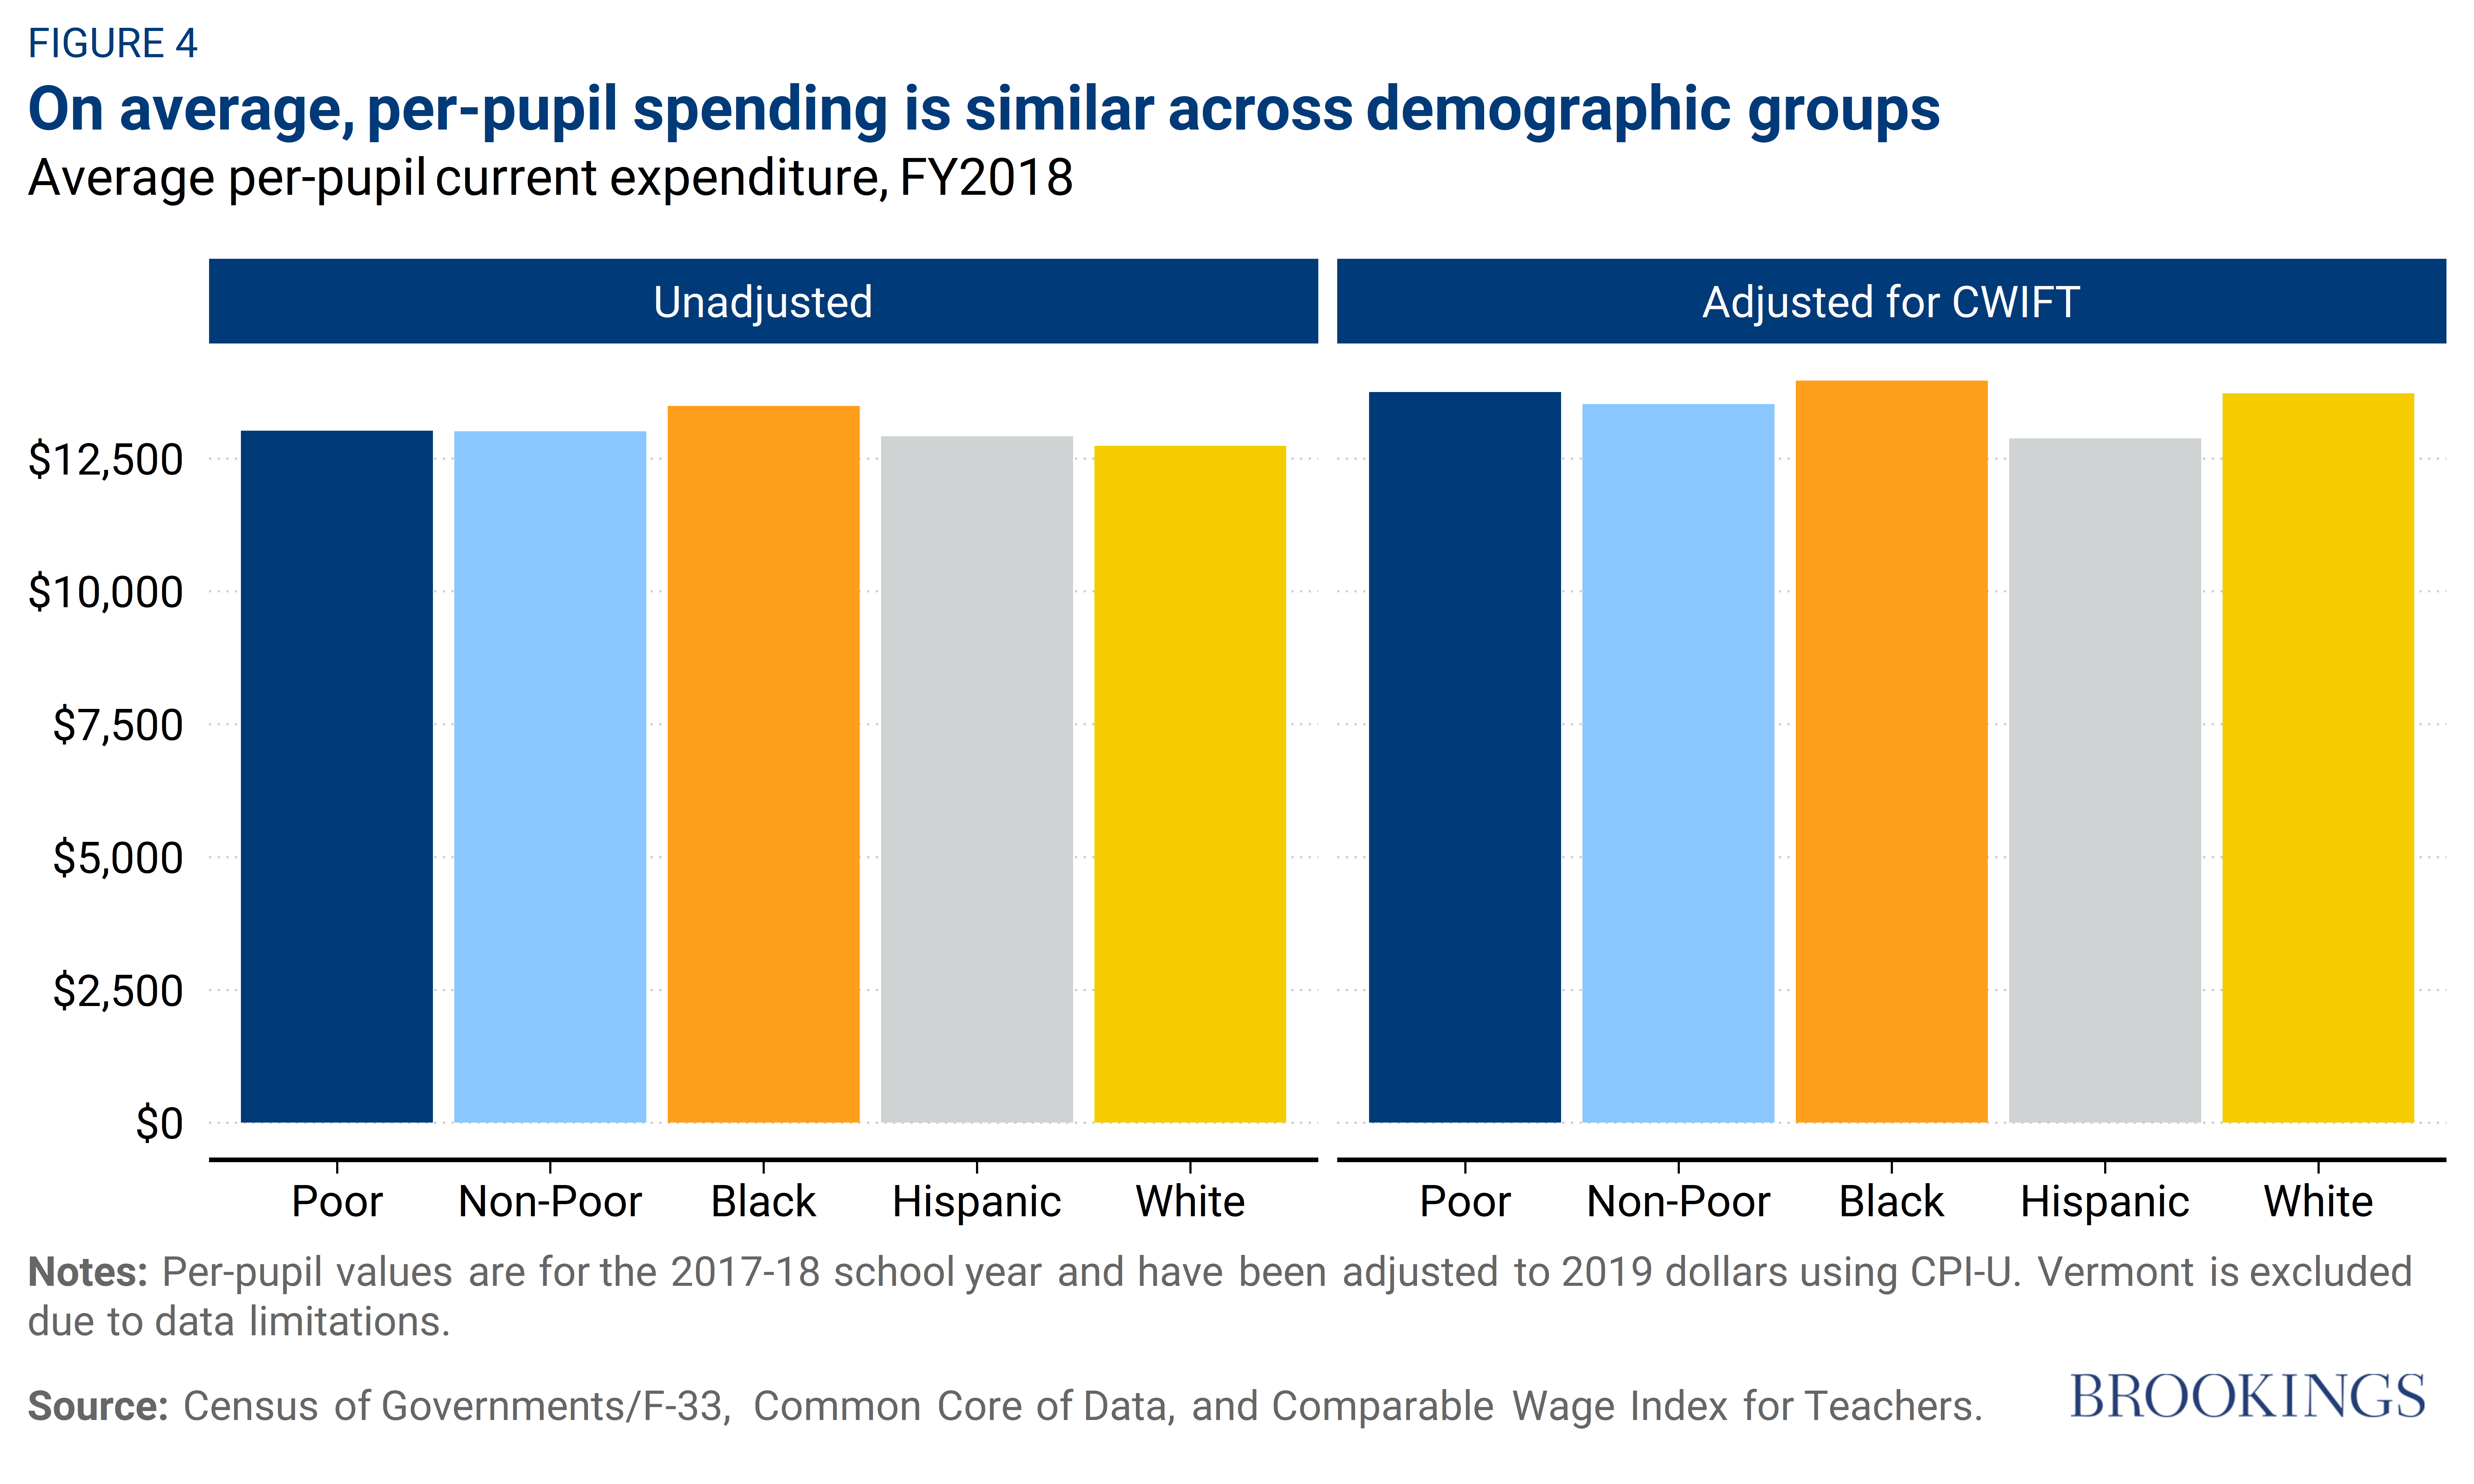
Figure 4 gives a flavor of the wide variation in per-pupil school spending. Nationally, the district at the 10th percentile had per-pupil current expenditure of $8,800, compared to $18,600 at the 90th percentile (for these calculations we focus on current expenditure, which is less volatile year-to-year, rather than revenue). Figure 4 shows that this variation is notably not systematically related to key demographics. For example, on average, poor students attend school in districts that spent $13,023 compared to $13,007 for non-poor students. The average Black student attends school in a district that spent $13,485 per student, compared to $12,918 for Hispanic students and $12,736 for White students.4 School districts in high-wage areas need to spend more to hire the same staff, but adjusting spending to account for differences in prevailing wages of college graduates (the second set of bars) does not change the picture much.
Does this mean the allocation of spending is fair? Not really. First, to make progress reducing the disparities in outcomes discussed above, schools serving more disadvantaged students will need to spend more on average. Second, these data are measured at the school district level, lumping all schools together. This potentially masks inequality across (as well as within) schools in the same district.
The federal government now requires states to report some spending at the school level; states have only recently released these data. One study using these new data finds that within districts, schools attended by students of color and economically-disadvantaged students tend to have more staff per pupil and to spend more per pupil. These schools also have more novice teachers. How could within-district spending differences systematically correlate with student characteristics, when property taxes and other revenues for the entire district feed into the central budget? Most of what school districts buy is staff, and compensation is largely based on credentials and experience. So schools with less-experienced teachers spend less per pupil than those with more experienced ones, even if they have identical teacher-to-student ratios. Research suggests schools enrolling more economically disadvantaged students, or more students of color, on average have worse working conditions for teachers and experience more teacher turnover. Together, this means that school districts using the same staffing rules for each school—or even allocating more staff to schools serving more economically disadvantaged students—would have different patterns in spending per pupil than staff per pupil.
Footnotes
[1]: For state-specific information, consult state agency websites (e.g., Maryland State Department of Education) for more details. You can find data for all 50 states at the U.S. Department of Education’s National Center for Education Statistics, and information on state-specific policies at the Education Commission of the States.
[2]: The numbers in this section are based on the most recent data available in the Digest of Education Statistics, all of which were collected prior to the COVID-19 pandemic.
[3]: See the not-for-profit National Council on Teacher Quality for standards and reviews of teacher preparation programs, and descriptions of state teacher preparation policies.
[4]: These statistics may be particularly surprising to people given the widely publicized findings of the EdBuild organization that, “Nonwhite school districts get $23 billion less than white school districts.” The EdBuild analysis estimates gaps between districts where at least 75% of students are non-White versus at least 75% of students are White. These two types of districts account for 53% of enrollment nationally. The $23 billion refers to state and local revenue (excluding federal revenue), whereas we focus on current expenditure (though patterns for total expenditure or total revenue are similar).
Disclosures: The Brookings Institution is financed through the support of a diverse array of foundations, corporations, governments, individuals, as well as an endowment. A list of donors can be found in our annual reports published online here. The findings, interpretations, and conclusions in this report are solely those of its author(s) and are not influenced by any donation.
About the Authors