There are wide gender gaps in education in the U.S. and across the economically advanced nations, as I describe in my new book Of Boys and Men: Why the Modern Male Is Struggling, Why It Matters, and What to Do about It (Brookings Institution Press, 2022).
But how does the gender gap in educational outcomes vary across the U.S.? That’s the question addressed in this note and accompanying interactives.
In every U.S. state, young women are more likely than their male counterparts to have a bachelor’s degree. The education gender gap emerges well before college, however: girls are more likely to graduate high school on time and perform substantially better on standardized reading tests than boys (and about as well in math). In this piece, we dive into how these gaps differ — or stay the same — across the U.S.
Girls getting degrees
In 1970, just 12 percent of young women (ages 25 to 34) had a bachelor’s degree, compared to 20 percent of men — a gap of eight percentage points. By 2020, that number had risen to 41 percent for women but only to 32 percent for men — a nine percentage–point gap, now going the other way. That means there are currently 1.6 million more young women with a bachelor’s degree than men. To put it into perspective, that’s just less than the population of West Virginia.
Related Books

The U.S. made great strides in improving overall educational attainment in the last fifty years, but progress has been uneven across states and by gender. We show here the share of those ages 25 to 34 with a bachelor’s degree or higher by state using the American Community Survey. Figure 1 shows the share of young adults with a bachelor’s degree or higher in every U.S. state, by sex. (See the same figure for the largest 25 metro areas here).
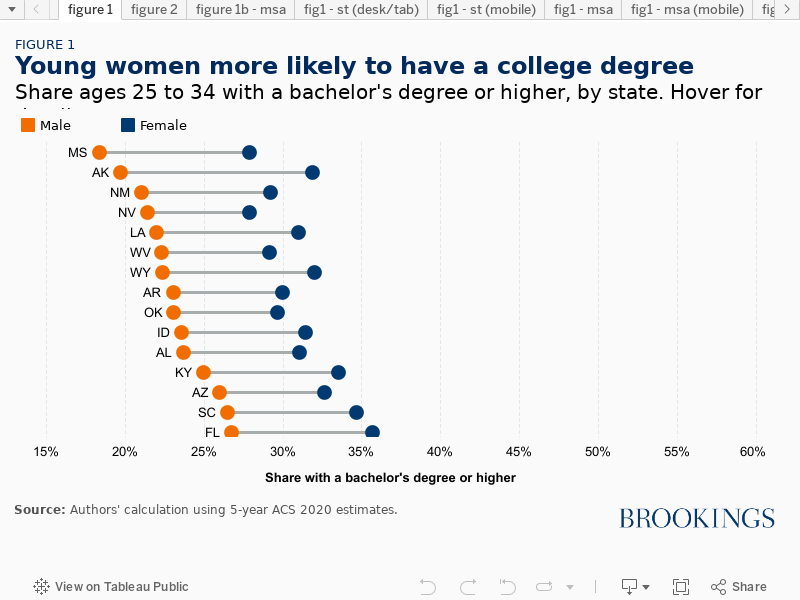
Both the gender gap and total educational attainment vary across the states. Young adults in Mississippi, for instance, are less likely to have a bachelor’s than young adults in any other state. The share of Mississippi young men with a bachelor’s degree in 2020 was just 18 percent — two points lower than the U.S. male share in 1970. By contrast, about half of men (49 percent) had a bachelor’s degree in Massachusetts, which is higher than the share of women with a bachelor’s degree in all but three states.
Although there are many more college grads in Massachusetts than in Mississippi, in both states young women are about ten percentage points more likely to have a bachelor’s than their male peers (the length of the gray bars). To account for the wide variation in overall attainment rates, we also show the ratio of women to men with a bachelor’s degree (just hover over a state to see this number). For example, Mississippi’s young women are 52 percent more likely than men to have a bachelor’s, and Massachusetts’ young women are 19 percent more likely.
North Dakota has the largest percentage point gender gap (14 points), while Alaska has the largest ratio gender gap (61 percent). Utah has the smallest gender gap by both measures, with women just four points (14 percent) more likely to have a bachelor’s than men.
High school graduation
Just as young women are more likely than young men to have a bachelor’s degree, girls are more likely than boys to graduate high school across the country.
As we described last year, states are not required to report the preferred on-time high school graduation measurement by sex to the federal government, even though they are required to report this information for many subgroups, including each “major racial and ethnic group,” economically disadvantaged students, homeless students, and English learners. But because they are already collecting the information necessary to calculate the rate, many state Departments of Education independently publish their high school graduation rates by sex.
The 33 states with available graduation data in 2021 account for over two thirds of the total national cohort. We use these states to gauge the national trend: we estimate [1] that 88.4 percent of girls graduated on time in 2021 compared to 81.9 percent of boys – a gap of 6.5 points. Figure 2 shows the share of high school freshmen who graduated from high school on time in 2021 by gender in the 33 states with available data.
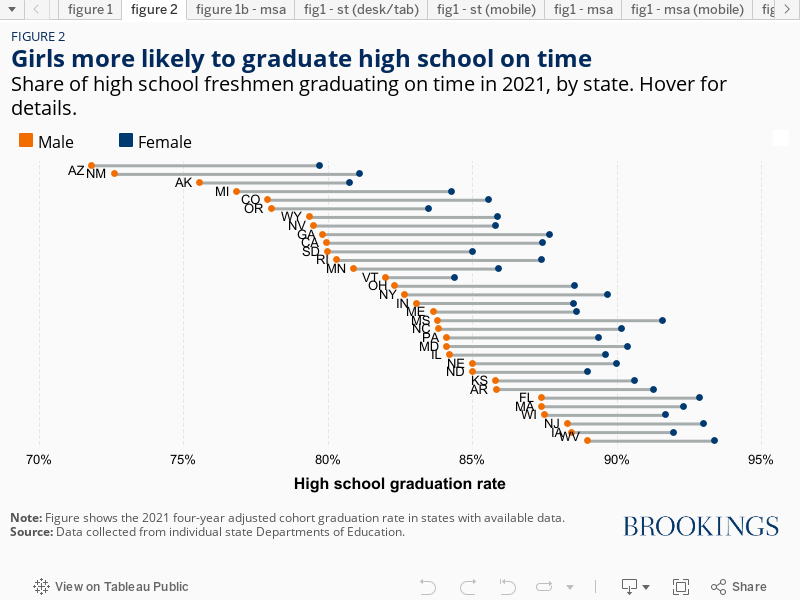
Again, there are big differences between states both in the overall level of high school graduation and in the size of the gender gap. On-time graduation rates range from a low of 72 percent for Arizona boys to 93 percent among West Virginia girls. Girls are between three percent (Vermont) and 12 percent (New Mexico) more likely than boys to graduate on time.
Boys and girls in grade school
But even before high school, boys are falling behind. We use state-level Math and Reading Language Arts testing data from the Educational Opportunity Project at Stanford University to show the gender gaps in each subject across grades four and eight.
Figure 3 shows the U.S. gender gap in English and Math achievement test scores in grade-level equivalents. (See the gender gap for the top 25 metro areas [2] here.) Girls outperform boys in reading by more than 40 percent of a grade level in every state. In ten states (the ones in dark blue on the map), girls are more than a full grade level ahead of boys. In math, by contrast, boys have a slight advantage in some states, though the gender gap in either direction is less than a quarter of a grade level in most states.
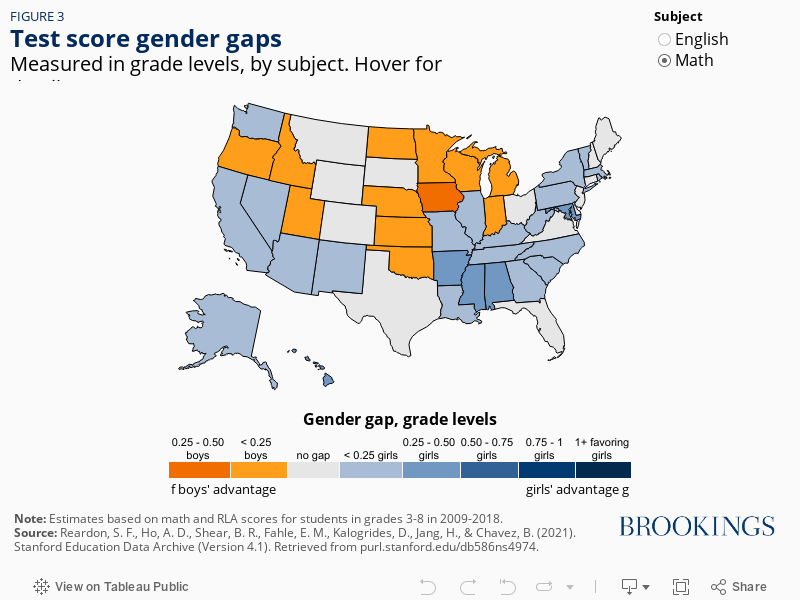
Table 1 shows states ranked by the size of their overall test score gender gap, regardless of if the gap favors boys or girls, in both English and Math and their rankings separately for each subject.
Table 1: Test score gender gap rankingsStates, sorted by their overall gender gap (regardless of if favoring girls or boys) |
||||||
|---|---|---|---|---|---|---|
| Total | English | Math | ||||
| State | Rank | Gap | Rank | Gap | Rank | Gap |
| Arkansas | 1 | -0.83 | 1 | -1.37 | 5 | -0.27 |
| Hawaii | 2 | -0.73 | 7 | -1.10 | 1 | -0.37 |
| West Virginia | 3 | -0.68 | 2 | -1.25 | 18 | -0.13 |
| Maryland | 4 | -0.68 | 6 | -1.11 | 6 | -0.25 |
| Massachusetts | 5 | -0.66 | 3 | -1.17 | 16 | -0.14 |
| Mississippi | 6 | -0.63 | 19 | -0.9 | 2 | -0.37 |
| Rhode Island | 7 | -0.62 | 4 | -1.15 | 23 | -0.09 |
| Louisiana | 8 | -0.62 | 9 | -1.05 | 11 | -0.19 |
| Vermont | 9 | -0.60 | 5 | -1.13 | 30 | -0.07 |
| New Mexico | 10 | -0.57 | 14 | -0.94 | 10 | -0.20 |
| Alabama | 11 | -0.56 | 27 | -0.83 | 3 | -0.30 |
| Georgia | 12 | -0.54 | 21 | -0.88 | 12 | -0.19 |
| Maine | 13 | -0.54 | 8 | -1.07 | 50 | 0 |
| Illinois | 14 | -0.54 | 16 | -0.92 | 14 | -0.15 |
| Kentucky | 15 | -0.53 | 24 | -0.84 | 8 | -0.22 |
| South Carolina | 16 | -0.53 | 26 | -0.84 | 7 | -0.22 |
| Washington | 17 | -0.52 | 12 | -0.95 | 22 | -0.09 |
| Alaska | 18 | -0.51 | 18 | -0.9 | 17 | -0.14 |
| New Hampshire | 19 | -0.51 | 10 | -1.03 | 45 | 0.01 |
| Tennessee | 20 | -0.51 | 29 | -0.82 | 9 | -0.20 |
| Arizona | 21 | -0.51 | 22 | -0.86 | 13 | -0.15 |
| New Jersey | 22 | -0.5 | 11 | -0.97 | 39 | -0.04 |
| Nevada | 23 | -0.49 | 17 | -0.91 | 27 | -0.08 |
| Pennsylvania | 24 | -0.49 | 15 | -0.92 | 38 | -0.05 |
| Missouri | 25 | -0.45 | 25 | -0.84 | 31 | -0.07 |
| California | 26 | -0.45 | 28 | -0.82 | 21 | -0.1 |
| Indiana | 27 | -0.44 | 13 | -0.94 | 34 | 0.06 |
| New York | 28 | -0.44 | 31 | -0.81 | 28 | -0.07 |
| Colorado | 29 | -0.44 | 20 | -0.90 | 42 | 0.03 |
| Montana | 30 | -0.41 | 23 | -0.84 | 43 | 0.02 |
| Delaware | 31 | -0.39 | 32 | -0.77 | 46 | -0.01 |
| Ohio | 32 | -0.37 | 34 | -0.72 | 47 | -0.01 |
| South Dakota | 33 | -0.36 | 37 | -0.71 | 44 | -0.01 |
| North Dakota | 34 | -0.35 | 33 | -0.75 | 37 | 0.05 |
| Utah | 35 | -0.34 | 30 | -0.81 | 19 | 0.12 |
| North Carolina | 36 | -0.34 | 47 | -0.54 | 15 | -0.14 |
| Virginia | 37 | -0.34 | 40 | -0.65 | 25 | -0.08 |
| Wisconsin | 38 | -0.32 | 38 | -0.70 | 33 | 0.06 |
| Michigan | 39 | -0.32 | 35 | -0.71 | 32 | 0.06 |
| Connecticut | 40 | -0.32 | 41 | -0.64 | 49 | 0 |
| Texas | 41 | -0.32 | 44 | -0.6 | 40 | -0.04 |
| Oregon | 42 | -0.31 | 36 | -0.71 | 24 | 0.09 |
| Florida | 43 | -0.3 | 45 | -0.59 | 48 | -0.01 |
| Minnesota | 44 | -0.29 | 42 | -0.63 | 35 | 0.06 |
| Wyoming | 45 | -0.29 | 43 | -0.61 | 41 | 0.04 |
| Idaho | 46 | -0.28 | 39 | -0.66 | 20 | 0.1 |
| Oklahoma | 47 | -0.23 | 46 | -0.55 | 26 | 0.08 |
| Kansas | 48 | -0.23 | 49 | -0.51 | 36 | 0.06 |
| Nebraska | 49 | -0.22 | 48 | -0.52 | 29 | 0.07 |
| Iowa | 50 | -0.08 | 50 | -0.44 | 4 | 0.28 |
|
Note: Estimates based on math and RLA scores for students in grades 3-8 in 2009-2018. Gender gap estimates indicate the grade-levels difference between the state’s average girl and average boy. A negative gap indicates that girls are outperforming boys. Some gaps may not be statistically significant.Source: Reardon, S. F., Ho, A. D., Shear, B. R., Fahle, E. M., Kalogrides, D., Jang, H., & Chavez, B. (2021). Stanford Education Data Archive (Version 4.1). Retrieved from purl.stanford.edu/db586ns4974. |
||||||
Understanding the dynamics of the gender gaps in education, especially for less–advantaged boys and men, is essential to informing policy solutions, including those in the book and in our related work. The variation in disparities between different cities and states may well offer useful lessons here. The new Boys and Men Project at Brookings will be digging deeper into these questions in the coming months, so stay tuned. (Also, consider subscribing to my Of Boys and Men newsletter to keep up to date).
The Brookings Institution is financed through the support of a diverse array of foundations, corporations, governments, individuals, as well as an endowment. A list of donors can be found in our annual reports published online here. The findings, interpretations, and conclusions in this report are solely those of its author(s) and are not influenced by any donation.
Footnotes:
[1] Along with our colleague, Simran Kalkat.
[2] Some large metropolitan areas (Consolidated Metropolitan Statistical Areas (CMSAS)) are divided into Metropolitan Area Divisions. These divisions (e.g., Warren), which are also large, are treated as separate metropolitan areas for analysis purposes. See Fahle, E. M., Chavez, B., Kalogrides, D., Shear, B. R., Reardon, S. F., & Ho, A. D. (2021). Stanford Education Data Archive: Technical Documentation (Version 4.1).
Related Content


Authors


Commentary
Boys left behind: Education gender gaps across the US
October 12, 2022