The Biden administration recently announced it will forgive roughly $500 billion in student debt. Up to $20,000 in debt will be forgiven for Pell Grant recipients and $10,000 for other borrowers. Borrowers whose income was under $125,000 ($250,000 if married) in either 2020 or 2021 are eligible.
In its Fact Sheet, the White House explains its objectives. It says it wants to target relief on low- and middle-income borrowers—particularly Black borrowers, borrowers who didn’t get a degree, and those who have defaulted on their student loans. There is no doubt that these borrowers struggle the most with their loans and represent the most disadvantaged groups of borrowers.
Hence, it’s important to understand how well the debt forgiveness policy targeted relief to these groups, both to evaluate whether it achieves the stated objectives and to inform the design of future changes to grant and loan programs that are intended to help low- and middle-income groups pay for college. What elements of the debt relief policy benefitted borrowers from low-income households, Black borrowers, borrowers without a degree, and defaulted borrowers? How much did the relief cost (in federal budget terms) for Pell and non-Pell borrowers? How much of the total budget of relief was spent on each group?
To answer these questions, I draw on publicly available data from the Department of Education (the Beginning Postsecondary Survey 2004/2009), which asks a representative sample of students who started school in 2004 questions about their demographic and economic backgrounds, their educational attainment, and use of financial aid (including federal loans) over the subsequent 12 years. It’s probably the best available survey of student loan borrowers relevant for understanding the recent debt relief policy, although it doesn’t include information about borrowers’ post-college earnings.
Because the data from BPS includes information on both Pell Grant receipt and federal student loans, it offers insight into one of the most important design elements of the debt relief policy: distinguishing between Pell Grant recipients and borrowers who didn’t get Pell Grants, and providing more relief to the former than the latter.
Pell is a means-tested program. Eligibility is determined by strict income and asset tests, or participation in means-tested programs, while students are undergraduates. That means virtually all Pell recipients are from families earning less than $60,000 a year, and most earn much less. Black students are twice as likely to qualify for Pell grants than white students. Hence, Pell eligibility is a highly effective way to target financial aid to disadvantaged groups. Indeed, technocrats in Washington (including me) have argued that concentrating student loan debt forgiveness on Pell Grant recipients would be an effective and coherent way to provide relief to those who need it most.
In contrast to Pell Grants, federal student loans are not means-tested. Students of any income can qualify. Students do need to fill out a Free Application for Federal Student Aid (FAFSA). If their income or assets are too high (or if they are graduate students), they are ineligible for a Pell Grant but remain eligible for student loans. In other words, by definition, borrowers who have federal student loans but have never had a Pell Grant were either too rich to qualify for Pell Grants as undergraduates or chose not to apply for financial aid.
The table below uses the BPS data and information from the White House Fact Sheet to compare the amount of relief, my estimates of the cost of that relief, and the characteristics of the borrowers in each of the two groups.[1]
In total, the policy discharges about $500 billion in debt. Of that, 72% (or $360 billion) was owed by Pell grant recipients. While Pell Grant recipients could have gotten up to $20,000 in relief, the actual average amount of relief they got was about $13,300 because many of them owe less than $20,000 (and many less than $10,000).
Moreover, the $360 billion in forgiveness for Pell recipients did not cost the government $360 billion because most of those loans were never going to be paid in full (in present value, which is how loans are accounted for federal budget purposes). More than a third of Pell grant recipients, for example, have defaulted on their loans within 12 years of enrolling in school; they represent about 90 percent of all defaulted borrowers. Drawing on data of borrower’s payments, Catherine and Yannelis estimate that the lowest-earning 40% of borrowers will repay (in net present value) only about $0.45 of each $1 owed. In the table, I assume more conservatively that Pell Grant borrowers will repay $0.70 on the dollar. In that case, the budget cost would be about $250 billion. On a per-borrower basis, that implies the policy cost about $9,260, on average, over the 27 million Pell recipients expected to benefit.
Considered as a standalone policy, the relief provided to Pell recipients involved a modest budget cost, and its effect on boosting inflation will probably be small. It is cost effective in the sense that it provides significant debt reduction per dollar of budget cost.
In contrast, borrowers who did not receive Pell Grants rarely default, have higher rates of loan repayment, and pay more in interest because they owe unsubsidized undergraduate loans and graduate loans which carry the highest interest rates (and thus are expected to repay more than $1 per each $1 in debt they owe). For those reasons, the cost of forgiving $140 billion of their loans is likely much closer to $140 billion. On a per borrower basis, that means the cost of providing $10,000 in relief to the 16 million borrowers in this group was about $8,750.
In other words, the administration spent roughly the same amount per borrower on Pell Grant recipients as it did on other borrowers, even though Pell grant recipients are from much more disadvantaged backgrounds.
How disadvantaged? The table describes the characteristics of the two groups. Pell Grant recipients are more likely to be poor, have worse educational outcomes, are more likely to be Black, and come from less educated families relative to other college and graduate students and the broader U.S. population. For example, Pell Grant recipients were 23% Black and 17% Hispanic. Only 23% had achieved a BA degree by 2009 (five years after first enrollment); 55% dropped out without earning any degree or credential.
They are disproportionately from poor families: 42% of dependent Pell Grant recipients’ parents were in the bottom 25% of the income distribution when they started college, and almost none are in the top quintile. Few of their parents had either a BA (28%) or a graduate degree (11%). They are a substantially disadvantaged group.
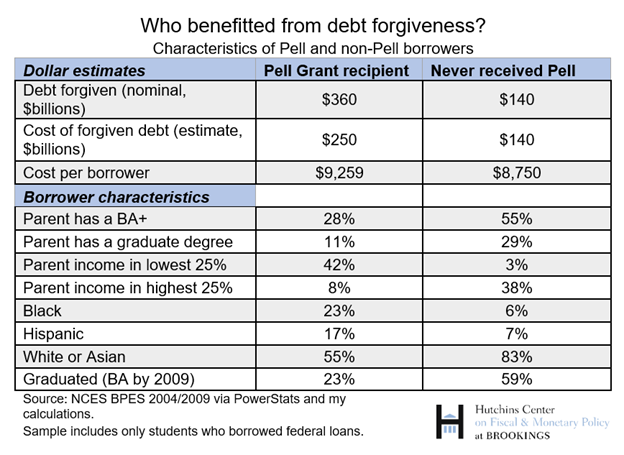
In contrast, borrowers who had never received Pell are relatively affluent—both in comparison to those who received Pell and to average American households. Only 6% are Black and 7% Hispanic; 83% are white or Asian. Their parents are well educated and affluent: 55% have a BA and 29% a graduate degree (which makes them twice as likely to have a graduate degree as the average American). 38% grew up in the top 25% of the income distribution and only 3% at the bottom. And they are much more likely to have competed a BA. Almost 60% completed a BA degree after five years of enrollment (which is above average for U.S. college students). In all, 70% earned a credential of some kind, including an associate’s degree or a certificate.
One takeaway from the table is that the aggregate dollar amount of debt relief provided can be a misleading indicator of how much is spent per borrower. The $20,000 of relief afforded to Pell recipients costs about the same amount, on a per-borrower basis, as the $10,000 in relief afforded to the non-Pell group because of differences in how much Pell students owe and their expected ability to repay.
A second key takeaway is how effective means testing is at identifying and targeting disadvantaged groups. In fact, 89% of all Black borrowers and 84% of Hispanic borrowers have received a Pell Grant. Pell borrowers represent 90% of borrowers in default. And 79% of all dropouts were Pell Grant recipients. If the goal was to help these specific groups, why not spend all the money on them, rather than spending the same amount on non-Pell borrowers as Pell recipients?
Looking ahead, Biden has proposed a substantial increase in the Pell Grant, which would increase the number of middle-class borrowers who are eligible (because of how the grant is calculated) and reduce Pell recipients’ out-of-pocket costs for college (and reduce or eliminate their need to borrow). As the table above suggests, that aid is well targeted to students without the family means to afford college up front or the ability to repay afterwards.
At the same time, Biden has also proposed expanding the generosity of Income-Driven Repayment plans for future borrowers so many of them will repay less than they borrow. Many of the benefits and a large share of the cost of that plan will accrue to borrowers who have not received a Pell Grant. Like untargeted debt relief policies, that relief will not be progressive, and will cost more and benefit more advantaged groups than other important spending programs do.
[1] The table reflects the number of borrowers in each group the White House expects to benefit, including the effect of the $125,000/$250,000 income limit. However, because the BPS data does not include the current income of borrowers, I have not adjusted the borrower characteristics to account for the potential effect of the income limit. Because the income limit is high and few borrowers are affected, it’s not clear that it would substantially change the demographic characteristics within each group.
The Brookings Institution is financed through the support of a diverse array of foundations, corporations, governments, individuals, as well as an endowment. A list of donors can be found in our annual reports published online here. The findings, interpretations, and conclusions in this report are solely those of its author(s) and are not influenced by any donation.
Authors


Commentary
Does Biden’s student debt forgiveness achieve his stated goals?
September 26, 2022