This piece was originally published in May 2022. It has since been updated.
Housing represents about one-third of the value of the market basket of goods and services that the Bureau of Labor Statistics (BLS) uses to track inflation in the Consumer Price Index (CPI). A rise in the cost of housing—what the BLS calls shelter—contributed to high inflation in 2022 and 2023. Measuring changes in shelter costs is more difficult than measuring changes in everyday prices like groceries and gasoline. This post explains how the BLS measures changes in the cost of housing for renters and homeowners in the CPI.
How does the BLS calculate the price of shelter?
For rental properties, the BLS counts cash rent paid to the landlord for shelter and included utilities, plus any government subsidies paid to the landlord on the tenant’s behalf. If a unit is owner-occupied, the BLS computes what it would cost to rent that home in the current housing market, known as Owners’ Equivalent Rent (OER). Utilities paid by homeowners are measured separately in the CPI.
Why does the BLS use OER instead of house prices?
The CPI aims to capture the change in the prices of goods and services consumed by households over time. For housing, the BLS wants to capture the change in the consumption value of a home—the price of the shelter it provides—not the change in the value of the home outright. Therefore, the BLS uses changes in the rental value (the OER) to measure the cost of shelter for homeowners. For example, if a family buys a house for $300,000 in 2024 and lives there for 10 years, their shelter consumption is not $300,000 in 2024, and zero in subsequent years—nor is it their monthly mortgage payment, which will vary based on their down payment, the maturity of the loan, and the interest rate at the time they purchased the house. Rather, their shelter consumption is the amount they would have spent to consume the same amount of housing services provided by their owner-occupied home.
Where does the BLS get data on shelter prices?
The BLS collects rent data for about 40,000 residences through personal visits or telephone calls. The sample is divided into six panels, each of which is sampled every six months on a staggered basis. The first panel is sampled in January and July, the second in February and August, and so forth. Since rents don’t usually change frequently, comparing samples over six months allows the BLS to pick up more meaningful changes. One panel is replaced each year to keep the housing sample representative.
The CPI measures price growth for the same basket of goods and services over time, so the BLS adjusts for changes in the quality of housing over time. The adjustments account for the age of the property, neighborhood improvements, and physical renovations to the home like a new bathroom or air conditioning system.
The BLS uses rent data to impute OER based on rents for comparable rental housing in the area.
What are the potential problems with the estimation of OER?
Finding rental housing that is comparable to an owner-occupied unit can be difficult. Predominantly renter-occupied neighborhoods are often geographically separate from owner-occupied ones—consider a city center versus a suburb. Even within the same area, housing characteristics can vary widely across rental and owner-occupied units—for example, the owner-occupied units in a neighborhood may be single-family homes, while the rental units may be multi-family buildings. Finding comparable rental housing is particularly difficult for large, expensive single-family homes.
Why are rents in the CPI rising much faster than market rents in early 2024?
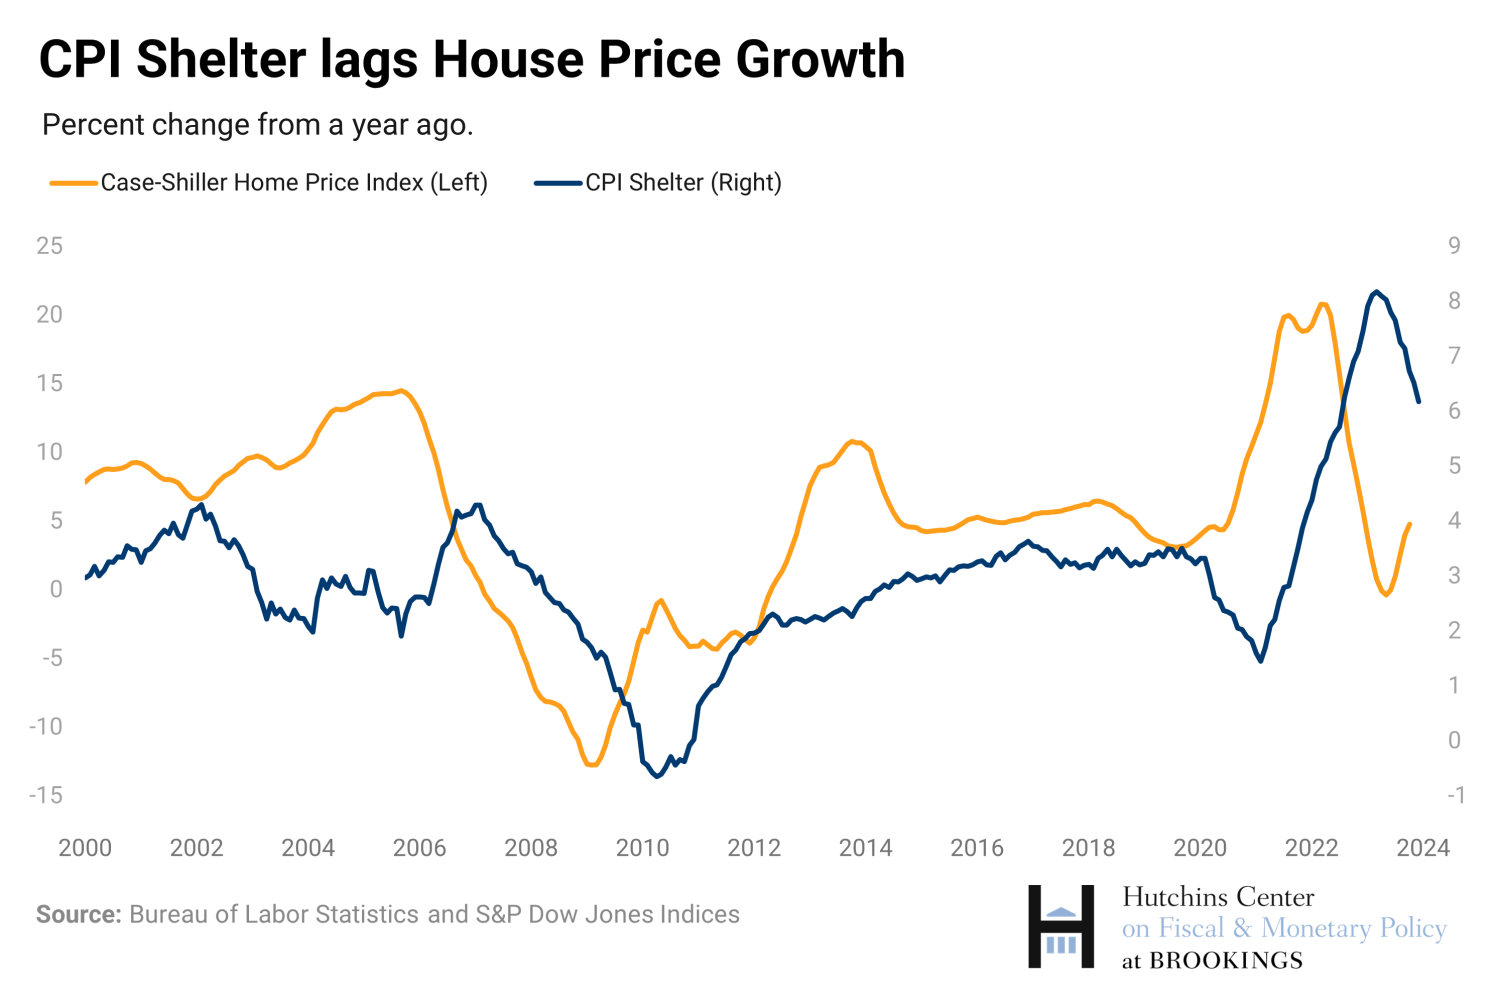
The measure of the rents in the CPI tends to lag well-known indices of market rents like the Zillow Observed Rent Index and the CoreLogic Single Family Rent Index. CPI rent inflation rose only moderately in 2022, while market rents were soaring (see figure). More recently, CPI rent inflation has been much higher than Zillow and CoreLogic rent inflation.
This lag occurs for a few reasons. First, the market indices capture rents of units currently on the market, not rents for units occupied by continuing renters, like the CPI does. Rents change when leases expire, which typically happens annually. In addition, landlords may be less likely to raise rents to market prices for continuing tenants, and so it might take even longer for rents on all units to catch up with rents charged to new tenants. Second, because the BLS only examines rents every six months, it can’t know exactly when the rent changed. The BLS assumes that the rent increased gradually over the six months, meaning that only about one-sixth of the total observed increase in rent is attributed to the month the unit is sampled.1 For example, if the BLS observed that rent increased from $2,000 per month in January 2022 to $2,400 per month in July 2022—a 20% increase—it would assume that the increase in rent in July 2022 for that unit was 3%, roughly one-sixth of 20%. That means that an unusual increase in rents will only fully show through with a lag in the CPI.
In late 2022, researchers at the BLS and Cleveland Fed introduced an experimental quarterly index of new tenant rent (New Tenant Rent Index) using a very similar method to the Zillow index and data from the CPI Housing Survey. This index tracks market rents by only using observations in the CPI dataset that follow a change in tenant. The New Tenant Rent Index accounts for changes in the price of utilities, depreciation, and remodeling between tenants. Like the Zillow and CoreLogic indices, the New Tenant Rent Index will likely be a leading indicator for the shelter component of CPI.
Indicators of market rents, including Zillow, CoreLogic, and the New Tenant Rent Index, show that rent inflation for new tenants is at or below pre-pandemic levels, while CPI rent inflation remains elevated. This suggests that CPI rent inflation will decline over 2024 or 2025.
How do house prices affect the CPI measure of homeownership costs?
House prices and rental prices are determined by supply and demand factors that don’t always move in tandem. For example, if demand for houses rises because mortgage rates fall, house prices will rise but rents will not. If construction costs increase, on the other hand, the price of both rental and owner-occupied housing would likely rise.
Over time, changes in house prices do predict changes in rents—although the relationship is far from one-to-one and occurs with long lags. Xiaoqing Zhou and Jim Dolmas of the Dallas Fed find that the correlation between house price growth and OER inflation peaks at about 0.75 after 16 months.
Related Content


Authors


-
Acknowledgements and disclosures
The Brookings Institution is financed through the support of a diverse array of foundations, corporations, governments, individuals, as well as an endowment. A list of donors can be found in our annual reports published online here. The findings, interpretations, and conclusions in this report are solely those of its author(s) and are not influenced by any donation.
-
Footnotes
- Specifically, the BLS assumes a constant growth rate for the rent increase, so that the sixth root of the increase is assumed to have occurred in the sample month.


Commentary
How does the Consumer Price Index account for the cost of housing?
January 31, 2024