Several economic studies, including many of our own (here and here), have found evidence of a significant downturn in human well-being during the midlife years—the so-called “happiness curve.” Yet several other studies, particularly by psychologists, suggest that there either is no midlife dip and/or that it is insignificant or “trivial.” We disagree. Given that this phenomenon reaches much of the world’s population, its association with other behaviors that are indicative of poor psychological and physical health, and the current COVID-19 pandemic, we believe it is important to resolve this debate.
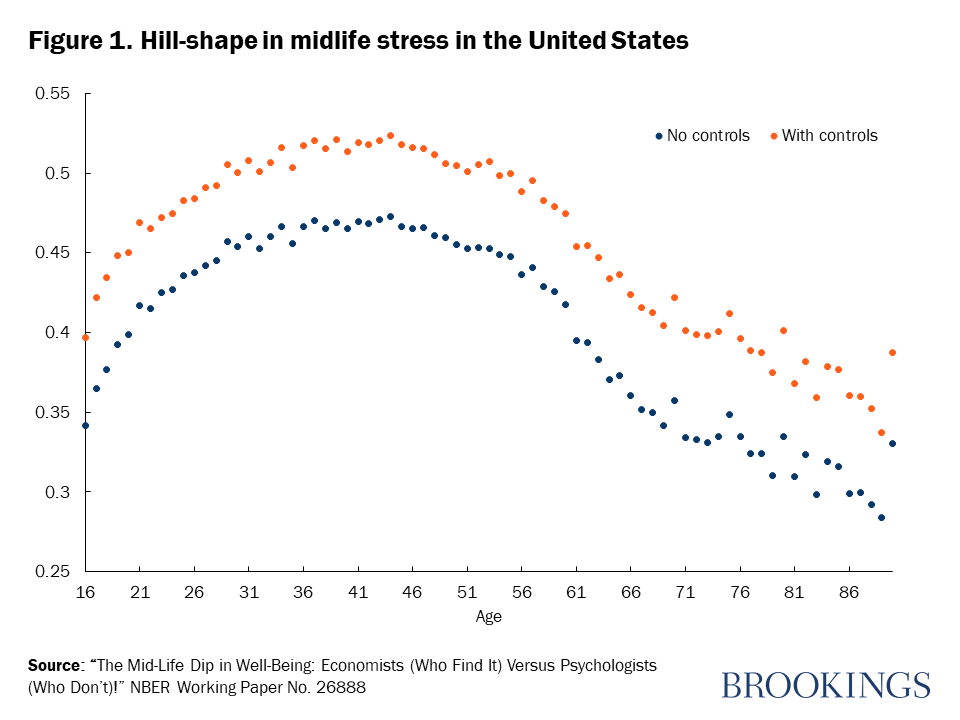
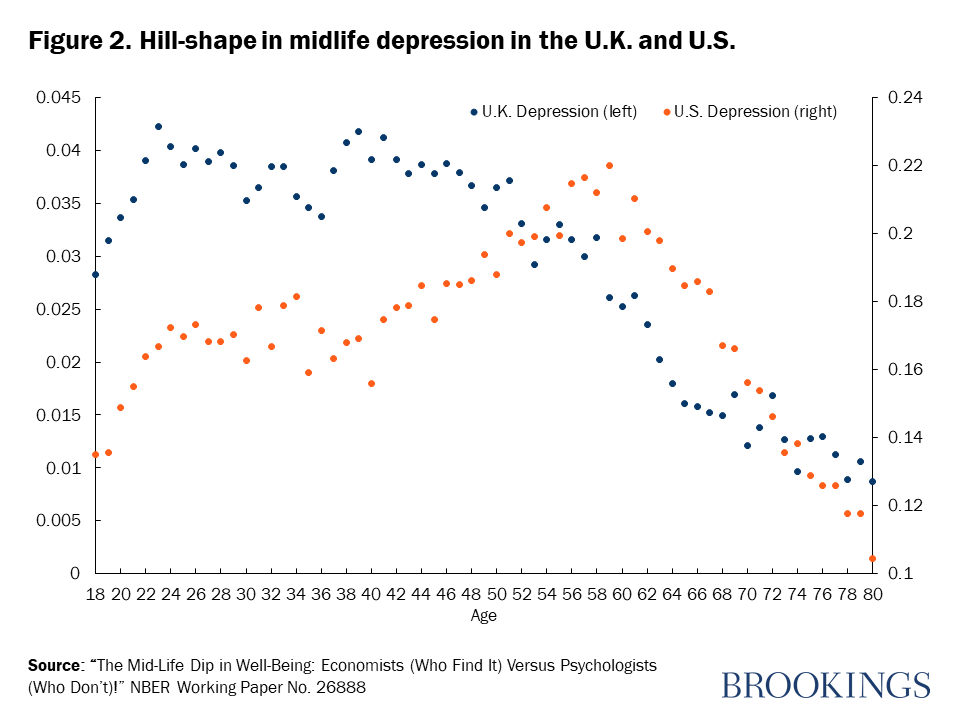
The early work on this topic revealed a U-curve in life satisfaction and happiness over the life cycle. The research now extends across multiple data sets to trends in unhappiness, stress, lack of sleep, depression, and even suicide. There is a hill-shape in antidepressant use which maximizes in the mid-40s in European countries, and a midlife hill-shape in lack of sleep and sleep duration based on Behavioral Risk Surveillance System (BRFSS) data for the U.S., which in turn tracks closely with trends in reported depression. Several studies have shown that not getting enough sleep at night is generally associated with daytime sleepiness and fatigue, depressed mood, poor daytime functioning, and other health and safety problems. The U-shape pattern in midlife even extends beyond humans to apes, who exhibit a downturn in indicators of their cheerfulness in their middle-aged years.
Most recently, the increases in the U.S. deaths of despair due to drugs, alcohol, and suicide occur precisely in the middle-aged, 35-64 years. The trends in these deaths—which are responsible for driving up the overall mortality rate—have a robust association with the same ill-being markers—unhappiness and stress—that increase in midlife.
A recent analysis by the OECD’s How’s Life study (2020) shows that deaths of despair by suicide, alcohol abuse, or drug overdoses are higher in 10 OECD countries—Slovenia, Lithuania, Latvia, Korea, Denmark, Belgium, Hungary, Austria, Finland, and Poland—than they are in the United States. Chronic depression and suicide also occur disproportionately at midlife in Europe.
Early studies in the psychology literature were based on very small samples, which made them incomparable to large-N economic studies. Yet a recent study in Psychological Science was based on millions of respondents in the data from the 2005-2016 Gallup World Poll; it examined age and three measures of well-being, and concluded that the midlife dip in well-being is insignificant and/or trivial. The authors look at unadjusted, raw patterns in the data, but they compare those to general patterns from regressions with a battery of socioeconomic controls in our papers (noted above).
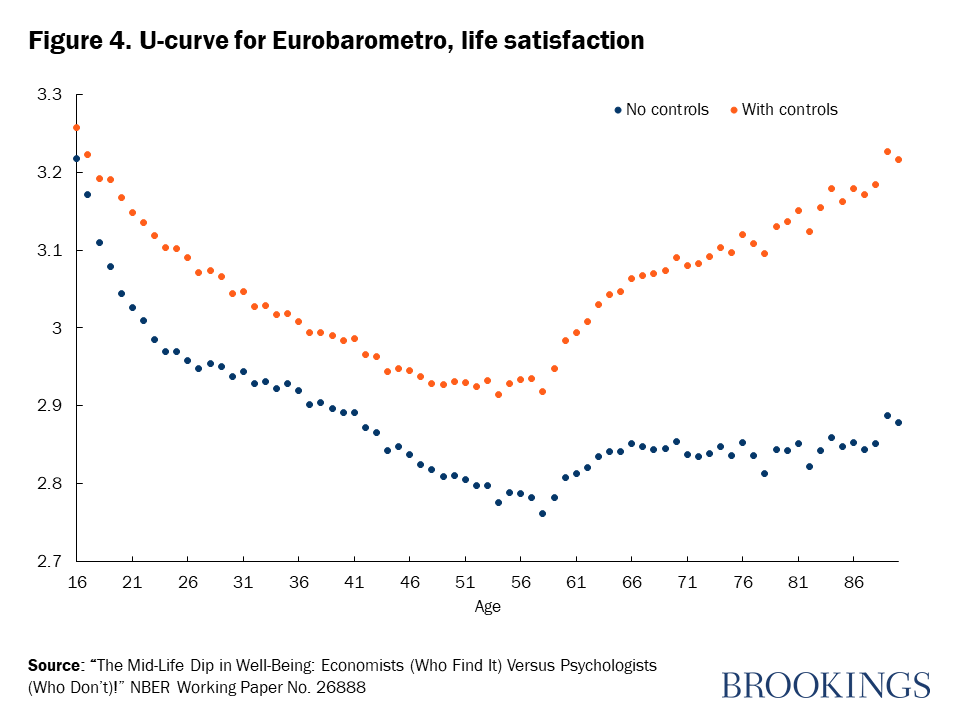
As such, they are not comparing like with like. Specifications with controls, as in our studies, capture the pure effects of aging, controlling for the confounding well-being effects of things that may change as people age. The specification without controls reflects the effects of aging and these confounding factors. Neither specification is right or wrong, rather they are addressing different questions.
The non-control or descriptive approach measures the “total” effect of age on well-being. In contrast, the ceteris-paribus analytical approach measures the marginal effect of age after controlling for other socioeconomic influences. For example, as people move from their 20s to their 50s, they typically become richer. Say, for illustrative purposes, they also become happier. The descriptive approach would then ascribe the possible rise in their happiness over that period as due to age. The with-controls or ceteris paribus approach—which is what we believe is best practice—would divide the possible rise in happiness into two components—that coming from income per se and any residual effect from ageing per se.
Another illustration is the relation between smoking and the probability of lung cancer. One set of estimates would look at the raw relation between smoking and disease probability, while the second adjusted for smoking plus diet, education, income, and exercise. Compared to nonsmokers, smokers tend to have worse diets and less education, income, and exercise. If the aim is to describe the data, it is reasonable to leave out most or all control variables. “Smokers die at rate Z” is an acceptable statement to make. But that is not the same as ”smoking changes your risk by Z.” It would be an error to use the unadjusted equation to tell the public what smoking does to their health.
Related Books


In our latest paper we show that there is no doubt about the existence of the midlife dip, and report estimates both with and without controls for approximately 8 million people. We look at evidence on six different measures of happiness—4-step life satisfaction; the Cantril 11-step ladder of life satisfaction; 3-step happiness, and binary variables of experienced well-being, indicating happiness, enjoyment, and laughing or smiling yesterday. We use four major data sets—across countries in the Eurobarometer (1980-2019) and the Gallup World Poll (2005-2019), and across states in Gallup’s U.S. Daily Tracker (2009-2017) and the U.S. BRFSS, 2005-2011.
We find U-shapes with and without controls in our sample of over 1 million observations covering 37 countries from the Eurobarometer. In the Gallup World Poll data and based on the Cantril ladder, we found evidence for U-shapes both with and without controls for an additional 64 non-European countries, on top of those already in the Eurobarometro data. When we used Gallup U.S. Daily Tracker data on well-being—on life satisfaction, happiness, enjoyment, and laughing or smiling—there are U-shapes in age with minima averaging around age 50. This is found across all states with and without controls on all four measures.
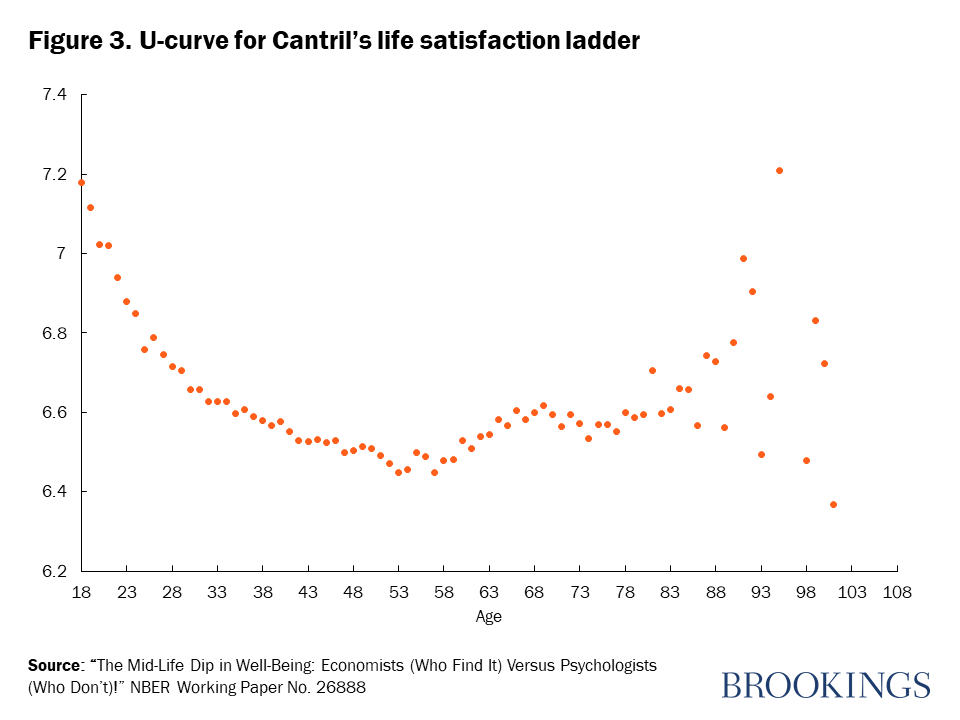
The same psychological study noted above has dismissed the literature on the U-curve as “overblown” and the scale of the effects as inconsequential or “trivial.” That claim, in our view, seems incorrect. Indeed, the effects of the midlife dip are comparable to major life events like losing a spouse or job. For example, for life satisfaction in the U.S., the drop from age 18 (7.21) to age 53 (6.66) is 0.55. The decline in life satisfaction from being married to being widowed is from 7.14 to 6.87, or 0.27 points on the 0-10 scale—half as much. We also found the midlife decline is comparable to the well-being effects of having cancer.
Beyond being empirically interesting, the midlife dip in well-being has implications for substantial parts of the world’s population. These dips in well-being are associated with higher levels of depression, including chronic depression, difficulty sleeping, and even suicide. In the U.S., deaths of despair are most likely to occur in the middle-aged years, and the patterns are robustly associated with unhappiness and stress. Across countries, chronic depression and suicide rates peak in midlife. The midlife dip in well-being is robust to within-person analysis, also exists with the prescribing of antidepressants, and extends beyond humans. The new shock to the livelihoods and health of much of the world’s population from COVID-19, meanwhile, suggests that these pressures will only increase, importantly for those in middle-age with responsibility for caring and providing for both the young and the elderly. Understanding how and why this dip in well-being occurs is a first step toward helping those in these years navigate the increasing pressures that they will face.
Related Content


Authors


Commentary
The midlife dip in well-being: Why it matters at times of crisis
May 5, 2020