The Trump Administration claims that the tax cut going through the House and Senate will significantly boost the overall growth rate of the U.S. economy by so much that it will pay for itself through increased revenues.
Take that assertion with a grain – or perhaps a barrel – of salt.
As I have written before, there is good reason to doubt that deficit-financed tax cuts will boost economic growth much, if at all. Recent studies by Wharton, Moody’s, and the Tax Policy Center suggest the congressional proposals would have minimal impact on overall U.S. economic growth.
A recent University of Chicago poll of leading economists comes to the same conclusion. Only 1 out of 42 respondents agreed that “If the US enacts a tax bill similar to those currently moving through the House and Senate — and assuming no other changes in tax or spending policy — US GDP will be substantially higher a decade from now than under the status quo.” More than half – 52 percent – disagreed and 36 percent were uncertain.
The surveyed economists were clear about one thing, though. All of those answering the question agreed that “If the US enacts a tax bill similar to those currently moving through the House and Senate — and assuming no other changes in tax or spending policy — the US debt-to-GDP ratio will be substantially higher a decade from now than under the status quo.”
And here’s a graph that shows how weak the link is between taxes and growth. The data here are courtesy of Joel Slemrod of the University of Michigan and Jon Bakija of Williams College.
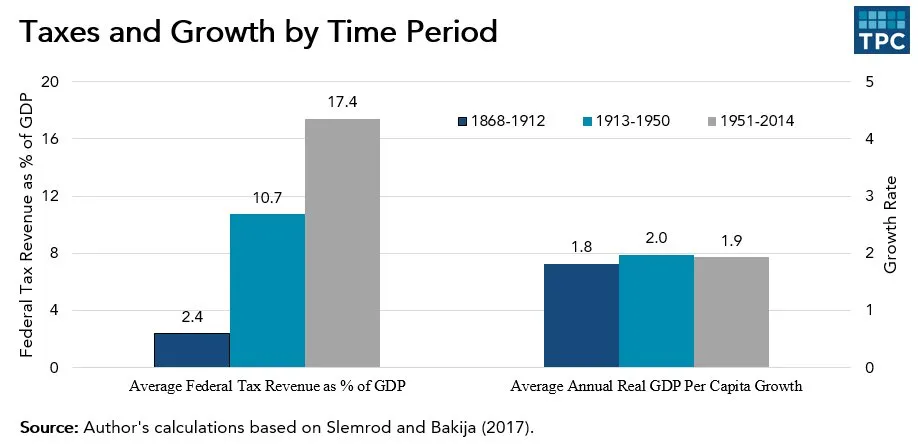
The basic point: There have been huge changes in taxes throughout US history with virtually no observable shift in growth rates.
The graph corresponds to three periods in the tax history of the United States. From 1868 to 1912, the U. S. had no income tax, and tax revenues averaged less than 3 percent of GDP.
From 1913 to 1950, taxes averaged almost 11 percent of GDP, reflecting the introduction of income, estate, and payroll taxes and expansion of corporate levies. The economy went through two World Wars, the Great Depression, and a post-war recession.
By 1950, the economy had entered a new period with permanently higher taxes (and government spending). From 1950 to 2014, federal revenues averaged more than 17 percent of GDP.
Despite the radical differences in taxes as a share of the U.S. economy, the annual growth rate of real GDP per person averaged about 2 percent over each period. Despite big changes in taxes, long-term economic growth barely budged.
Now, obviously, many things affect economic growth, so the graph is only suggestive evidence. But it is consistent with reams of studies that reach similar conclusions about taxes and growth.
Keep this graph in mind when the Administration says that its tax cuts – which equal about 0.6 percent of GDP over the next decade – will boost the growth rate for the U.S. economy by an entire percentage point.
Related Content

Authors


Commentary
Taxes and growth – a cautionary graph
November 28, 2017