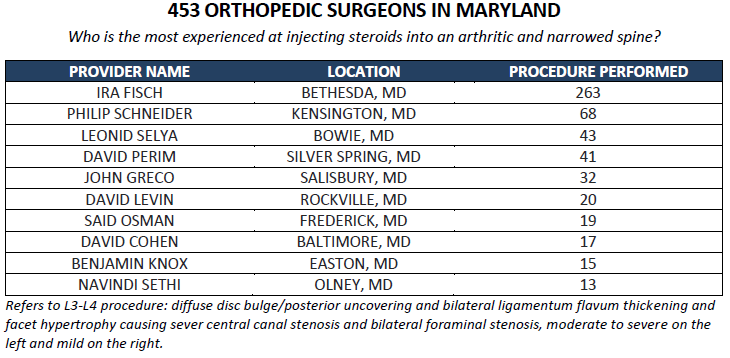
Five years ago, my mother needed an orthopedic surgeon for a knee replacement. Unable to find any data, we went with an academic doctor that was recommended to us (she suffered surgical complications). Last month, we were again looking for an orthopedic surgeon- this time hoping that a steroid injection in her spine might allay the need for invasive back surgery. This time, thanks to a recent data dump from CMS, I was able to analyze some information about Medicare providers in her area and determine the most experienced doctor for the job. Of 453 orthopedic surgeons in Maryland, only a handful had been paid by Medicare for the procedure more than 10 times. The leading surgeon had done 263- as many as the next 10 combined. We figured he might be the best person to go to, and we were right- the procedure went like clockwork.
Had it been a month prior to the CMS data release, I wouldn’t have had the data at my fingertips. And I certainly wouldn’t have found the most experienced hand in less than 10 minutes.
It’s been a couple of month since the release of Medicare data by the Centers for Medicare and Medicaid (CMS) on the volume and cost of services billed by healthcare providers, and despite the whiff of scandal surrounding the highest paid providers (including the now-famous Florida ophthalmologist that received $21 million) the analyses so far have been somewhat unsurprising. This week, coinciding with the fifth Health DataPalooza, is a good time to take stock of the utility of this data, its limitations, and what the future may hold.
The millions of lines of data was exactly as advertised: charges and paid services under traditional Medicare “fee-for-service,” including the billing provider’s ID and the costs to Medicare. The initial headlines touting “Medicare Millionaires” relied on some basic arithmetic and some sorting. And the cautions piled up: the data could reflect multiple providers billing under a single ID; payments are not the same as a provider’s actual take home income; it’s not complete information as it doesn’t contain information about other insurers, or even Medicare Advantage, and so on.
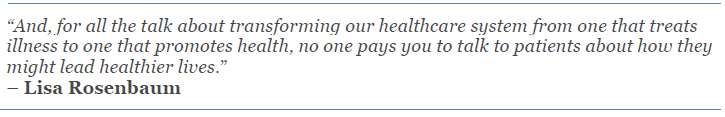
But perhaps most damning was how little insight the data seemed to provide on the quality or value of care provided, as opposed to volume of services. As Lisa Rosenbaum wrote in the New Yorker, “So much of that good isn’t captured by these numbers. You don’t bill for talking to a patient about how he wants to die. There’s no code for providing reassurance rather than ordering a test.”
Where is the value in the data?
Data bear witness to the fundamental flaw of the payment system that generates them. The absence of information on quality, safety, appropriateness, or outcomes appears to have been a genuine revelation to many, but it is in fact exactly the type of output that we should expect from this volume-based system that we have built. This is not a critique of the data release. It is an indictment of our payment system.
Data is revealing important trends in how we pay doctors differently. Not all physician payments are created equal, and the data certainly shows the disparities across specialties, primary care, and others. For example, the average total annual Medicare payment to geriatricians was less than $100,000, while dermatologists and radiation oncologists (who presumably also see non-elderly patients) received on average $200,000 and $360,000 respectively. The important question will be why and should it continue?
Figure 1: Distribution of Total Medicare Pay by Provider Type, 2012
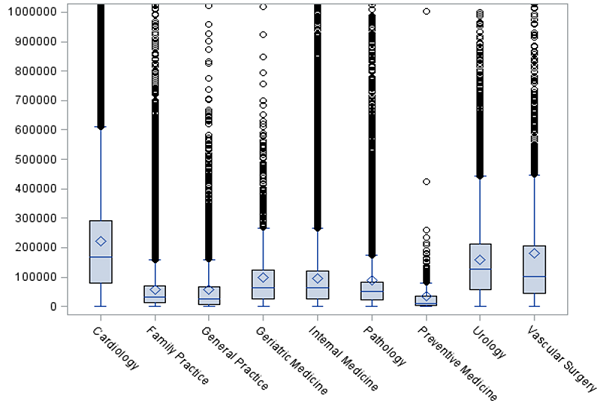
Source: Author’s calculations based on Medicare data released in April 2014
Data is revealing important indicators of cost and pricing – a major contributor to rising health care costs. Why is it that a brief visit with a geriatrician is worth $13; a 45-minute visit with a geriatrician sorting through medications, educating family members, and developing a quality of life plan with a terminal cancer patient is worth $79; and a dermatologist treating suspected skin cancer can earn upwards of $600 for a procedure that takes them minutes?
Data sheds light on practice patterns. The data is also revealing important variances in utilization of drugs and treatments. For example, a block apart on Park Avenue, two ophalmologists differ significantly in their use of treatments for macular degeneration. One uses expensive injectable drugs and gets paid over $10,000 per injection, while the other receives less than $500 for the lower-cost equivalent.
A CBS News report looked at spinal fusion surgeries—a procedure where there is almost no evidence demonstrating a net benefit to patients compared to other conservative therapies. They observed that “while the average spine surgeon performed them on 7 percent of patients they saw, some did so on 35 percent.”
At the extremes, outlier “practice pattern” begins to raise questions of potential improper billing or outright fraud and abuse. For example, simply looking at the frequency and volume of services provided to individual beneficiaries can identify concerning outliers. This laboratory company billed for 28,954 blood glucose reagent strips in 2012- for 88 patients. And yes, that’s highly unusual.
Figure 2: “Outlier” Medicare Billing for Blood Glucose Reagent Strips, 2012
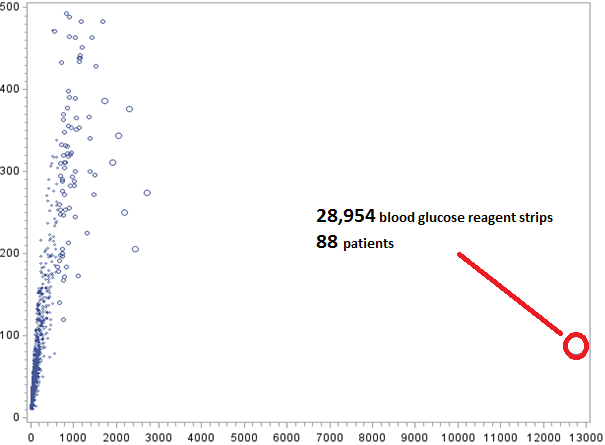
Source: Author’s calculations based on Medicare data released in April 2014
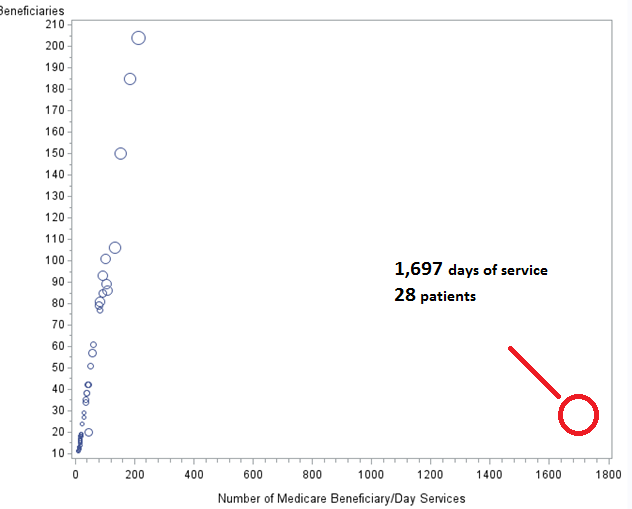
One clinical social worker billed for 1,697 separate days of service on 28 patients (the size of the bubble is proportional to the total amount of reimbursement by Medicare in 2012).
Figure 3: “Outlier” Medicare Billing for Days of Service, 2012
Source: Author’s calculations based on Medicare data released in April 2014
The most extreme outlier, Dr. Gary Ordog, was named by NPR and ProPublica in their examination of providers who are outliers on their pattern of coding for the highest intensity office. Ordog had previously lost the right to bill California’s state Medicaid program, and yet continued to charge Medicare for over $500,000 in billing in 2012. It’s important to caution however, that even in these extreme outliers, statistics alone cannot provide definitive evidence of abuse. There is a need for formal investigation.
Medicare and law enforcement officials will need to create new processes for dealing with a potential flood of outlier reports from amateur sleuths like me.
What’s Next for Medicare Data?
Data can be trended. Updates of data releases can begin to show us not just snapshots, but moving pictures of our healthcare system as it undergoes rapid changes. The New York Times reported on the increase in charges for certain frequent causes of hospitalization between 2011 and 2012. It will be interesting to see whether the data release itself, and the Steven Brill landmark Time article on hospital charges, have an impact on reversing these trends.
Data can be “mashed up”. The value of open data is hugely greater than the sum of its parts. As more and more data becomes available, the files can be cross-linked and “mashed up” to be able to answer questions no one database could have. ProPublica linked together cobbled together data on state actions and sanctions on physicians with the Medicare data release to ask why these physicians are still being paid by Medicare.
What does the future hold? Correlations with drug prescribing data, meaningful use, and referral patterns are possible today, Sunshine Act disclosures and quality reporting, and much more is soon to come.
As we get comfortable with the data, analysts can move past the basics of arithmetic and sorting, we have an opportunity to make more ‘meaningful use’ of this data. We can begin to identify practice patterns, overuse, variations in geography or demographics, and potentially even fraud and abuse. As more and more data becomes available, the files can be cross-linked and “mashed up” to be able to answer questions no one database could have addressed. What will determine the value of the Medicare data release will be the creativity of those data scientists, epidemiologists, and health services researchers (amateur as well as professional) who can ask the challenging questions that must be answered.


Commentary
Beyond Arithmetic: How Medicare Data Can Drive Innovation
June 6, 2014