Editor’s Note: This blog was originally published on the World Bank’s Future Development blog.
The new report of the International Comparison Program published last week promises to invigorate debate about the global economic landscape. In some areas, the report challenges conventional wisdom. In other areas, it reinforces the narrative.
The headline change according to The Economist is the rise of China to potentially become the largest economy in the world by the end of 2014. According to Angus Maddison, the United States’ economy became the largest in the world in 1872, and has remained the largest ever since. The new estimates suggest that China’s economy was less than 14% smaller than that of the US in 2011. Given that the Chinese economy is growing more than 5 percentage points faster than the US (7 percent versus 2 percent), it should overtake the US this year. This is considerably earlier than what most analysts had forecast. It will mark the first time in history that the largest economy in the world ranks so poorly in per capita terms. (China stands at a mere 99th place on this ranking.)
But China’s rise is just one striking example of a more general feature of our times—the rapid development of low- and middle-income countries and their convergence with rich countries. Convergence had already been well established for social indicators like life expectancy and infant mortality, but it is now clear that it is also happening with material living standards. The G7 countries, which accounted for half the world economy in 2000, accounted for little more than a third in 2011. The whole of the OECD, even with its expansion to include countries like Mexico, South Korea and many Eastern European countries, is less than half of the global economy.
The pendulum has swung back to Asia. The new data suggest that Asia is today about half the global economy, not too far from its share of the world’s population.
Revisions to regional estimates move slowly. But for some individual countries, the results are startling. Indonesia and Ghana are both more than 80 percent richer than previous estimates. For Egypt and Pakistan the upward changes are more than 60 percent. These changes are dramatic. They suggest that Indonesia’s economy may be as large as that of the United Kingdom, while Pakistan and Egypt are almost as large as Australia.
Only 8 of the 179 countries in the ICP report now have per capita real GDP levels below $1,000 per year. All of these are in Africa. Only 9 countries have had their real GDP per capita estimate reduced by more than 10 percent, while 84 countries have seen upward revisions of more than 10 percent. Of these, 63 countries have an upward revision greater than 20 percent, and 25 countries have an upward revision of more than 50 percent.
The upshot of all these changes is that the narrative of worsening global income distribution will be punctured. Far and away the biggest changes are to be found for individual developing countries that are now perceived to be richer than previously thought. This is not to say that inequality is not worsening in many countries, but globally, the poorest large developing countries are converging more rapidly with rich countries than we thought and this will inevitably translate into a more equal global income distribution.
The vast majority of countries now also have a significant middle class. The new ICP data report on government expenditures consumed by individual households, like health and education spending. When this is added to individual household expenditure (to produce a category called Actual Individual Consumption or AIC), it provides a good measure of material well-being. More work is required to determine the size of the middle class, which we have elsewhere defined as being composed of households whose per capita consumption is between $10 and $100 a day in 2005 PPP terms, but it seems reasonable to suggest that countries with mean AIC levels of over $5000 per year (2011 PPP terms) would have sizeable middle class populations. Two-thirds of the world’s countries belong to this group.
Lest we feel complacent as a result of the new data, here are some sobering facts. Based on our preliminary calculations, there are still 900 million people living in extreme poverty, with living standards below the standard for poverty set in the world’s poorest countries. True, that standard is marginally higher than we had previously thought, as some of the world’s poorest countries are better than off we had previously thought. Nevertheless, the scale of the challenge to end extreme poverty remains formidable, not least because the share of the world’s extreme poor living in fragile states has been revised upwards.
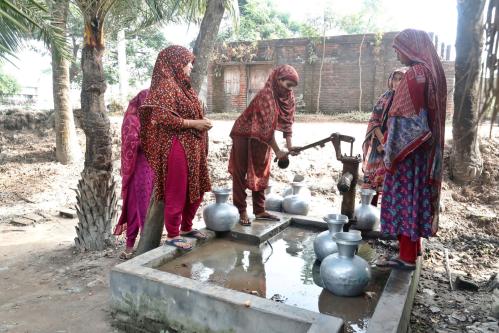
The ICP report also shows the enormous differences across countries in what their governments spend to improve the lives of their citizens. In an average OECD country, government expenditure is about $5,000 per person per year (excluding administration, defense, police, judiciary and the like). In Africa it averages just over $500 dollars. In more than half of all African countries, government spending on individual consumption items is less than $200/person/per year—a level that might be considered as a minimum to provide basic public services like education, health, safe water and sanitation.
The world is a richer place than we thought. In fact, in 2014, total expenditure in the world could for the first time surpass $100 trillion in PPP terms. Life seems to be getting better for hundreds of millions of people living in emerging and developing economies, but the challenges of hundreds of millions of people facing extreme poverty and enormous global inequalities are starkly revealed by the new data.


Commentary
Statistical Earthquakes
May 7, 2014