The COVID-19 pandemic has already shown a dispersion away from the nation’s most urban and densely populated counties to suburban, somewhat whiter, and less politically Democratic parts of the country. Yet the group of counties that newly qualify as areas with a high prevalence of COVID-19 cases are even more dispersed, and represent places where Donald Trump gained more votes than Hillary Clinton in the 2016 presidential election.
This is occurring at a time when attitudes about the administration’s handling of the crisis—and particularly its stance over reopening state and local economies—has become polarized between the parts of the country where the pandemic has hit hardest and those yet to feel its full impact. Thus, it is useful to monitor where coronavirus cases are spreading over time and the populations that reside in new high-prevalence areas—as this spread may change attitudes about government policies and tamp down political polarization.
The findings reported below update an earlier analysis of the expansion of counties with high COVID-19 prevalence rates (more than 100 confirmed cases per 100,000 population) based on data available from The New York Times and the U.S. Census Bureau. (Note: The rate of 100 COVID-19 cases per 100,000 population in a county includes areas where the rate can be higher. It was chosen as a minimum yet significantly high benchmark to assess COVID-19’s spread across new areas.) This analysis examines the demographic and political attributes of areas that have reached high COVID-19 prevalence status in the four weeks from March 30 through April 26, and compares them with such areas as of March 29.
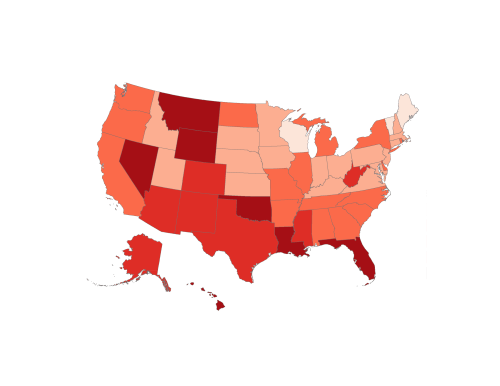
As Table 1 indicates, the spread of COVID-19 has affected increasing numbers of counties and their resident populations over this four-week period—from 59 to 960 counties and from 8% to 57% of the U.S. population. The most recent week tallied (April 20 to April 26) added 244 counties. Map 1 provides an overview of the geographic scope of the spread over the past four weeks.

As of March 29, counties with a high prevalence of COVID-19 cases were heavily clustered in urbanized parts of the Northeast, especially in the greater New York and Boston metropolitan areas. In subsequent weeks, expansion occurred in the Midwest, especially around Detroit and parts of the South.
Particularly noteworthy was the tranche of counties that reached high-prevalence status during the week of April 6 to April 12, which sharply expanded COVID-19’s presence in the South. This included a string of metro areas including Atlanta, Miami, and Washington, D.C., but also many smaller metropolitan and rural counties especially in Georgia, Louisiana, and Mississippi. Noticeable expansion also occurred around Denver during this period.
The week of April 13 to April 19 was notable for its continued COVID-19 spread across the South, including North Carolina and Texas, but also high-prevalence status occurring in large coastal California counties including Los Angeles, San Francisco, and Riverside.
The most recent week reported here, April 20 to April 26, reflects the broad expansion of high COVID-19 prevalence status for suburban, smaller, and nonmetropolitan counties in large parts of the Midwest and South. Notable swaths of such high-prevalence counties are evident in Kansas, Michigan, Illinois, and Indiana in the Midwest as well as a span of southern states that includes Virginia, Florida, and Texas, among others.

These regional shifts away from the heavily northeastern COVID-19 concentration are revealed in Figure 1. As of March 29, more than four-fifths of residents in such counties lived in the Northeast and in densely populated metropolitan urban cores. The shift toward the Midwest and especially the South is evident in each of the subsequent four weeks, as is the shift toward suburbs, smaller metro areas, and rural areas. (The upward bump in urban cores and the West during the April 13 to April 19 period is attributable to the three populous California counties mentioned above).
Yet it is the most recent week, April 20 to April 26, that displays the greatest dispersion of high COVID-19 prevalence to smaller sized areas and the “middle of the country.” Fully three quarters of residents in these areas live outside of urban core counties, and nearly one-half live in outer suburbs, small metropolitan areas, and mostly rural areas. Almost three-quarters of residents in these counties are located in the Midwest and South.
These shifts are changing the political landscape of which residents live in high COVID-19 prevalence counties. Not surprisingly, residents of urban core areas in the Northeast tend to be the heart of the “blue state” electorate. Thus, the heavily impacted, densely settled counties as of March 29 were also places that voted strongly for Hillary Clinton over Donald Trump in the 2016 presidential election (by a margin of 62 to 34). For each of the next three weeks, newly designated high-prevalence counties—representing less urban and broader regional constituencies—showed lower Clinton-Trump margins (down to 52 to 42 for counties added during the April 13 to April 19 period).
In the most recent week, counties newly designated with high COVID-19 prevalence voted for Trump over Clinton by a margin of 48-46. This reflects the smaller communities within red, blue, and purple states where the pandemic is beginning to spread.

An indicator of how this coronavirus spread has impacted Trump country is the rise in the number of high COVID-19 prevalence counties between March 30 and April 26 that voted for Trump over Clinton in 2016. As Table 2 shows, 639 of the 901 counties newly designated as high-prevalence counties voted for Trump. Of these 639 Trump-winning counties, 486 are located in small and nonmetropolitan areas, and only four are urban cores. The largest numbers of these counties are located in the states of Georgia (80), Louisiana (45), and Mississippi (45). Yet a significant number of them are in swing states Michigan (21), Pennsylvania (19), and Florida (18), as well as the near-swing-state of Texas (32).

Residents of the most recent week’s newly designated high COVID-19 prevalence counties are also distinct from the first tranche of such counties with respect to selected demographic attributes (see Table 3). These residents are less racially diverse, with 62% identifying as white compared to 48% for high-prevalence counties as of March 29, and 60.4% for the nation as a whole. Likewise, they have lower shares of foreign-born residents (11.8%) and households making over $100,000 per year (27.5%) than earlier-designated high-prevalence counties.
Public health professionals tell us that COVID-19 will continue to spread even as many Americans practice social distancing. As the coronavirus moves into new areas where a broader range of population groups reside, attitudes favoring greater preventive measures and delaying the reopening the economy may also become more widespread, perhaps making national discussions about these actions less politically divisive.
Related Content

Authors


Commentary
COVID-19 is expanding further into Trump country
April 29, 2020