This post is part of a series exploring infrastructure from an individual’s perspective. What really matters to people when they rely on infrastructure to access economic opportunity? Within each post, we examine infrastructure through the lens of people’s expectations: whether infrastructure is physically accessible, whether services are affordable, and whether infrastructure protects us from risk. Our results show that infrastructure often creates economic barriers and policymakers could do a better job of measuring and meeting people’s needs.
While the first request most people make of their local infrastructure is one of physical reach—the idea that power lines, roads, broadband, and water pipes all connect to one’s home—the next question is usually one of price.
If infrastructure is to function as a shared platform to promote economic prosperity, the price for these services should be readily affordable. In this case, that means every household can pay their water, energy, transportation, telephone, and internet bills—and still leave money left over to purchase other essential items like housing, food, clothing, and healthcare. In a country as wealthy as the United States, access to infrastructure is a necessity that should be available to everyone. Unfortunately, that’s far from the case.
Accessing American infrastructure is a relatively expensive proposition, creating financial barriers to economic opportunity for many people throughout the country.
In a country as wealthy as the United States, access to infrastructure is a necessity that should be available to everyone. Unfortunately, that’s far from the case.
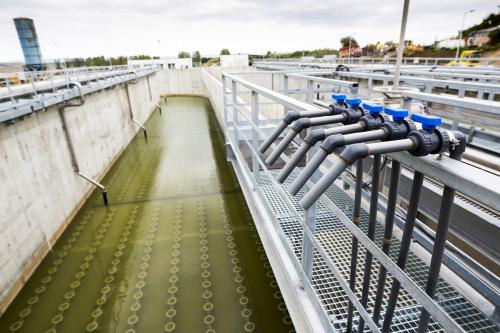
Tracking how much Americans spend on infrastructure starts with defining the sector. In this case, we mean the essential services related to public works: water and sewer, electricity and gas, transportation, telephone, and broadband. Tracking pricing and spending under this basket of goods is possible via the Bureau of Labor Statistics’ Consumer Price Index (CPI) and Consumer Expenditure Surveys (CE) databases. The only exception is broadband data, which is difficult to decouple from cable television and we manage separately. We also add BLS housing price data—specifically ‘shelter’—in many places to complete the ‘built environment’ picture.
Looking across these different categories, there’s no question that infrastructure commands a significant chunk of household spending. Between 1990 and 2016, infrastructure represented between 22 and 26 percent of the average household’s total expenses. Adding housing to the bucket nearly doubles the spending share to between 42 and 45 percent. Put simply, this is an enormous burden for most households—and only intensifies when infrastructure price inflation outpaces wage growth. This is central to the housing crisis seen in many large metro areas. It’s also a growing concern within the water/sewer sector, where utility prices have risen 300 percent faster than economy-wide inflation in the past two decades.

The infrastructure spending burden is especially pronounced among the country’s lowest-income households. The CE’s lowest quintile—the bottom 20 percent of all consumer units—reported an annual income of $11,832, but they typically spent $6,040 across gas, electricity, telephones, water and sewer, and transportation services. That’s over 60 percent of all income on essential living expenses. Add the $6,331 spent on housing by this quintile and built environment costs actually exceed all income. No money left for food, no money left for health care, no money left for anything. It’s a frightening proposition for over 24 million households. And while the second-lowest income quintile faces a better situation, infrastructure plus housing spending still commands 58 percent of their income.

As much as built environment costs help explain the precarious financial position for many households, those spending categories help explain the advantages they present to the highest earners. Both the highest two income quintiles can afford to spend more on infrastructure and housing items, but it still only represents between 26 and 37 percent of annual income. So while the highest earners can afford to spend more on infrastructure and still have income left to save, the lowest earners sometimes have nothing left to save from consuming the exact same services. It’s an uneven playing field.
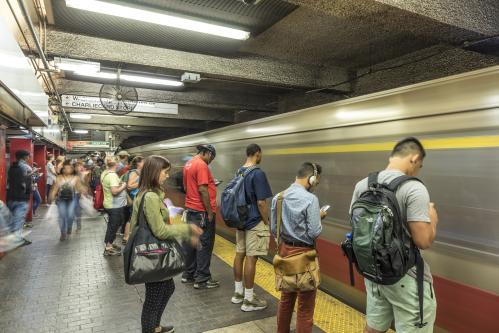
Transportation, the most expensive infrastructure category, is the most extreme example of this—and it has everything to do with the kinds of services most households need to consume. Due to the country’s economic geography, a car is often essential to reach all destinations in a reasonable amount of time. The result is a built environment where higher income households can afford to consume added transportation expenses: owning and insuring more cars, buying more gas to drive more miles, better maintaining them to keep them running. It’s an enormous benefit to higher earners. Conversely, lower income households face grueling choices around maintaining older cars—which itself is often more expensive—or face the loss of time and other economic costs when they lose access to a vehicle.
While the highest earners can afford to spend more on infrastructure and still have income left to save, the lowest earners sometimes have nothing left to save from consuming the exact same services.
Finally, a quick note about broadband pricing. Conservatively, we can estimate in-home broadband to cost at least $50 per month, which would equate to $600 per year. The internet is rife with studies showing higher average monthly costs, but it’s impossible to know for sure due to a lack of official reporting. But going with these rough estimates, broadband expenses match the average household expenses for water and other public services. It also would represent over 5 percent of lowest quintile income. It’s no wonder the Pew Research Center’s surveys and other academic work consistently find price to be a significant barrier to broadband adoption.
For too many people, infrastructure prices are a barrier to economic opportunity, forcing difficult choices between how to get to work, whether they can keep the lights on, and if they can subscribe to in-home broadband. The data on infrastructure’s pricing challenges are clear. But what about the solutions? Is society talking enough about our affordability challenges? Are elected leaders speaking to their constituents and raising these issues in campaigns and platforms? Are we even debating the kinds of means-based affordability programs that could make a dent, or whether public and private providers even have the capacity to offer new programming? The first step is recognizing we have an affordability problem, and we’re just not there yet.
Thank you to Annibel Rice for research assistance.
Related Content
2018
Authors

Commentary
Can people afford American infrastructure?
May 9, 2018