Earlier this week the Census Bureau released the latest national numbers on poverty, income, and health insurance coverage. After years of stubbornly high poverty and stagnant incomes in the wake of the Great Recession, the 2015 data brought some long-overdue good news suggesting the economic recovery is finally starting to reach down the economic ladder.
Nationally, the poor population shrank by 3.5 million, driving the largest single-year decline in the poverty rate since 1999. At the same time, the typical household income increased by more than 5 percent, growing for the first time since 2007 and by the largest margin on record. These gains were largely shared—to varying degrees—across demographic, age, and income groups.
These economic gains were less widely shared across places, however. New local-level poverty data released yesterday (from the Census Bureau’s American Community Survey) reveal that in 2015, many communities across the country were still waiting to feel the effects of a six-year-old economic recovery. An analysis of poverty trends within and across the nation’s largest metro areas finds:
- The number of people living in poverty in the nation’s 100 largest metro areas fell by 1.5 million in 2015.
In 2015, 29 million major-metro residents lived below the federal poverty line (e.g., $24,257 for a family of four), down from 30.5 million the year before. That decline helped shave close to a full percentage point off the major-metro poverty rate, which fell from 14.7 to 13.8 percent over that time period.
- Thirty-four of the 100 largest metro areas experienced a decline in their poverty rates in 2015.
That’s more than double the number of regions that registered a significant decrease in their poverty rate in 2014, signaling the broader reach of the recovery in 2015. California and Texas metro areas led the list, with Stockton, Austin, and El Paso posting declines of more than 3 percentage points, followed by Bakersfield and Fresno which both experienced decreases in their poverty rates of more than 2 percentage points in 2015.
In most of the metro areas that saw poverty rates fall (27), the number of people living in poverty also decreased. But for seven Sun Belt metro areas—including regions like Houston, Phoenix, and Orlando, Florida—declines in the poverty rate reflected a fast-growing total population, rather than a shrinking poor population.
Only two of the top 100 metro areas saw poverty continue to grow in 2015. Both the number of poor residents and the poverty rate rose significantly in the Little Rock, Arkansas, and Tulsa, Oklahoma, regions over the course of the year. In the end, the poverty rate registered no significant change in almost two-thirds of the nation’s largest metro areas in 2015 (For detailed data, see the appendix table.)
- The decrease in the poverty rate for black residents was double the major-metro average.
For the 52 metro areas with at least 1 million residents and at least 20,000 black residents, the black poverty rate fell by 1.8 percentage points, double the 0.9-percentage-point decline in the total poverty rate. Hispanic residents experienced similar decreases (1.7 percentage points), while whites posted a much more modest, though still statistically significant, decline (0.4 percentage points). The white poverty rate, however, remained much lower (8.3 percent) than either the Hispanic (21.0 percent) or black (22.8 percent) poverty rate.
The overall decrease in the black poverty rate was largely driven by a small subset of these 52 regions, but more major metro areas posted statistically significant declines in the poverty rate for black residents (16) than for their white (11) or Hispanic (11) populations. Seven metro areas registered decreases in the black poverty rate of 5 percentage points or more. They represent a diverse array of regions from across the country, including Portland, Oregon, and San Jose, California, in the West, Nashville, Tennessee, and Orlando in the South, Minneapolis-St. Paul and Milwaukee in the Midwest, and Hartford, Connecticut, in the Northeast.
Most of the regions delivering gains for black residents were ones that succeeded in bringing down poverty rates overall, but not all fall in that category. Four metro areas saw poverty rates for black residents fall even as rates remained unchanged for the total population and other racial and ethnic groups: Cincinnati, New Orleans, Pittsburgh, and San Jose.
However, not as much overlap exists between the list of regions registering declines in black poverty rates compared to metro areas posting decreases in white or Hispanic poverty rates. Regions posting the largest declines in white poverty rates in 2015 tended to fall in the South, including Birmingham, Alabama; Austin, Texas; Miami; and Atlanta. Southern metro areas also led the list for metro areas with the steepest decreases in their Hispanic poverty rates—including Nashville, Oklahoma City, and Austin—and were joined by Midwestern regions like Indianapolis and Grand Rapids, Michigan.
- More major metro areas registered declines in city poverty rates (24) in 2015 than in suburban poverty rates (5).
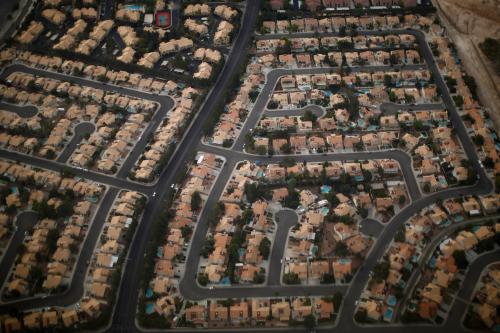
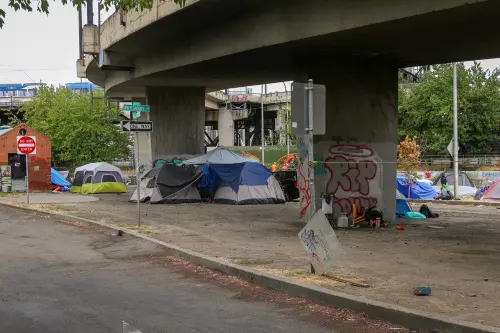
The topline numbers suggest that cities fueled much of the major-metro-area progress against poverty in 2015, while the recovery has taken hold somewhat more slowly in the suburbs. Overall, cities and suburbs in the nation’s 100 largest metro areas both experienced declines in their poor populations in 2015 (see chart). Those declines translated into a 1.3-percentage-point decrease in the city poverty rate but a more modest 0.7-percentage-point drop in the suburban poverty rate. As the city poverty rate has ticked down more quickly in recent years, the gap between cities and suburbs has narrowed, although it remains sizeable. Cities in the nation’s largest metro areas posted a poverty rate of 19.6 percent in 2015, compared to 11.2 percent in suburbs. However, suburbs remain home to the majority of the poor population in the top 100 metro areas, with 3.3 million more poor residents than cities.

Many more cities than suburbs in major metro areas saw poverty fall in 2015. Of the top 100 metro areas, 24 posted a significant decline in the poverty rates of their primary cities. That list includes the country’s four largest metro areas (New York, Los Angeles, Chicago, and Dallas), as well as other fast-growing Texas metro areas (San Antonio and Austin) and California’s Inland Empire (Bakersfield and Stockton). And all but two (Boston-Cambridge and Portland, Oregon) of these regions also saw their city poor populations shrink. At the same time, no metro area experienced an increase in its city poverty rate, although the city of Tulsa did register a significant uptick in its poor population.
In contrast, only five regions posted significant declines in their suburban poverty rates. Among those, only three—Atlanta, Birmingham, and Los Angeles—posted decreases in the number of suburban residents living below the poverty line. In Austin and Orlando, the number of suburban poor held steady, but overall population gains led to a drop in the suburban poverty rate. The Little Rock region is the only metro area that saw both its suburban poor population and poverty rate grow in 2015.
- Poverty rates remain above pre-recession levels in most major metro areas.
Even with the progress made against poverty in 2015, most major metro areas are still trying to make up ground lost in the Great Recession. Among the 68 metro areas for which we have comparable data in 2007, 48 posted significantly higher poverty rates in 2015 than before the downturn (only metro Denver’s poverty rate was lower than in 2007). And 59 regions still had more residents living in poverty than before the Great Recession began (none had fewer). Within those 68 regions in 2015, the poverty rate in cities remained 1.8 percentage points higher than in 2007, while the suburban poverty rate registered 2.3 percentage points above its pre-recession level.
These findings underscore that 2015 brought more good economic news than the country has seen in a long time, and real signs of progress in bending the trend lines in the right direction. But the recovery remains highly geographically uneven. Not only is there still work to be done to get the country back to where it was before the housing market collapsed—let alone to its economic peak at the start of the 2000s—but also there are still communities across the country wondering how many years it will take for this recovery to reach them.
Related Content


Related Books


Authors


Commentary
The nation’s major metro areas show uneven progress against poverty in 2015
September 16, 2016