What makes an economy inclusive? How do we know that we are making progress? Regions across the country and the world are grappling with this question in response to increasing inequality at both the city and national levels. The latest Metro Monitor from the Brookings Metropolitan Policy Program showed that very few places have achieved the economic goals of growth, prosperity, and inclusion for all people.
The Rockefeller Foundation defines inclusive economies as those that expand opportunities for more broadly shared prosperity, especially for those facing the greatest barriers to advancing their well-being. The Foundation has developed an emerging framework that identifies five characteristics of more inclusive economies, which applies in a range of contexts. This framework highlights that more inclusive economies are more equitable, participatory, growing, sustainable, and stable.
The Rockefeller Foundation describes these characteristics as follows:
- Equitable. More opportunities are available to enable upward mobility for more people. All segments of society, especially the poor or socially disadvantaged groups, are able to take advantage of these opportunities. Inequality is declining, rather than increasing. People have equal access to a more solid economic foundation, including equal access to adequate public goods, services, and infrastructure, such as public transit, education, clean air and water.
- Participatory. People are able to participate fully in economic life and have greater say over their future. People are able to access and participate in markets as workers, consumers, and business owners. Transparency around and common knowledge of rules and norms allow people to start a business, find a job, or engage in markets. Technology is more widely distributed and promotes greater individual and community well-being.
- Growing. An economy is increasingly producing enough goods and services to enable broad gains in well-being and greater opportunity. Good job and work opportunities are growing, and incomes are increasing, especially for the poor. Economic systems are transforming for the betterment of all, including and especially poor and excluded communities. Economic growth and transformation is not only captured by aggregate economic output measures (such as GDP), but must include and be measured by other outcomes that capture overall well-being.
- Sustainable. Economic and social wealth is sustained over time, thus maintaining inter-generational well-being. Economic and social wealth is the social worth of the entire set of assets that contribute to human well-being, including human produced (manufactured, financial, human, social) and natural capital. In the case of natural capital, human use must preserve or restore nature’s ability to produce the ecosystem goods and services that contribute to human well-being. Decision-making must thus incorporate the long-term costs and benefits and not merely the short-term gains of human use of our full asset base.
- Stable. Individuals, communities, businesses, and governments have a sufficient degree of confidence in the future and an increased ability to predict the outcome of their economic decisions. Individuals, households, communities, and enterprises are secure enough to invest in their future. Economic systems are increasingly resilient to shocks and stresses, especially to disruptions with a disproportionate impact on poor or vulnerable communities.
Over the past few months, researchers at the Brookings Metropolitan Policy Program have taken a deeper dive into how to measure these characteristics and how to look at relationships between them through the prism of U.S. metropolitan areas. Both Rockefeller and Brookings wanted to better understand trends and relationships that might reveal the “big picture” of what makes an economy inclusive.
To do this analysis, Brookings researchers translated each characteristic into a series of indicators measured for the 100 largest U.S. metropolitan areas. Rather than relying on a single direct proxy for each characteristic, we use a wide range of indicators that are related to each of the characteristics. In total, we analyzed more than 100 such indicators. While this approach couldn’t pinpoint what causes metropolitan economies to be more or less inclusive, it does reveal important relationships among the characteristics of inclusive economies within and across metro areas.
This analysis yielded an overall ranking of major metro areas based on their average rankings on individual indicators for each of the five inclusive economy characteristics. The results are displayed in the chart. The metro areas at the top rank the highest across the five inclusive economy dimensions, while those at the bottom rank lowest. Those on the left perform better on equity, those on the right perform better on growth, and those in the middle tend to balance their performance on equity and growth dimensions.
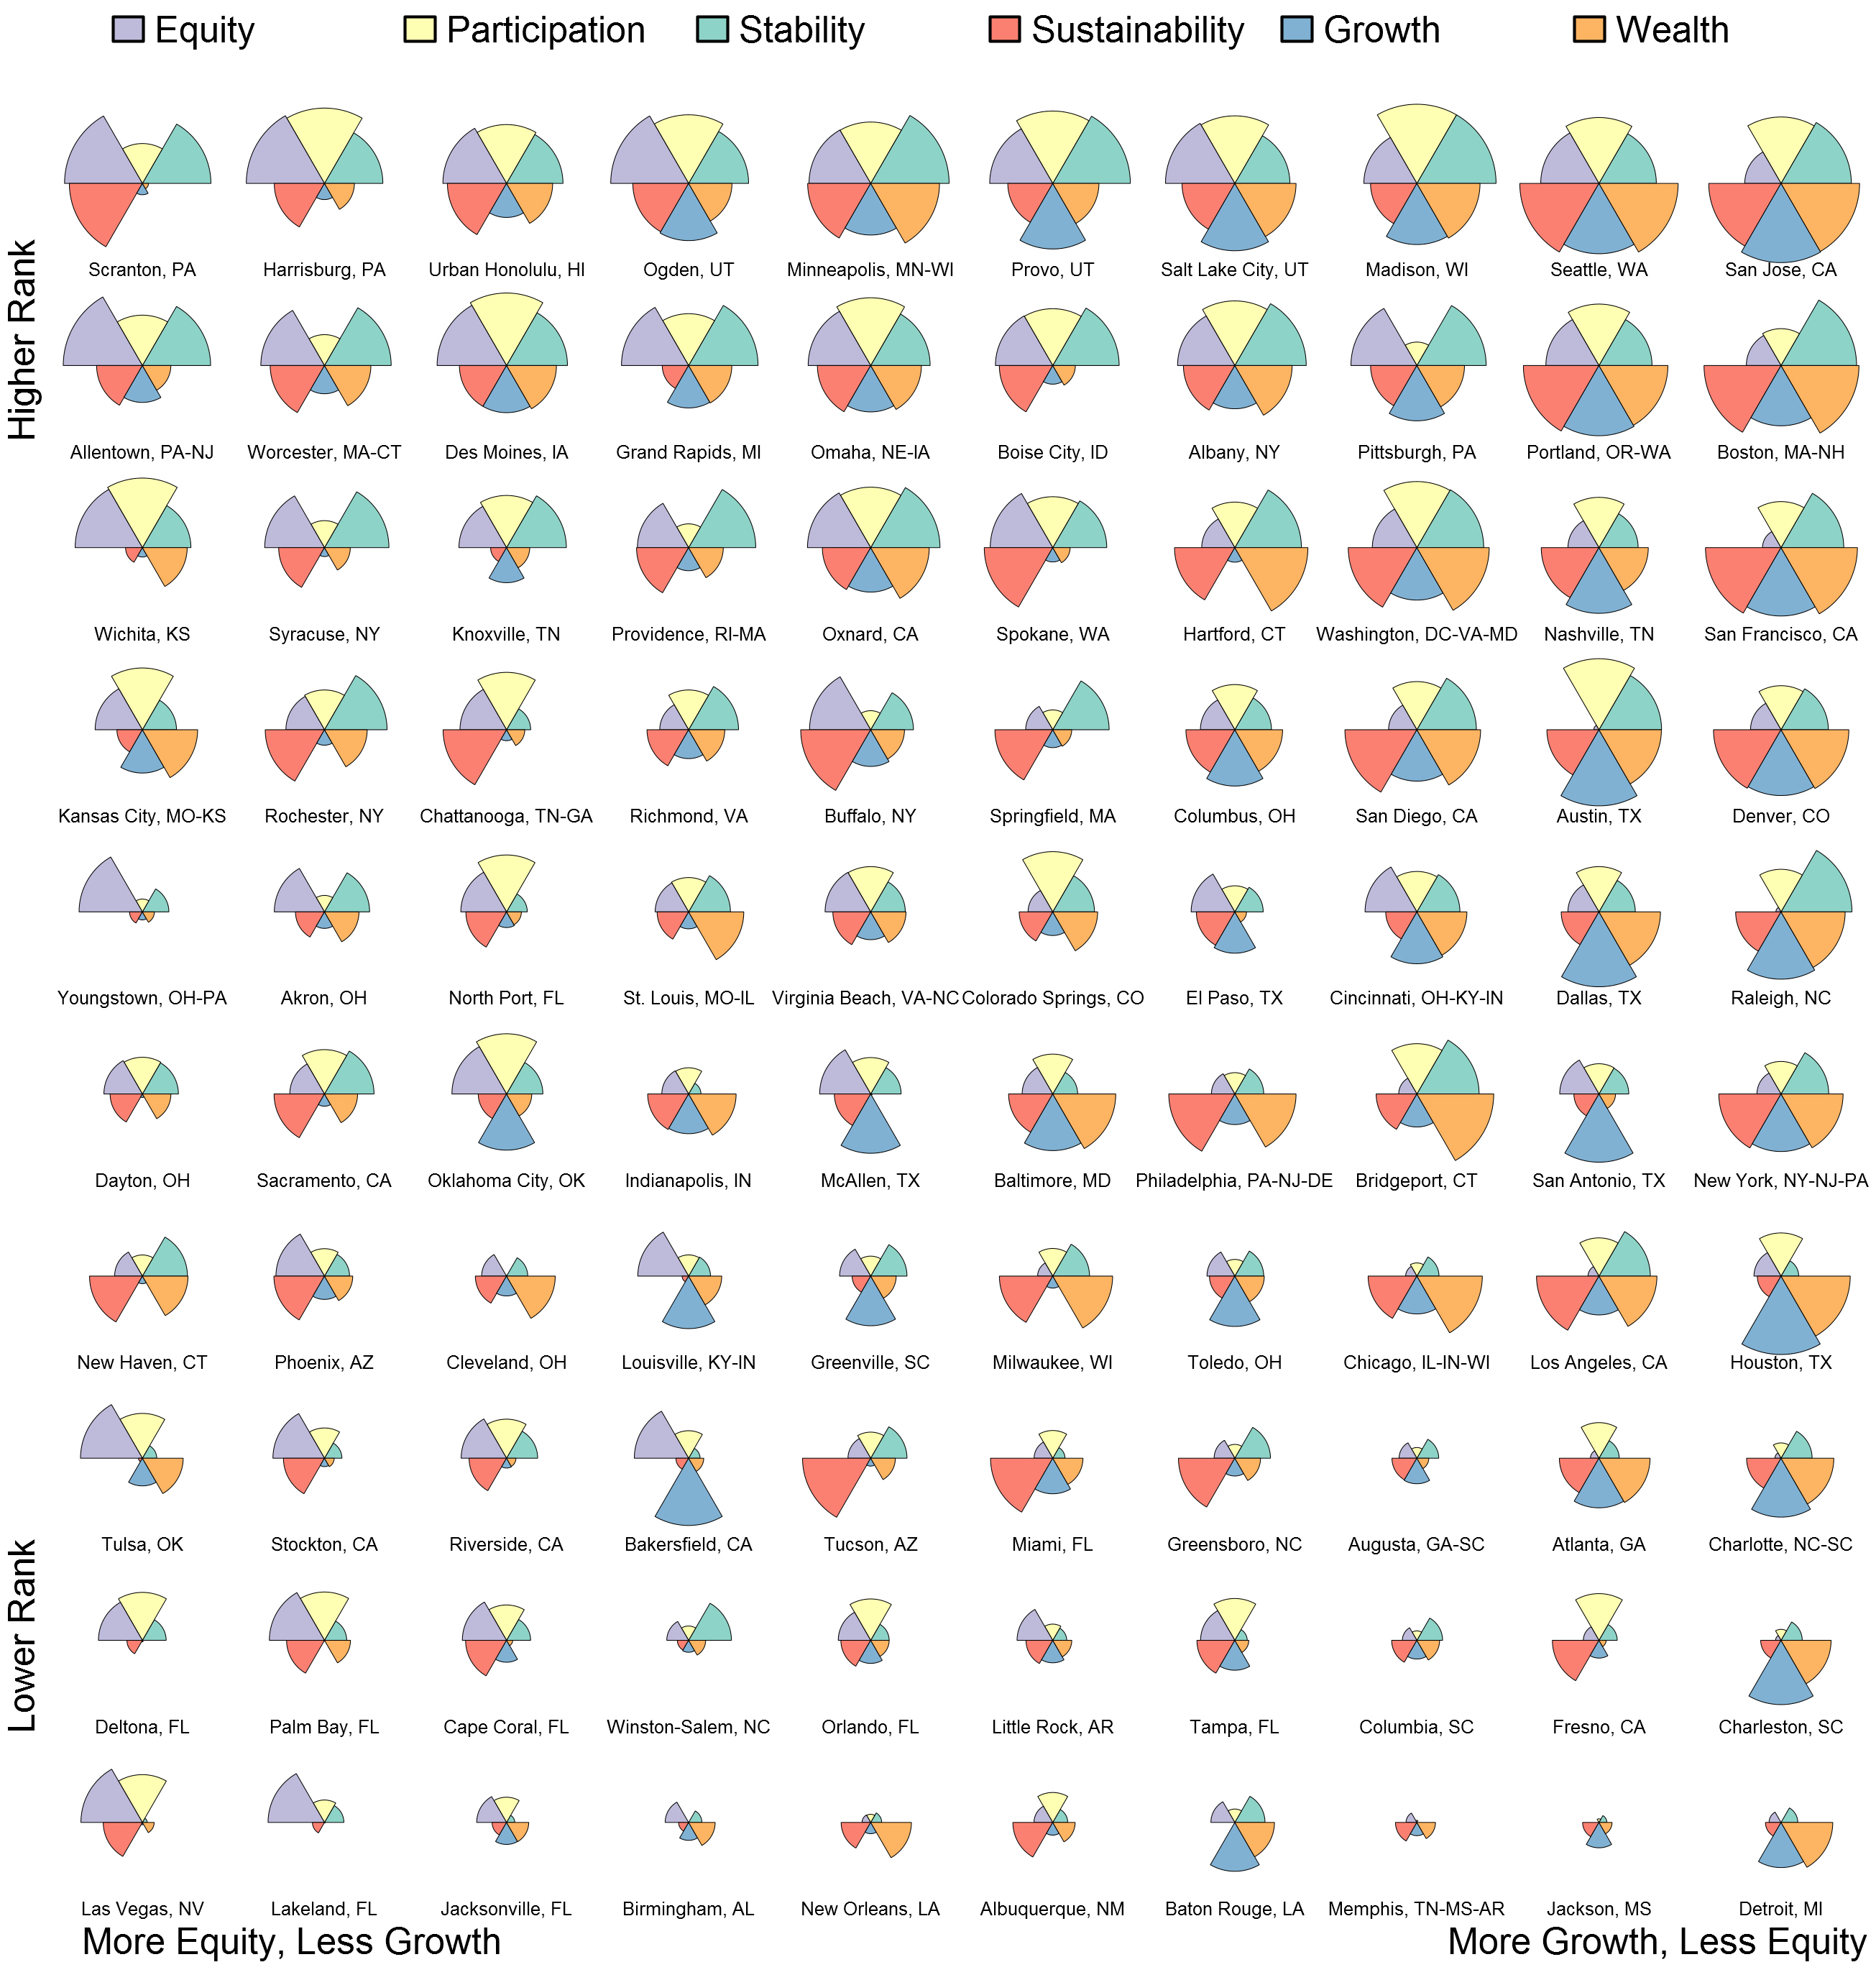
The rankings point to a few important insights:
Judged across all five characteristics, the “most” and “least” inclusive metro economies are geographically and economically diverse. Among the top 20 performers (the first two rows) are metro areas in the Northeast, Midwest, and West; older industrial economies (e.g., Allentown, Pa., and Grand Rapids, Mich.), high-tech centers (e.g., Boston and Seattle), and centers of education and government (e.g., Albany, N.Y., and Madison, Wis.). The bottom 20 performers are largely located in the Southeast, but also feature economically disparate places such as Albuquerque, N.M.; Birmingham, Ala.; Fresno, Calif.; and Tampa, Fla. The most important distinctions may be demographic—many of the top-performing metro areas have larger-than-average white populations, while many of those nearer the bottom have significant black and Latino populations. While a metro area’s location or economic structure may not dictate its ability to achieve inclusive economic outcomes, historical patterns of racial segregation and exclusion appear to loom critical.
More equitable metropolitan economies also exhibit higher levels of participation and stability. In metro areas that rank more highly on equity, higher shares of adults—including those with less education—are working, perhaps because they live in communities that are safer and closer to jobs. In turn, they experience lower levels of poverty and higher rates of intergenerational mobility. Places like Albany; Des Moines, Iowa; Minneapolis; and Oxnard, Calif., exemplify this pattern.
Growth and equity vary independently across metropolitan areas. Equity and growth do not statistically relate to one another across metro areas in our analysis, further confirming what we observed in the Metro Monitor and others observed in earlier work. Many fast-growing metro economies, such as Boston, Denver, San Francisco, and San Jose, Calif., score rather poorly on equity indicators, while several economies that score high on equity, such as Allentown; Scranton, Pa.; Tulsa, Okla.; and Wichita, Kan., are among the slowest-growing.
Metro areas with similar performance across the five characteristics may not possess the same capacity to improve their performance. Hartford, Conn., and Spokane, Wash., for instance, rank quite closely to one another on inclusive economy measures, with Spokane scoring a bit higher on equity and a bit lower on stability. (Both score very low on growth.) Yet Hartford is a much wealthier metro area than Spokane (expressed by the orange slice): its per capita GDP in 2014 was $65,000, roughly 75 percent higher than in Spokane ($38,000). Hartford may thus have much greater local fiscal capacity to invest in strategies that could help improve adult employability (participation), prevent teen and unplanned pregnancies (stability), or increase firm productivity (growth). Efforts to help cities and regions achieve more inclusive economic outcomes will need to recognize these local differences.
In a subsequent post, Brookings will discuss the metro areas it found to be similarly situated on inclusive economy characteristics, which point to groups of places that could benefit from shared strategies to improve economic outcomes for their residents.
John Irons is managing director, Global Markets, of the Rockefeller Foundation, which provides financial support for Brookings.


Commentary
Measuring “inclusive economies” in metropolitan America
May 12, 2016