The last decade and a half has been a rollercoaster ride for metropolitan areas in the nation’s South and West. In the early 2000s, migration swelled in many of them, only to fall off during the recession and years immediately thereafter. But census population estimates through July 2015, released last week, make plain that the Sun Belt metro migration lull has not only subsided, as was hinted at last year, but could be on a pace for substantial gains in metropolitan areas in the Southeast, Texas, and Mountain West for the remainder of the decade.
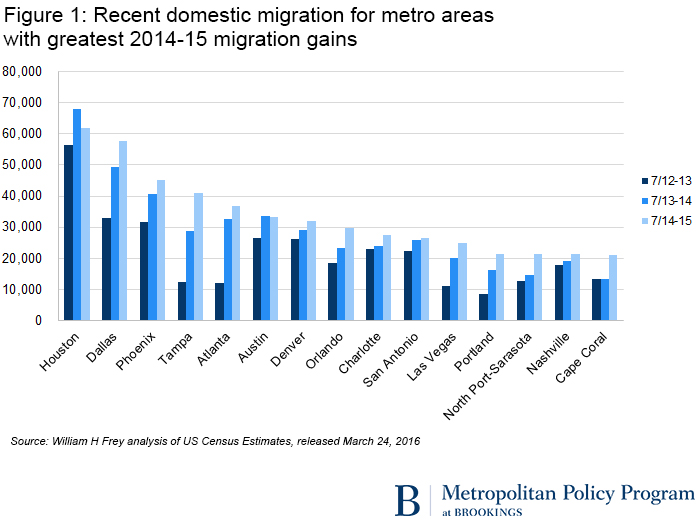
The new data show that 52 of the nation’s 100 largest metropolitan areas experienced domestic in-migration in 2014–2015, of which 46 are located in the South and West region (exceptions being Kansas City and Omaha, as well as the state capitals Columbus, Des Moines, Indianapolis, Omaha, and Harrisburg, Penn.). In most of these, including 13 of the 15 greatest gainers (Download table) all in the Sun Belt, the volume of domestic migration in 2014–15 was larger than in each of the previous two years (Figure 1). This includes Texas metro areas, Dallas and San Antonio; Florida metro areas, Tampa, Orlando, North Port-Sarasota, and Cape Coral; as well as others in the Southeast and Mountain West.
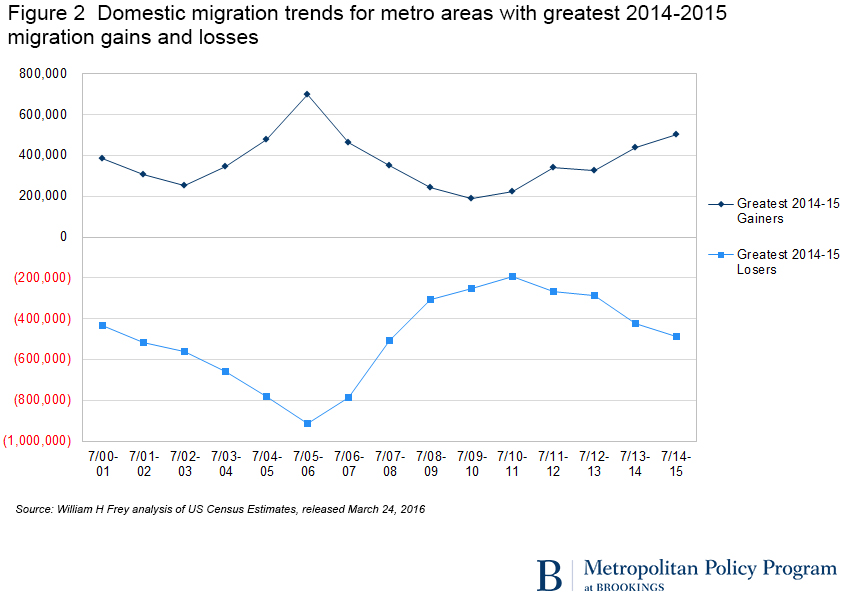
These continued migration gains are especially notable in light of the ups and downs these metropolitan areas experienced since 2000. As a group (and among each individual metro area) the recession and immediate post-recession period showed noticeably smaller migration gains and, in some cases (Orlando and Las Vegas), net migration losses before picking up modestly in the 2010–12 period. But over the past three years, migration increases have been more consistent (Figure 2). This is especially notable for metropolitan areas like Phoenix and Las Vegas, which along with many Florida metro areas, were the victims of sharp downturns during the housing crisis years.
Of course some markets will experience more growth than others. The recent decline in oil prices could well impact migration trends for places like Houston which, while leading all metro areas in migration gains in 2014–15, showed lower in-migration than in 2013–2014.
The flip side of greater gains for Sun Belt metro areas are increased flows out of more costly or less economically vibrant areas, largely in the Northeast and Midwest. Among the 15 areas with the greatest migration losses in 2014–15, 13 lost more migrants than in each of the previous two years (Download table). The greatest migration losses were shown for metropolitan New York, Chicago, and Los Angeles. For them, as with most of these areas, migration outflows abated somewhat during the recession and post-recession years, but are now picking up again (Figure 2). One especially noteworthy dynamic for this period is the increased outflow from the coastal California metropolitan areas of Los Angeles and San Diego into Riverside further east, as well as into Las Vegas and Phoenix. These eastward flows which peaked sharply in the early 2000s, and declined during the recession, are now showing a revival.
A related trend to the new migration to the Sun Belt is the shifting pattern of suburban movement within metro areas. Depressed housing markets and declining fortunes of young adults in their prime household formation and migration ages led to a downturn in suburban growth during almost the same period that Sun Belt growth waned. But there are now signs that movement toward the suburbs, as well, is on the upswing. Based on a county typology designed to distinguish between urban cores, higher density “mature” suburban counties, and lower density “emerging suburbs and exurbs,” the new data show increased out-migration from urban cores and modest migration gains in lower density suburbs (Figure 3).
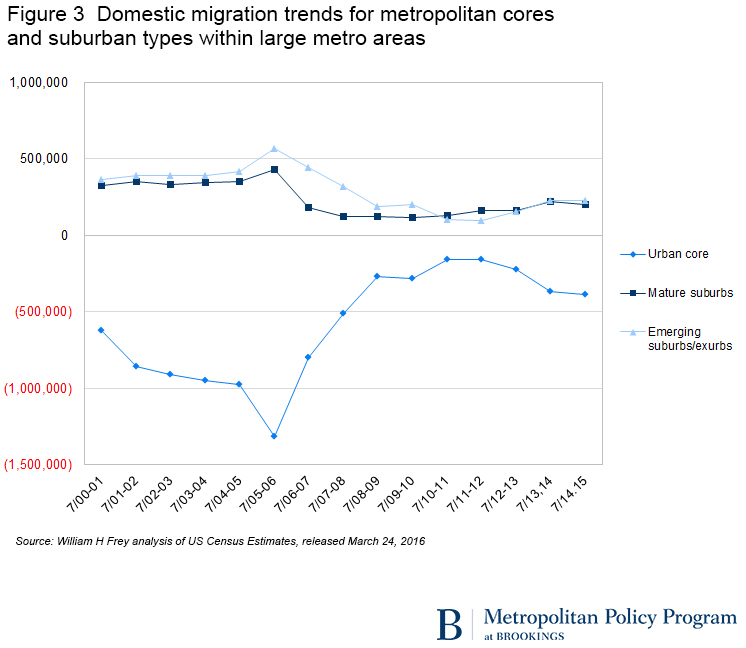
These intra-metropolitan migration shifts are not as marked as the regional shifts favoring the Sun Belt metro areas. But there is a relationship between them in that the greatest gaining emerging suburban and exurban counties are located within the fast growing Sun Belt metropolitan areas of San Antonio (Bexar Co., Tex.), Austin (Williamson Co., Tex.), Houston (Montgomery Co., Tex.) and Orlando (Lake Co., Fla.). At the other extreme, the greatest out-migration from core counties occurred in large metropolitan areas, including Los Angeles, Chicago (Cook Co., Ill.) and the combined New York City counties of Brooklyn, Queens, Manhattan, and the Bronx.
The new statistics showing trends through mid-decade provide a strong clue as to what to expect in the next five years. The upswing in many Sun Belt metro economies suggests that these migration trends may continue, perhaps making the 2010–2020 decade a mirror image of the previous decade: This time with Sun Belt migration picking up, rather than falling off, toward the end of the decade and with suburban growth, at least within Sun Belt metro areas, reviving as well.


Commentary
Migration to Sun Belt metro areas continues to surge
March 31, 2016