That a lot of voters are angry this year is a truism. What’s less clear as the campaigns head for big states like Ohio and Florida is the source of the anger.
Tom Edsall fingers the “end of net upward mobility” and the “shrinkage of the middle class.” Norman Ornstein points to the Wall Street bailouts after the financial collapse of 2008. And for that matter, Jared Bernstein of the Center on Budget and Policy Priorities stresses the frustration of decades of stagnant to declining real wages for low- and middle-earning workers.
All of which seems about right. However, the Rust Belt geography of the nation’s anger suggests another, perhaps deeper, explanation for the populist rage that has driven Donald Trump and Bernie Sanders victories in primaries from New Hampshire to Michigan.
Take a look at this single, stark chart depicting the 35-year history of U.S. employment in manufacturing industries.
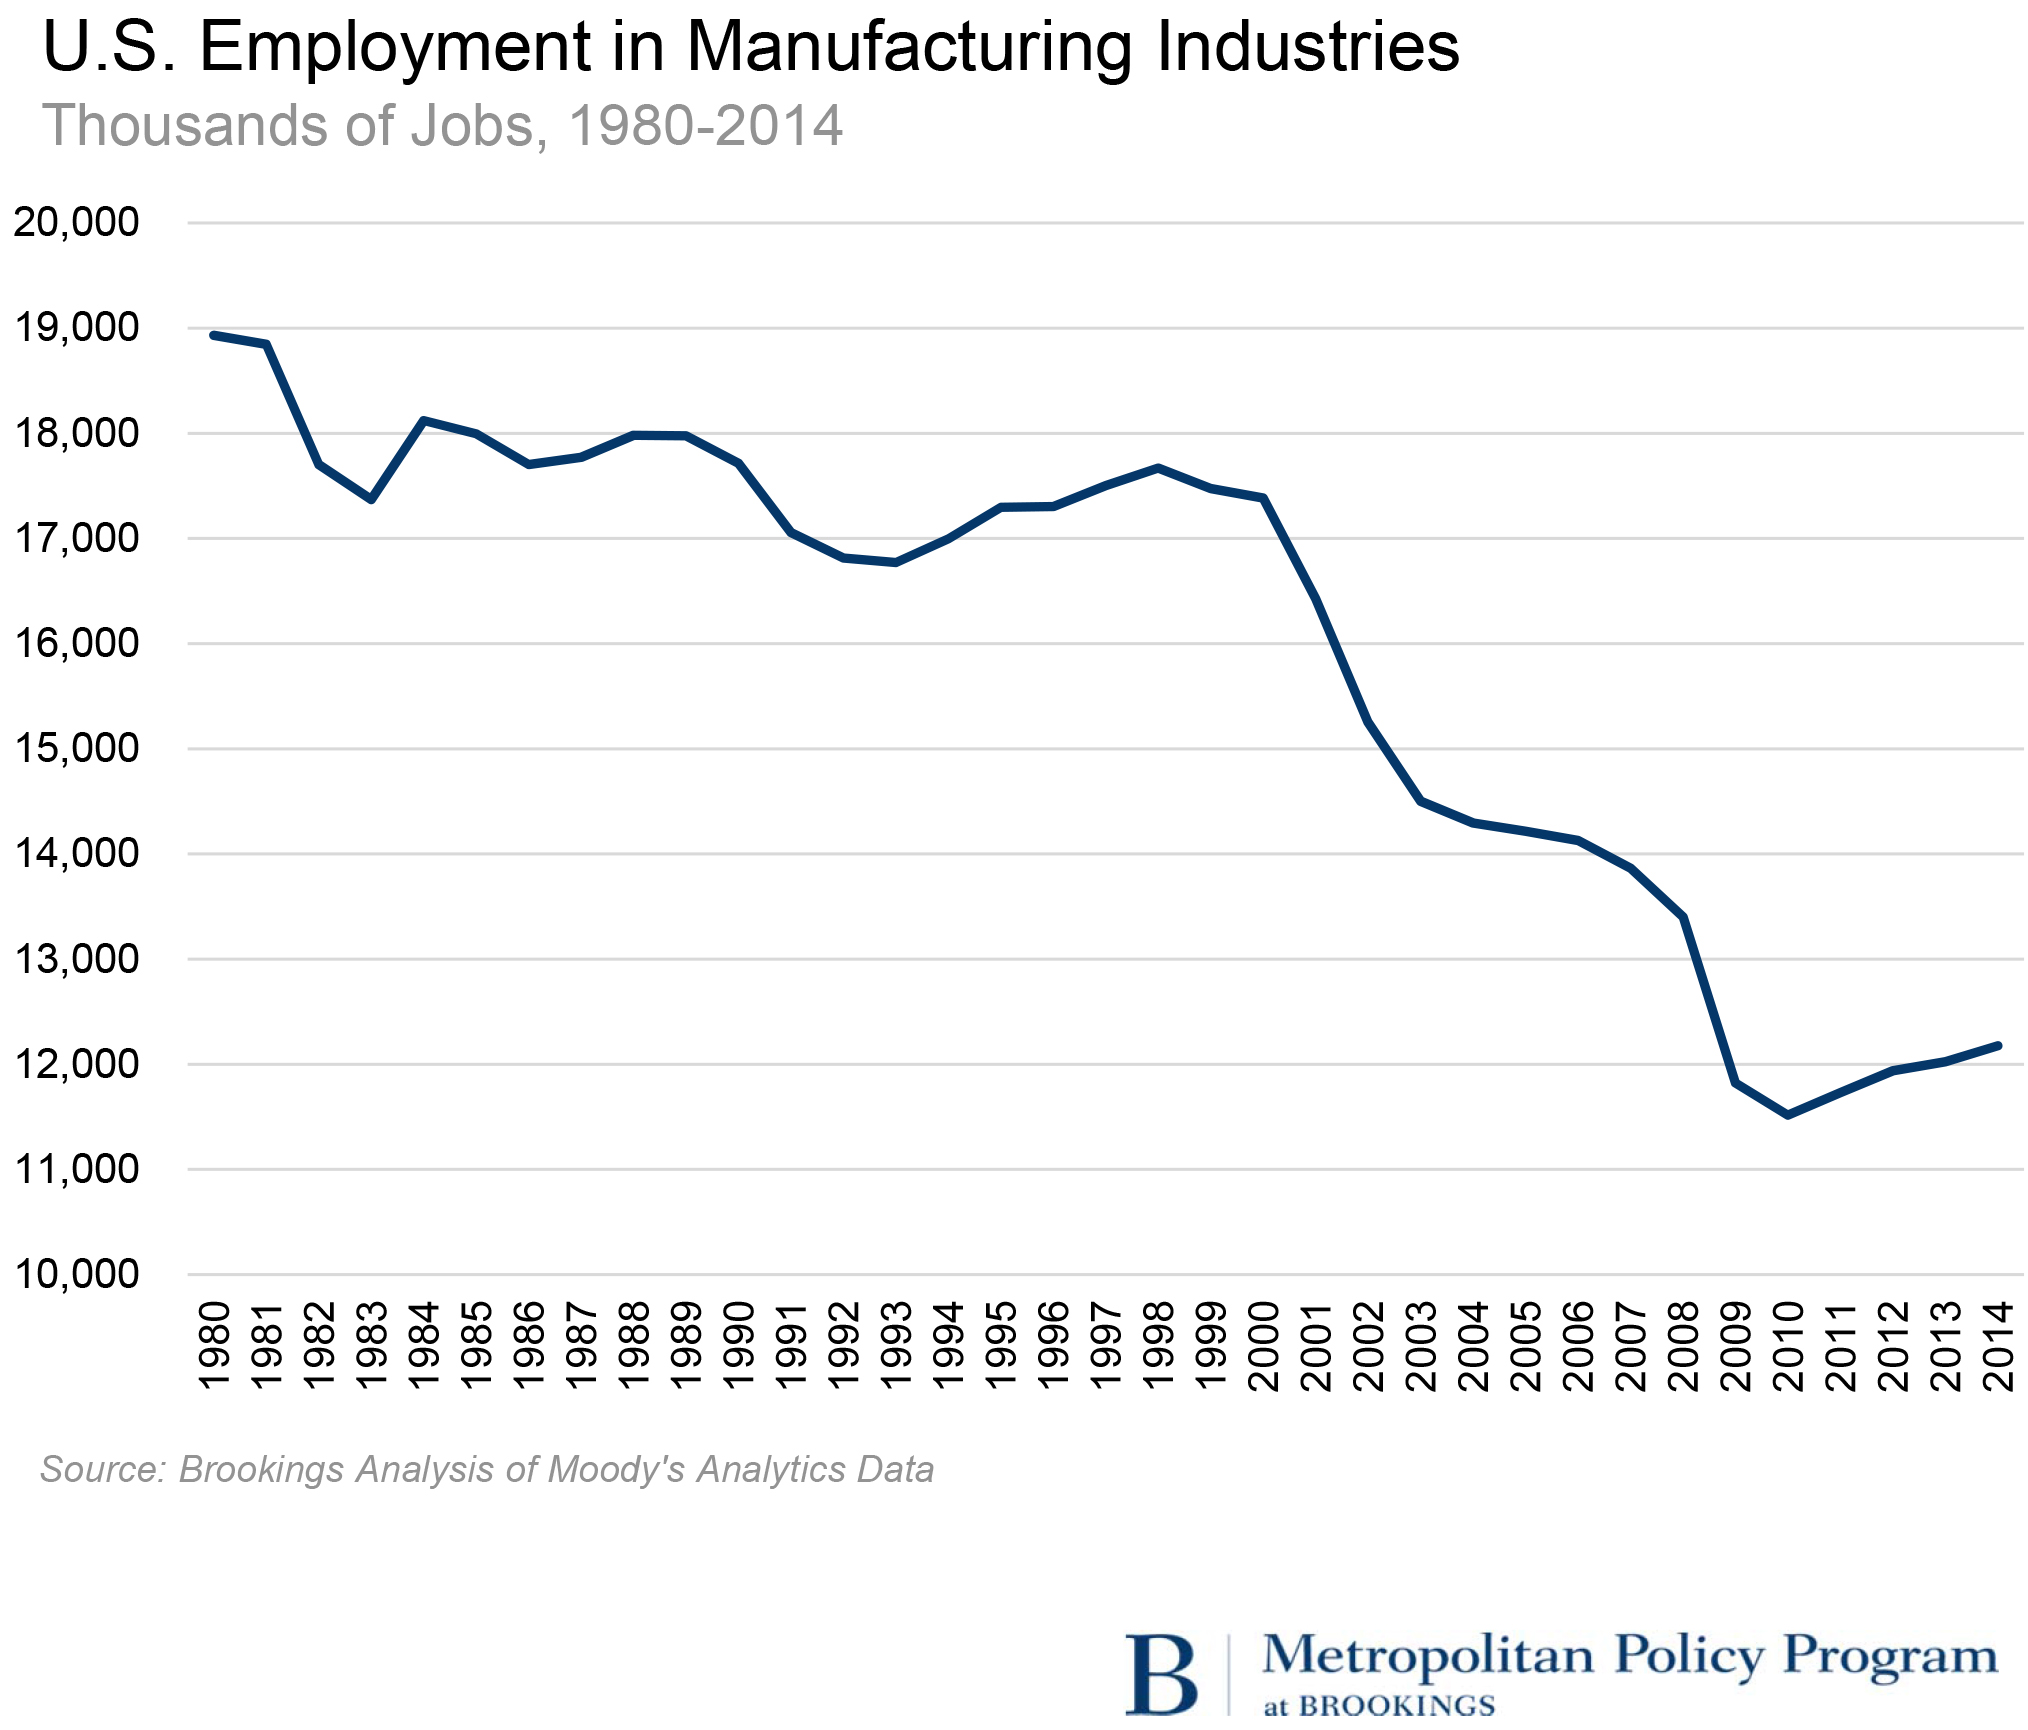
Reflecting decades of deindustrialization, it displays one of the most crucial sources of anger among working-class Americans—including those in upcoming primary states like Wisconsin and Pennsylvania.
In this regard, the chart traces not just the demolition of labor-intensive commodity manufacturing in America but also a crucial source of this year’s backlash against Wall Street, managerialism, and globalism especially in Rust Belt states.
According to these data, globalization, offshoring, and automation have since 1980 liquidated nearly 7 million manufacturing jobs in U.S. communities—more than one-third of U.S. manufacturing positions—as manufacturing employment plunged from 18.9 million jobs to 12.2 million. Moreover, as the chart depicts, while the trend is longstanding, it actually accelerated in the 2000s.
As to the labor-market, wage, and social impacts of these developments, they have been brutal—as is well-known. Notwithstanding the heralded consumer benefits of trade and deindustrialization, these trends have also created substantial adjustment costs and distributional consequences in the labor market, with much of the pain visited on blue-collar workers in manufacturing-oriented metro areas. Exacerbating all of this, meanwhile, was the onset of what the economists David Autor, David Dorn, and Gordon Hanson call the “China shock”— the period beginning in 1991 when local factories found their outputs competing directly with Chinese imports. Those wondering about the deepest sources of populist anger in 2016 will find no better guide than the same authors’ painstaking new analysis of the regional and worker impacts of the China shock. Autor, Dorn, and Hanson show that the arrival of cheap Chinese imports demolished manufacturing in scores of communities, produced widespread unemployment, disrupted workers’ careers, and depressed wages for years. Most poignantly, the scholars show that deindustrialization’s losers have experienced difficulty in exiting threatened jobs, a hard time finding and keeping new employment, an inability to relocate, and diminished lifetime earnings.
No wonder they are frustrated. Only recently stabilized, the decline of U.S. manufacturing remains the primal scene of economic dissatisfaction, and the impacts are still being felt.
Related Content
Authors


Commentary
Voter anger explained—in one chart
March 15, 2016