The U.S. Commerce Department reported today that GDP growth slowed to an annual rate of 0.7 percent in the fourth quarter of 2015, stoking fears about whether the ongoing recovery from the Great Recession can sustain momentum in the face of global economic instability.
Meanwhile, Brookings’ new Metro Monitor reminds us that GDP growth offers, at best, a very incomplete measure of economic well-being.
The Metro Monitor examines economic progress in our nation’s largest metropolitan areas, primarily during the national economic recovery that began in 2009. Change in Gross Metropolitan Product, the regional analogue of GDP, is one of the key indicators in our “growth” category, alongside employment and aggregate wages. As we report, 95 of the 100 largest metro areas experienced increases in all of these measures from 2009 to 2014.
Yet growth in metro economies did not reliably improve all residents’ economic fortunes.
On average, the faster a metro economy grew, the more likely it was to experience improvements in inclusion, defined by indicators including median wages, relative poverty (the share of workers earning less than half of median wages), and employment rates. Many metro areas that ranked higher on our growth index (first being best) also ranked higher on our inclusion index, a relationship represented by the points in the lower left and upper right-hand quadrants of the chart. San Jose, for instance, was the highest-ranking metro area for growth, and the third-highest-ranking for inclusion. Albuquerque, by contrast, ranked 99th and 100th in the two categories.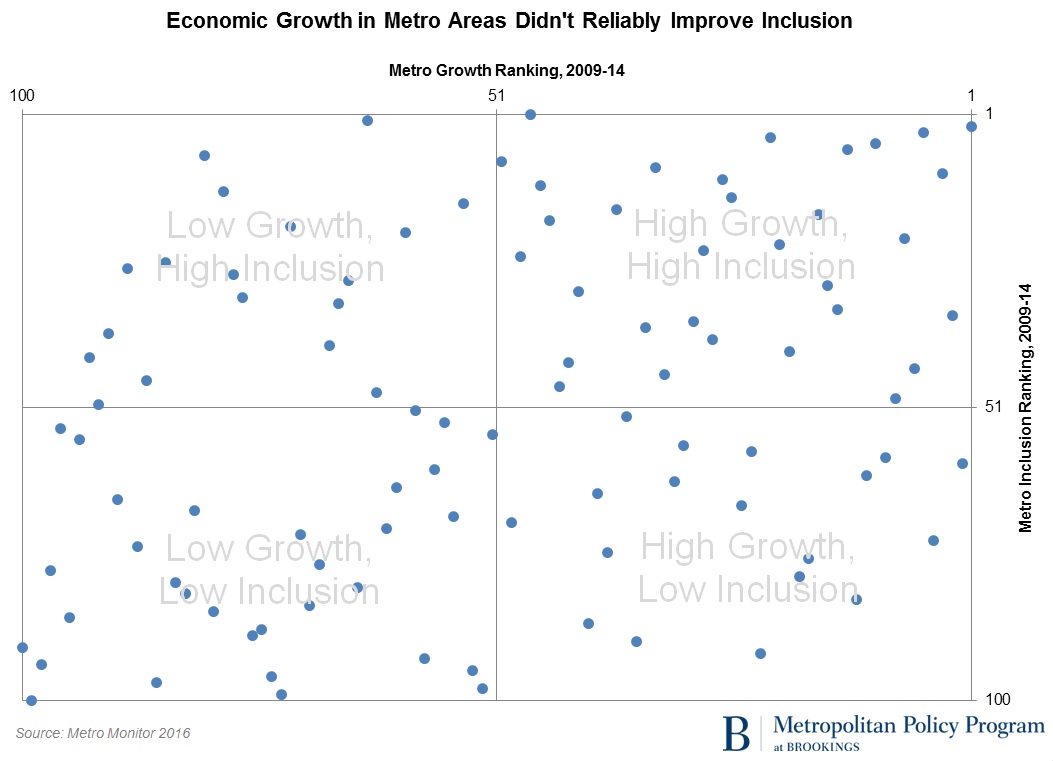
But the chart also shows that this growth/inclusion relationship was relatively weak. Many metro areas that had high growth performed worse than their peers on inclusion, and vice versa (the upper left and lower right-hand quadrants). Nashville’s economy grew at a rapid rate from 2009 to 2014, ranking fifth among metro areas, but median wages fell and relative poverty rose. In Springfield, Mass., however, relative poverty dropped significantly, ranking the metro area second for inclusion, despite anemic overall growth that ranked the metro area 64th among the 100 largest.
This finding echoes another Brookings analysis from earlier this month which reported rising rates of income inequality in metro areas over the past several years. San Francisco, which registered one of the largest increases in income inequality among major metro areas in that report, ranked ninth on our Metro Monitor growth index from 2009 to 2014, but only 49th on our inclusion index, due to stagnating median wages and rising relative poverty.
Some observers will wring their hands over the latest quarterly GDP data, despite the fact that the longer-run growth rate has remained pretty consistent over the past few years. But it’s also worth remembering that in the true metropolitan hubs of the U.S. economy, the pace of recent economic growth hasn’t revealed much about whether we are resolving larger challenges around providing improved economic opportunities for all.


Commentary
In metro areas, growth isn’t reliably trickling down
January 29, 2016