The latest poverty data from the U.S. Census Bureau underscore the uneven nature of the economic recovery since the Great Recession. While some major metro areas are slowly starting to make progress, for most regions poverty rates and poor populations continue to outstrip their pre-recession levels. An analysis of 2014 American Community Survey data on people living below the federal poverty line (e.g., $24,230 for a family of four in 2014) in the nation’s 100 largest metro areas finds:
Between 2013 and 2014, the major metro area poverty rate fell slightly for the first time since the onset of the Great Recession.
Taken together, the poverty rate for the 100 largest metro areas edged down by three-tenths of a percentage point between 2013 and 2014—from 15.0 to 14.7 percent—which means the poor population fell by 274,000 to reach 30.5 million. Both the poverty rate decline and decline in poor population were statistically significant.
However, the modest decline in the poverty rate was largely driven by just 14 metro areas, including Greensboro-High Point and Jackson in the South; Denver, San Jose, and Seattle in the West; and Chicago and Detroit in the Midwest. And only 12 of those regions registered a statistically significant decrease in the number of poor residents: Houston and San Francisco’s poverty rates fell because the poor population held steady while overall population grew. (See the appendix for detailed data.)
Only one region—the Nashville metro area—experienced an uptick in both the poor population and poverty rate between 2013 and 2014. The Bakersfield and Austin regions also saw their poor populations grow, but broader population gains kept their poverty rates unchanged.
For most major metro areas (85 of the top 100), 2014 brought no significant change to their poverty levels compared to the year before.
Between 2013 and 2014, eight metro areas saw the poverty rate in their core cities fall, while five registered decreases in the suburban poverty rate.
For the second year in a row, cities experienced a slight decline in their collective poverty rate. In 2014, 20.9 percent of city residents in the nation’s largest metro areas lived below the poverty line—a 0.4 percentage-point decrease from 2013. Yet among individual metro areas, only eight—primarily in the South (e.g., Chattanooga, Jackson, and Palm Bay) and West (e.g., Denver and San Jose)—saw statistically significant decreases in their urban poverty rate. At the same time, three regions experienced increases in the share of city residents living in poverty, including Knoxville, Nashville, and Salt Lake City.
For the first time since the recession, suburbs also experienced a small decrease in their overall poverty rate, which fell from 12.1 percent to 11.8 percent between 2013 and 2014. But among individual metro areas, only five actually registered a statistically significant decline in their suburban poverty rate—Houston, Salt Lake City, New Orleans, Seattle, and Worcester—and only the last three did so amid decreases in in the number of suburban poor.
Most major metro areas continue to face higher poverty rates than when the recession began.
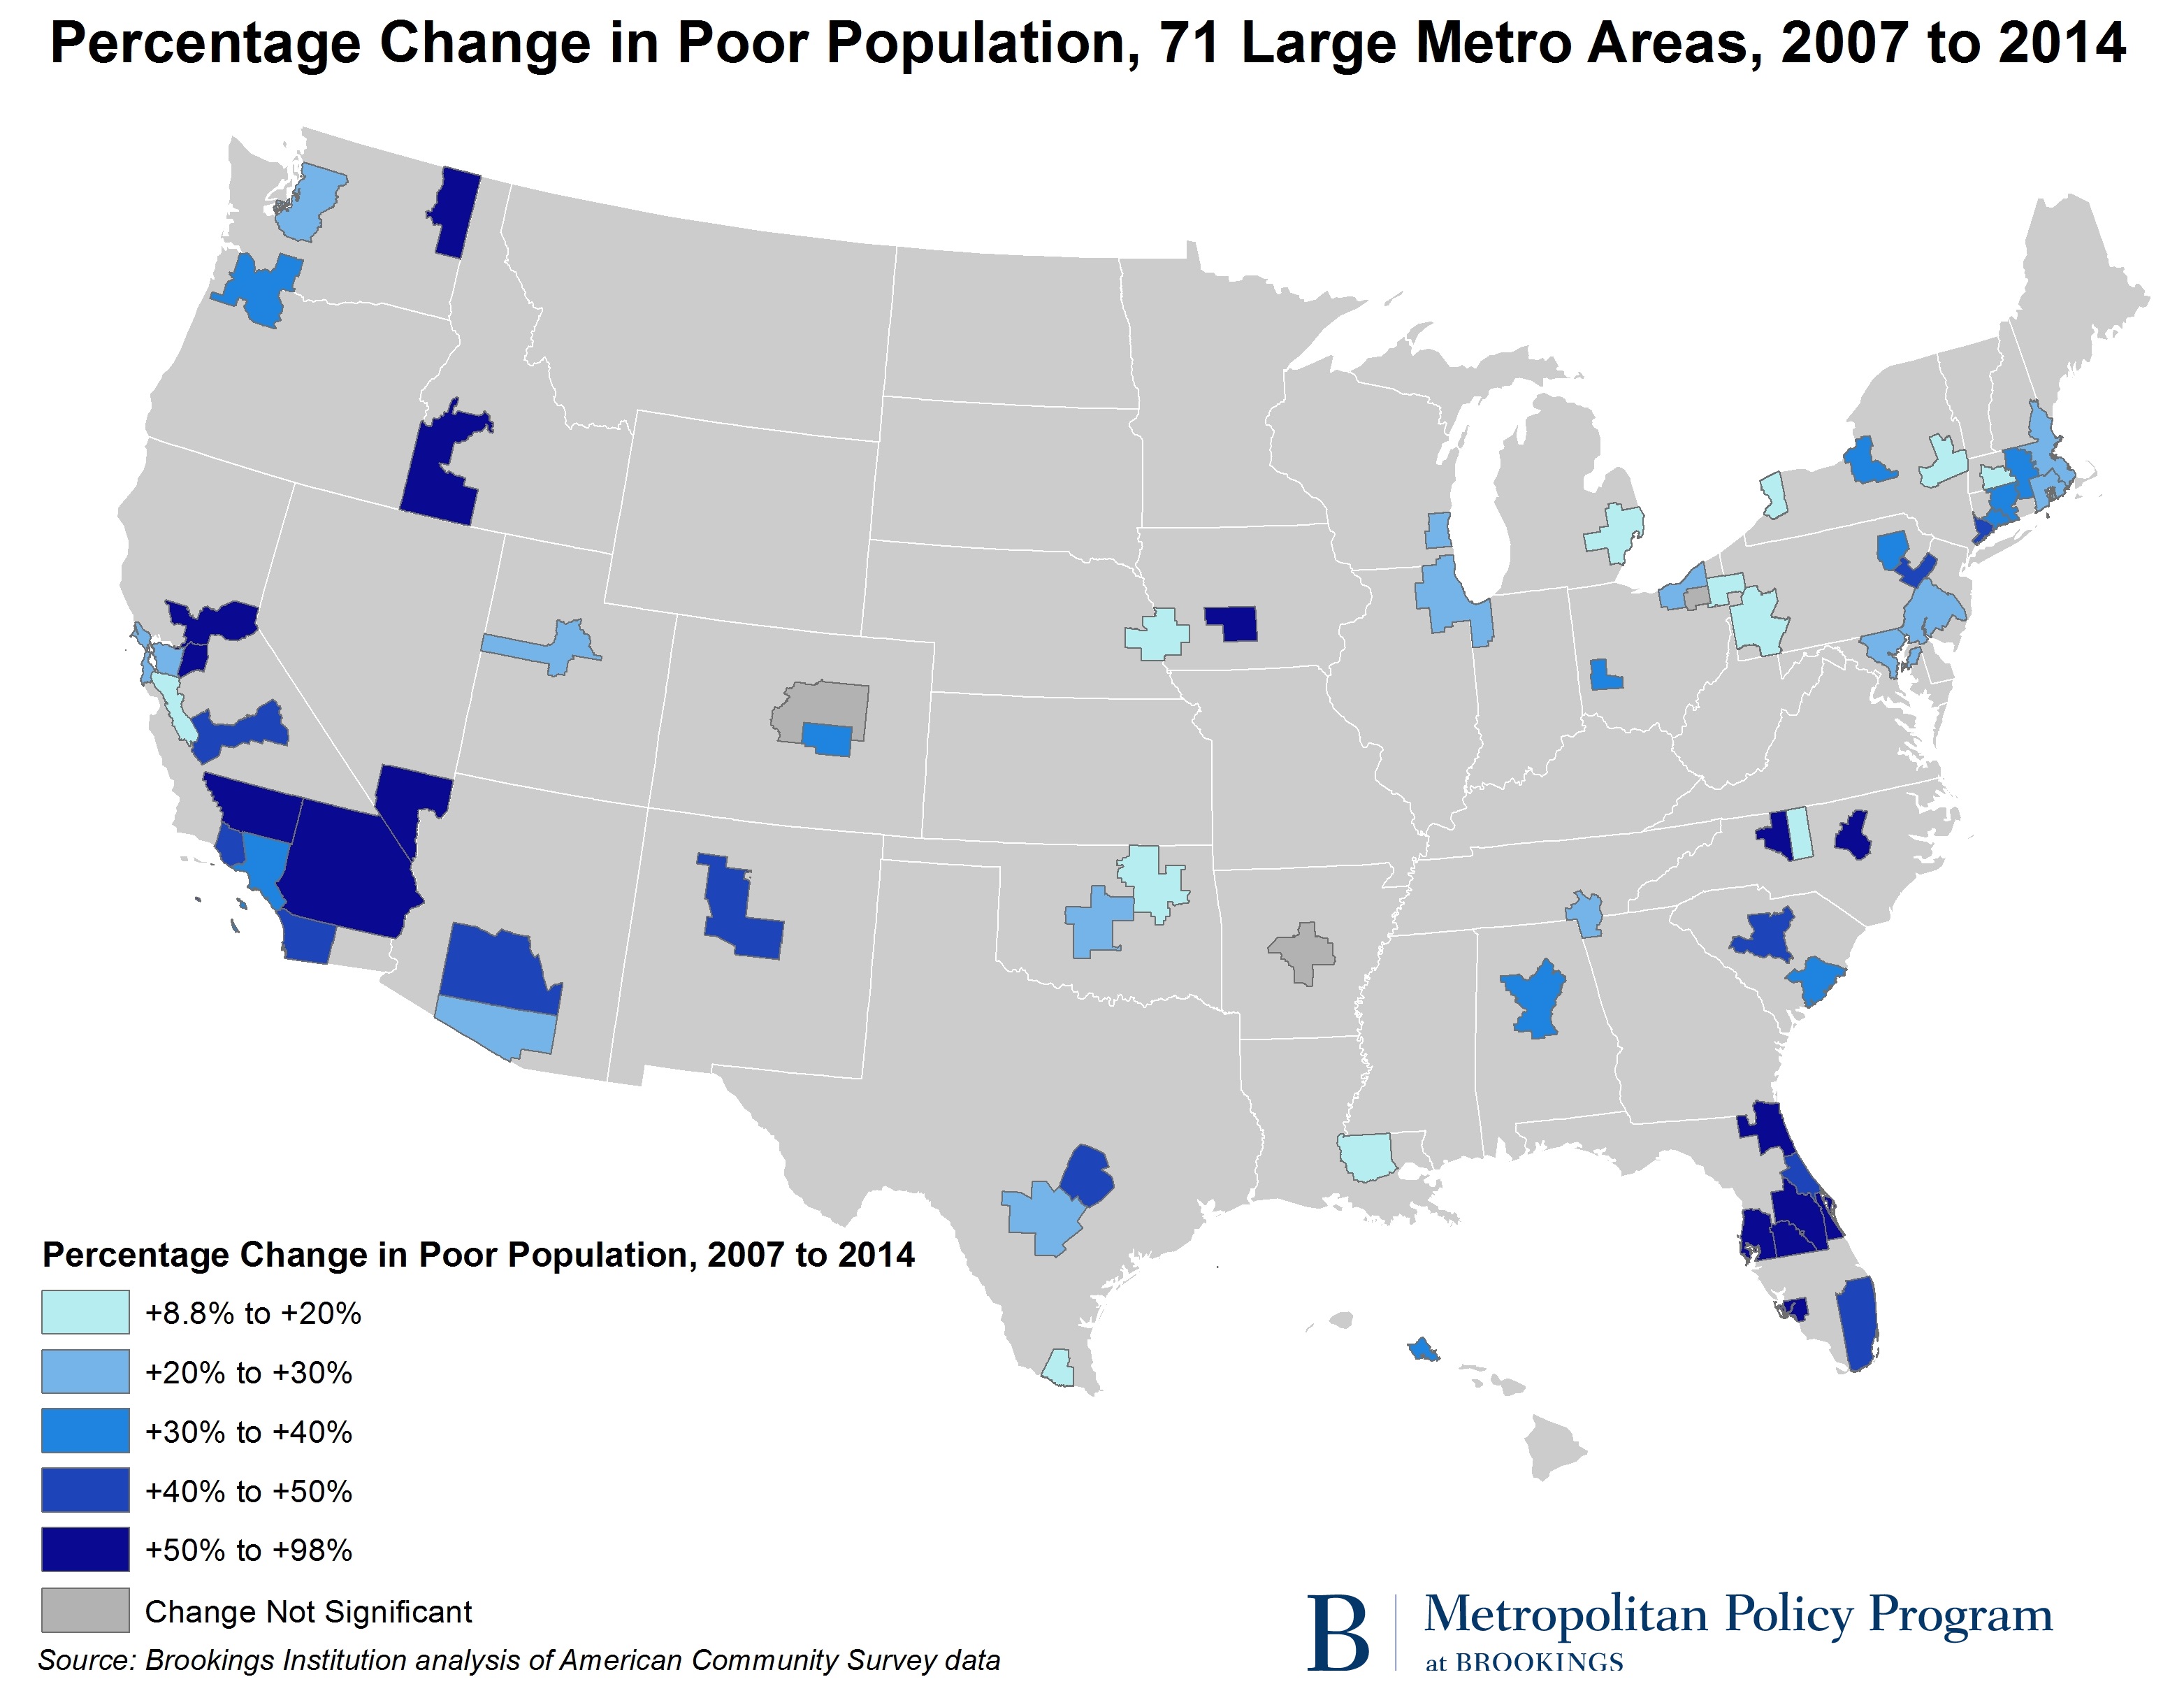
Among the 71 large metro areas for which we have comparable data, 59 continued to see 2014 poverty rates stuck above pre-recession levels. (See this note on methods.)
What is more, 68 regions had a significantly larger poor population in 2014 than in 2007, and 16 had poor populations that were at least 50 percent larger in 2014. All but one of those metro areas are Sun Belt regions in the South and West hit hard by the collapse of the housing market.
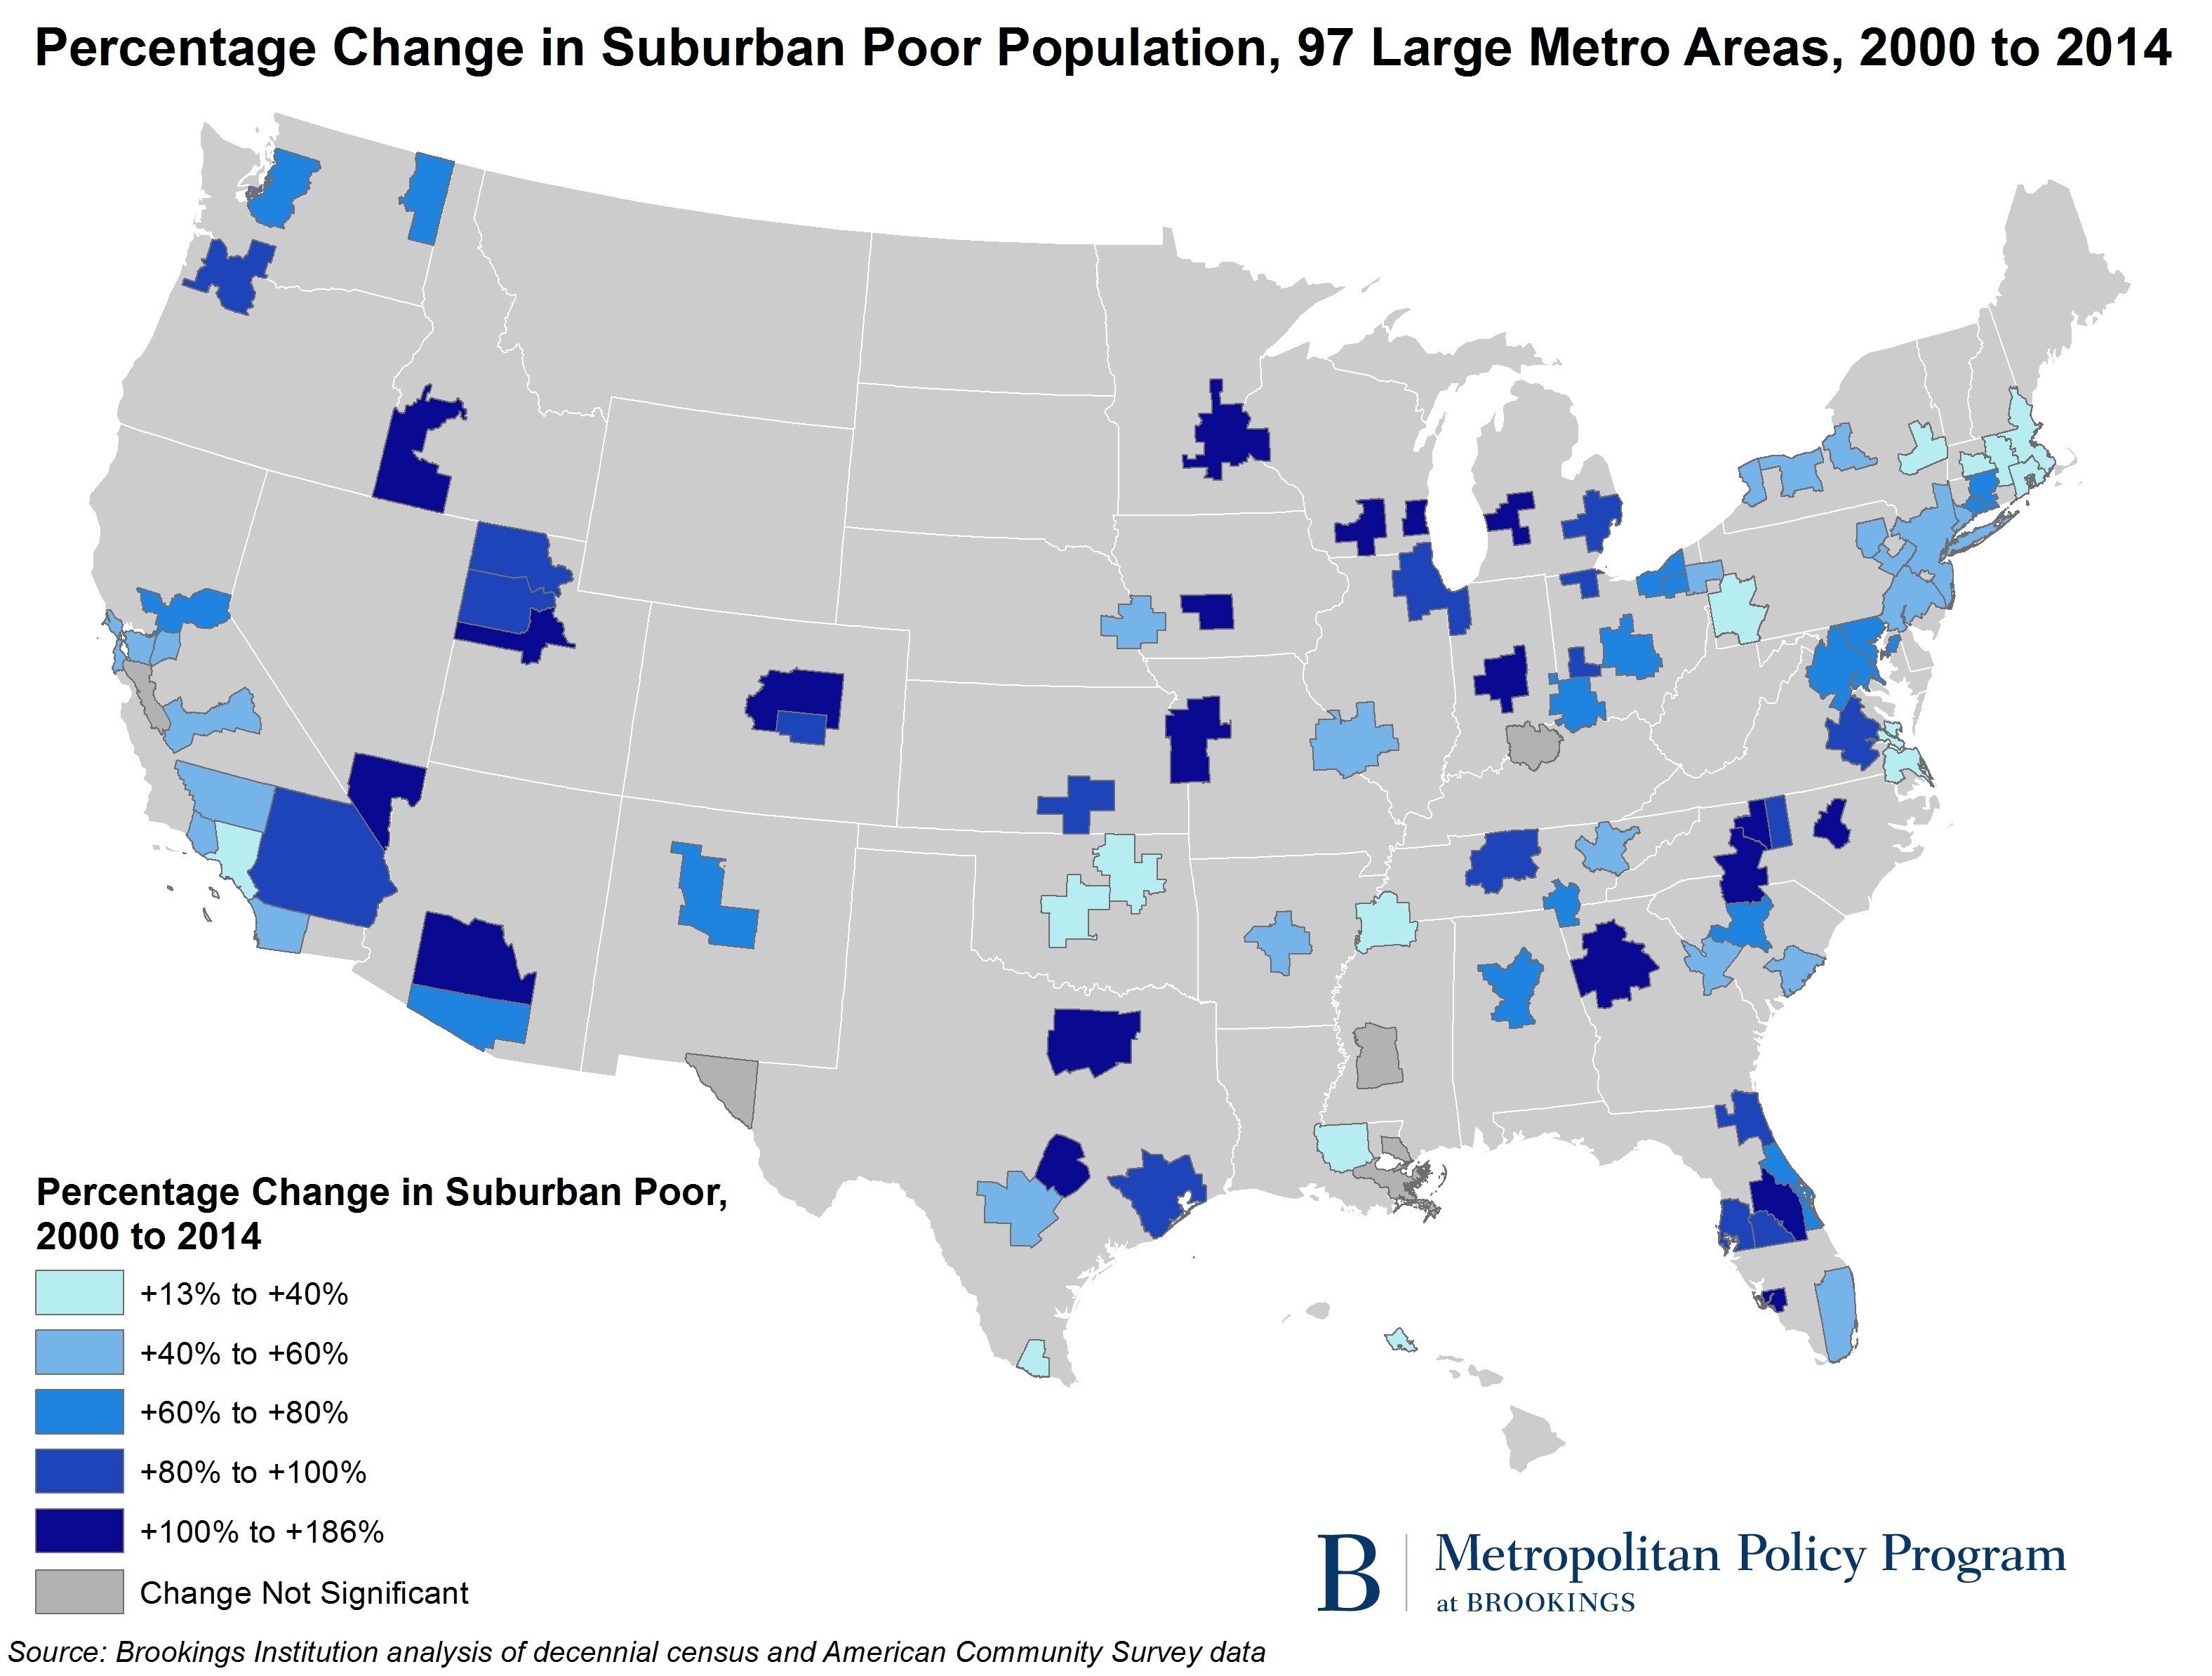
Since 2000, the major metro poor population has grown by 9.7 million, and more than two-thirds of that growth occurred in suburbs.
All but one major metro had a larger poor population in 2014 than in 2000 (the exception is New Orleans), reflecting in part the impact of two economic downturns and two uneven recoveries that saw incomes stagnate and low-wage jobs grow. Within these metro areas, poverty grew fastest in the suburbs: Suburbs saw the poor population increase by 65 percent between 2000 and 2014, compared to a 29-percent uptick in big cities.
In 20 metro areas the suburban poor population more than doubled between 2000 and 2014, including Southern metro areas like Austin (186 percent) and Atlanta (149 percent) as well as Midwestern regions like Indianapolis (119 percent) and Grand Rapids (109 percent).
Five years into an economic expansion, the new Census data bring home the extent to which uneven growth has largely left low-income people behind. Some regions are beginning to bend the numbers in the right direction, but on the whole metro areas have yet to recover the ground they lost due to the Great Recession.


Commentary
New Census data finds scant progress against poverty
September 18, 2015