The Internet of Things is hard to track. As I point out in Pax Technica, what makes it hard to estimate the size of the Internet of Things (IoT) is the fact that the addressing system for devices is changing. The Carna Bot found 1.3 billion devices with an IPv4 address in 2012. Engineers expect so many of these connected devices that they have reconfigured the addressing system to allow for 2 to the 128th power addresses–enough for each atom on the face of the earth to have 100 Internet addresses.
The IoT is developing now because we’ve figured out how to give everything we produce an address, we have enough bandwidth to allow device-to-device communications, and we have the capacity to store all the data those exchanges create.
There are over 30 different sources—from full on commissioned research reports to vague press releases—about how the Internet of Things is growing. It is hard to get a consistent punchline from all the different ways of counting the Internet of Things, but the figure below puts all the estimates together so we can at least see what the trend line might be. In the absence of good consistent census data, evaluating, and reconciling estimates is the next best way to think about the most plausible trend lines. The figure includes two trend lines, one for the count of the human population on the planet and one of the count of the population of connected devices. The projections go through to the year 2025 and the counts are in billions. Human population data is from the “medium scenario” of the latest UN Population revision.
The figure includes two milestones. The first is the year the “Internet of Things” was coined as a term—1998. The figure also reveals the crossover point between the two trend lines. This second milestone is around 2014, and it marks the point at which the number of devices communicating with each other surpassed the number of people communicating with each other.
Knowing a bit about how analysts generate these numbers, I have shaded the data points that represent projections for the years ahead. Many of the data points from 1995 to 2015 are best guesses, are unreproducible, are taken from another source, or are poorly explained. But as a set, at least these past values are internally consistent so we may have some confidence in them. The research that went into the values from 2015 forward are only guesses or projections laden with assumptions. They are often poorly explained and unreproducible because the notes on how they were created are hidden behind paywalls. Some are industry sales projections, which are often aspirational. So I colored all the values up to and including Gartner’s 2015 estimate. We should have less confidence in all estimates after that point. Numbers from chip designers and makers, such as Intel and Cisco, are probably among the most credible.
These numbers vary greatly. Gartner always speaks of the “installed base” to distinguish between the number of chips that get made and the number that are actually embedded into objects and shipped out to consumers. Some numbers are specific to consumer electronics or smart meters. Some reports simply refer to human made objects embedded with chips.
The number 50 billion connections by 2020 has been parroted across multiple industry documents. For some researchers this means the number is being repeated without verification. But at this point it also appears to be credible enough that the technology industry is sticking to it.
How big is the Internet of Things?
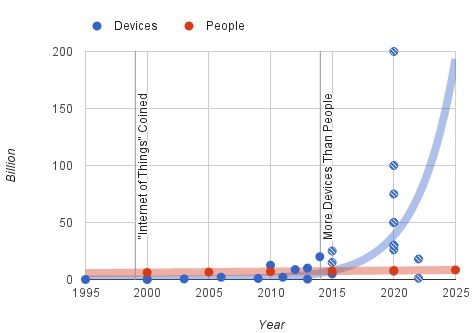
Source: Author’s calculations based on data from ABI Research (2013), Business Insider (2013), Cisco (2013, 2015), EMC (2014), Ericsson (2011), Forbes (2013), Gartner (2013), Hammersmith Group (2010), Intel (2014), Internet Census (2012), Internet World Stats (multiple), Machina Research (2013), Navigant Research (2013).
Note: You are welcome to the raw data.
Bullish industry estimates suggest that in five years there will be billions of devices connected to the IoT generating trillions of dollars of value for the economy. So why even compare these numbers? The excitement about IoT is rising to feverish levels and it is interesting to watch how much traction these reports get, and in an important way the projections of lots of devices and huge profits drive industry to make devices and seek profits. Statements like “scientists are talking about trillion-sensor networks within 10 years” seem destined to be wrong. It is worthwhile and fun to track the increasingly aggressive predictions that come from analysts. If there is going to be some public policy guidance on the openness and interoperability of the IoT, now is the time to craft it.
Part one of this post is available here.
IoT of Source Data
|
Year |
Devices |
What |
|
1990 |
0.0001 |
|
|
1995 |
0.005 |
|
|
2000 |
0.1 |
|
|
2000 |
0.2 |
|
|
2003 |
0.5 |
|
|
2006 |
2 |
|
|
2009 |
0.9 |
|
|
2010 |
12.5 |
|
|
2011 |
2 |
|
|
2012 |
8.7 |
|
|
2012 |
1.3 |
|
|
2013 |
10 |
|
|
2013 |
0.313 |
|
|
2014 |
20 |
|
|
2015 |
25 |
|
|
2015 |
4.9 |
|
|
2015 |
15 |
|
|
2020 |
30 |
|
|
2020 |
75 |
|
|
2020 |
50 |
|
|
2020 |
30 |
|
|
2020 |
50 |
|
|
2020 |
7.3 |
|
|
2020 |
100 |
|
|
2020 |
200 |
|
|
2020 |
26 |
|
|
2022 |
18 |
|
|
2022 |
1.1 |


Commentary
Sketching out the Internet of Things trendline
June 9, 2015