After President Obama’s re-election, many pundits identified the campaign’s digital outreach effort as a key component to the victory. The consensus was that the Obama voter turnout machine had taken advantage of new technologies including social media while Republicans remained a decade or more behind. In order to extend their competitive advantage, the Democratic Senatorial Campaign Committee created the Bannock Street Project. Some have argued that the Republican takeover of the Senate provides evidence that Bannock Street was a failure. There is some preliminary evidence that the program may have benefited Democratic Senate candidates. To further investigate the program we examine the available evidence on the effectiveness of the Bannock Street Project.
Evidence of Higher Turnout Overall
Prior to the election, there was some evidence that voter outreach efforts were working as planned. NGP VAN, which provides the platform that most Democrats use to record contacts with donors, volunteers, and voters, released some preliminary figures about outreach efforts. The company claims that Democratic campaigns and affiliated political organizations had 386,889,562 voter contacts in 2014 (as of November 3rd). This represents an increase of 68 percent from 2010. NGP VAN also announced that the same organizations were responsible for registering over 2.3 million voters.
Success in Targeted States
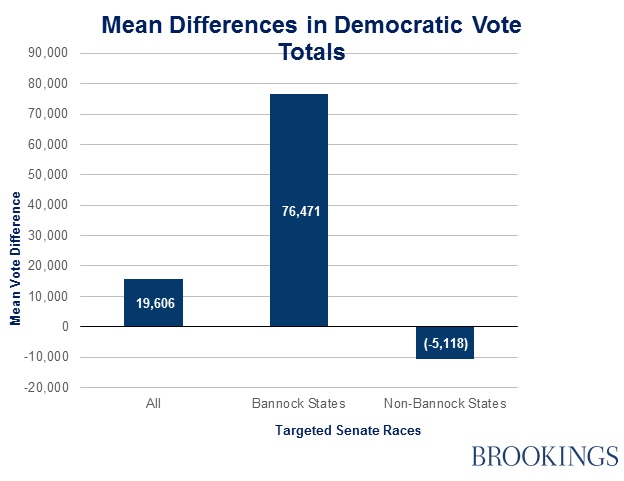
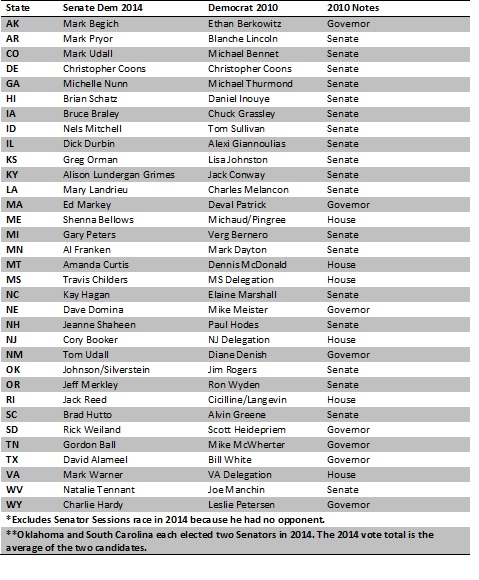
To evaluate the DSC’s program we compared the vote totals of Democratic Senate candidates in 2014 with Senate candidates from the same state in 2010. 2010 provides a more rigorous comparison than 2012 because it was a midterm election where Republican candidates also had success. If a Senate candidate was not available then the votes for the Democratic Gubernatorial candidate were included, and in lieu of that the sum of the votes for Democratic House candidates were used. The Bannock Street Project is specifically focused on ten states: Alaska, Arkansas, Georgia, Iowa, Kentucky, Louisiana, North Carolina, Michigan, Montana and West Virginia. This allows us to compare the vote totals of Democrats in Bannock targeted states with states where the project was not active. On average Democratic candidates received about 20 thousand more votes in 2014 than in 2010. In non-Bannock states candidates earned about 5 thousand fewer votes than in 2010. In the targeted Bannock states, the Democrats received on average about 76 thousand more votes when comparing 2014 to 2010.
To further examine the Bannock Street Project we conducted a regression analysis. We regressed the difference in Democratic vote totals from 2014 to 2010 on a variable indicating the presence of the Bannock project, President Obama’s job approval in that state, and another variable if the candidate was an incumbent. A one-tailed hypothesis test for the Bannock coefficient reveals a statistically significant relationship between the vote difference and the Bannock Street project.
Difference in Votes for Democrats Regressed on Bannock Street Project with Controls
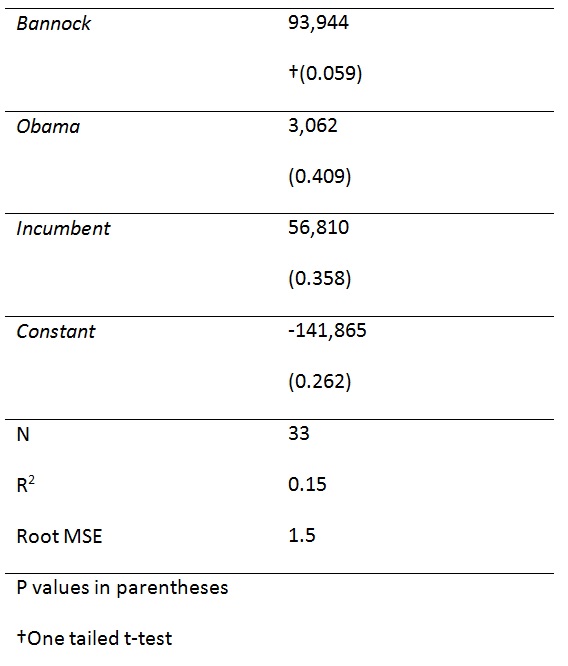
This analysis does not enable conclusive answers about the effectiveness of the Bannock Street Project. There is considerable evidence that other factors including the makeup of the electorate, incumbency, campaign expenditures, strength of the economy, and popularity of the president have a greater impact on election results. In the end, Democrats lost 9 out of the 10 races in Bannock targeted states. More research is necessary before it’s possible to claim that the project is a failure.

Commentary
Did the Democrats’ Digital Voter Outreach Plan Fail? Examining the Bannock Street Project
November 17, 2014