On April 9th, the Center for Medicaid and Medicare Services released Provider Utilization and Payment Data. Releasing this dataset is a big step towards more transparency in government spending. This strategic move enables CMS to outsource the task of analyzing this dataset to tens of thousands of people and benefit from their mass intelligence at a very low price.
Basic analysis of data on payments to individual physicians for outpatient services provides some interesting insights:
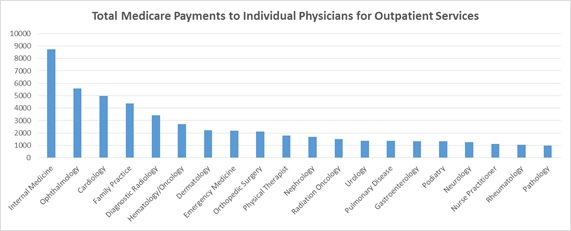
1– 8.7 billion dollars were spent on Internal Medicine, which accounts for 13.6 percent of the total Medicare payments to individual doctors.
Total Medicare Payments to Individual Physicians for Outpatient Services
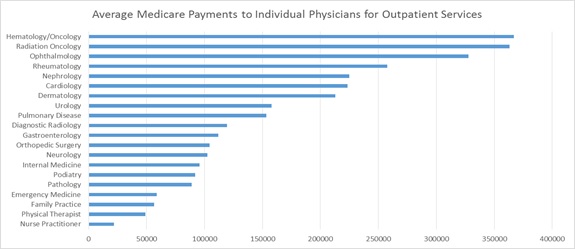
2- The top three highest paid specialties are Hematology/Oncology, Radiation Oncology and Ophthalmology. An average hematologist was paid over 366 thousand dollars. Radiation oncologists and ophthalmologists were paid on average 363 and 327 thousand dollars respectively.
Medicare Payments to Individual Physicians for Outpatient Services
3- As shown in the chart below, there is a considerable difference between the total payment amounts received by physicians within each specialty. While the median payment amount to cardiologists is 167,228 dollars, a Florida based cardiologist has billed Medicare for over 18 million dollars. Similarly, while the median payment to ophthalmologists is only 179,036 dollars per year, an ophthalmologist in Florida received over 20 million dollars from Medicare in 2012.
Medicare Payments Received by Specialty

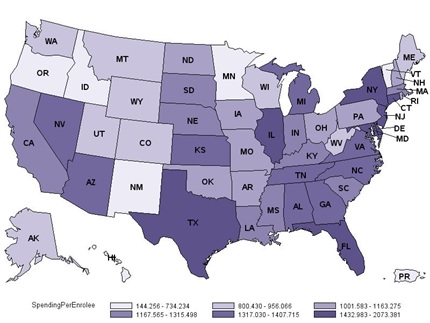
This variation also exists in the average amount of dollars spent per each Medicare enrollee in different states.[1] Washington D.C., spends an average of 2,073 dollars for each Medicare enrollee, in Puerto Rico, this amount is only 144 dollars. In New Jersey, 2,041 dollars was spent per enrollee in 2012, while for enrollees in Idaho, only 619 dollars was spent.
Medicare Spending per Enrollee by State
These payments have been made based on a fee-for-service model. That is, regardless of the quality of the care, Medicare has paid the physicians for the services that they have provided to their patients. Although the detailed quality ratings for individual physicians are still not available through CMS, some aggregated measures such as deaths and length of stay in hospital are available through the Agency for Healthcare Research and Quality (AHRQ). A glimpse of these ratings shows that there is not a strong correlation between per capita Medicare spending and healthcare quality outcomes. For example, despite spending 2,041 dollars per Medicare enrollee in New Jersey, the median length of hospitalization is 4 days and the ratio of deaths in hospitals is 3.57 percent. On the other hand, in Oregon, per capita Medicare spending is only 627 dollars yet the median hospitalization length is 3 days and death rate is 3.3 percent.
These observations warrant a rigorous and more detailed study on the causal relationship between Medicare payments and healthcare quality outcomes. Analysis of this data would also help us to realize the potential improvements that pay for performance models would provide. In these models the providers get rewarded for meeting pre-established targets for delivery of healthcare services. This data would be a great basis for setting up optimum quality targets and payment capitations to maximize return on healthcare investments by incentivizing physicians to provide better care at a lower cost.
[1] These numbers represent the Medicare payments to individual doctors for outpatient services and do not include the payments to healthcare organizations or payments for in-patient services.


Commentary
New Medicare Data Reveals Large Differences in Healthcare Spending by Service and State
April 11, 2014