Mobility: A metro issue
Economic mobility is a national challenge but a metropolitan issue. The American Dream is part of the nation’s self-identity: the promise of upward mobility remains a defining feature of American aspiration. But by international standards, intergenerational mobility (in relative, income terms) is unimpressive; nor has it improved in the last few decades. There are also very wide gaps in intergenerational mobility patterns by race. Black Americans in particular have been much more likely to remain stuck in poverty, and much more likely to fall down the income distribution over the generations.
International comparisons, however, have always been awkward. Denmark is nothing like the United States in population size, migration, economic structure, governance, or racial and ethnic composition. Now, thanks to the work of Raj Chetty, Nathaniel Hendren, and colleagues, we know that intergenerational mobility varies tremendously across metropolitan areas within the U.S.. This is important for a number of reasons.
First, the stark intra-U.S. variations show up the limitations of international comparisons. There are cities in the U.S. with mobility rates—Salt Lake City, for instance—that put Scandinavia to shame. But there are many others—Atlanta, Charlotte—with rates lower than any recorded among other rich countries.
Second, these variations offer strong clues about which factors are important for mobility. We now know, for instance, that upward mobility is more likely to happen in places with low residential segregation, strong primary schools, low income inequality, high civic engagement, and high rates of married parents. In their most recent work, Chetty and Hendren have shown that where people grow up has a strong causal effect on adult incomes.
Third, it is even clearer now that sub-national policies (at the city and state levels), tailored to specific localities, are vital for improving social mobility. While the national government remains the primary agent in anti-poverty relief and other redistributive measures needed to elevate the welfare of the least well-off, sub-national policy makers have huge power over mobility-relevant policies, including housing, education, training, transportation, and commercial construction. Getting these policies right holds the potential to make poverty dramatically lower in the next generation.
Mobility, then, is now a metro issue. The American Dream will live—or die—in America’s cities.
Modeling mobility in cities: From SGM to MGM
So: what now? Three major tasks lie ahead. First, to improve our understanding of the place-related factors impacting mobility, and, critically, the differences between places in terms of their impact. Second, to develop sub-national indicators and frameworks to assess progress and likely progress for social mobility. Third, to strengthen policy-making at the sub-national level.
In what follows, we sketch out how a micro-simulation model using data from a national survey to model individual outcomes—the Social Genome Model—can serve as the basis for the data analysis, indicator frameworks and policy-making in cities and states.
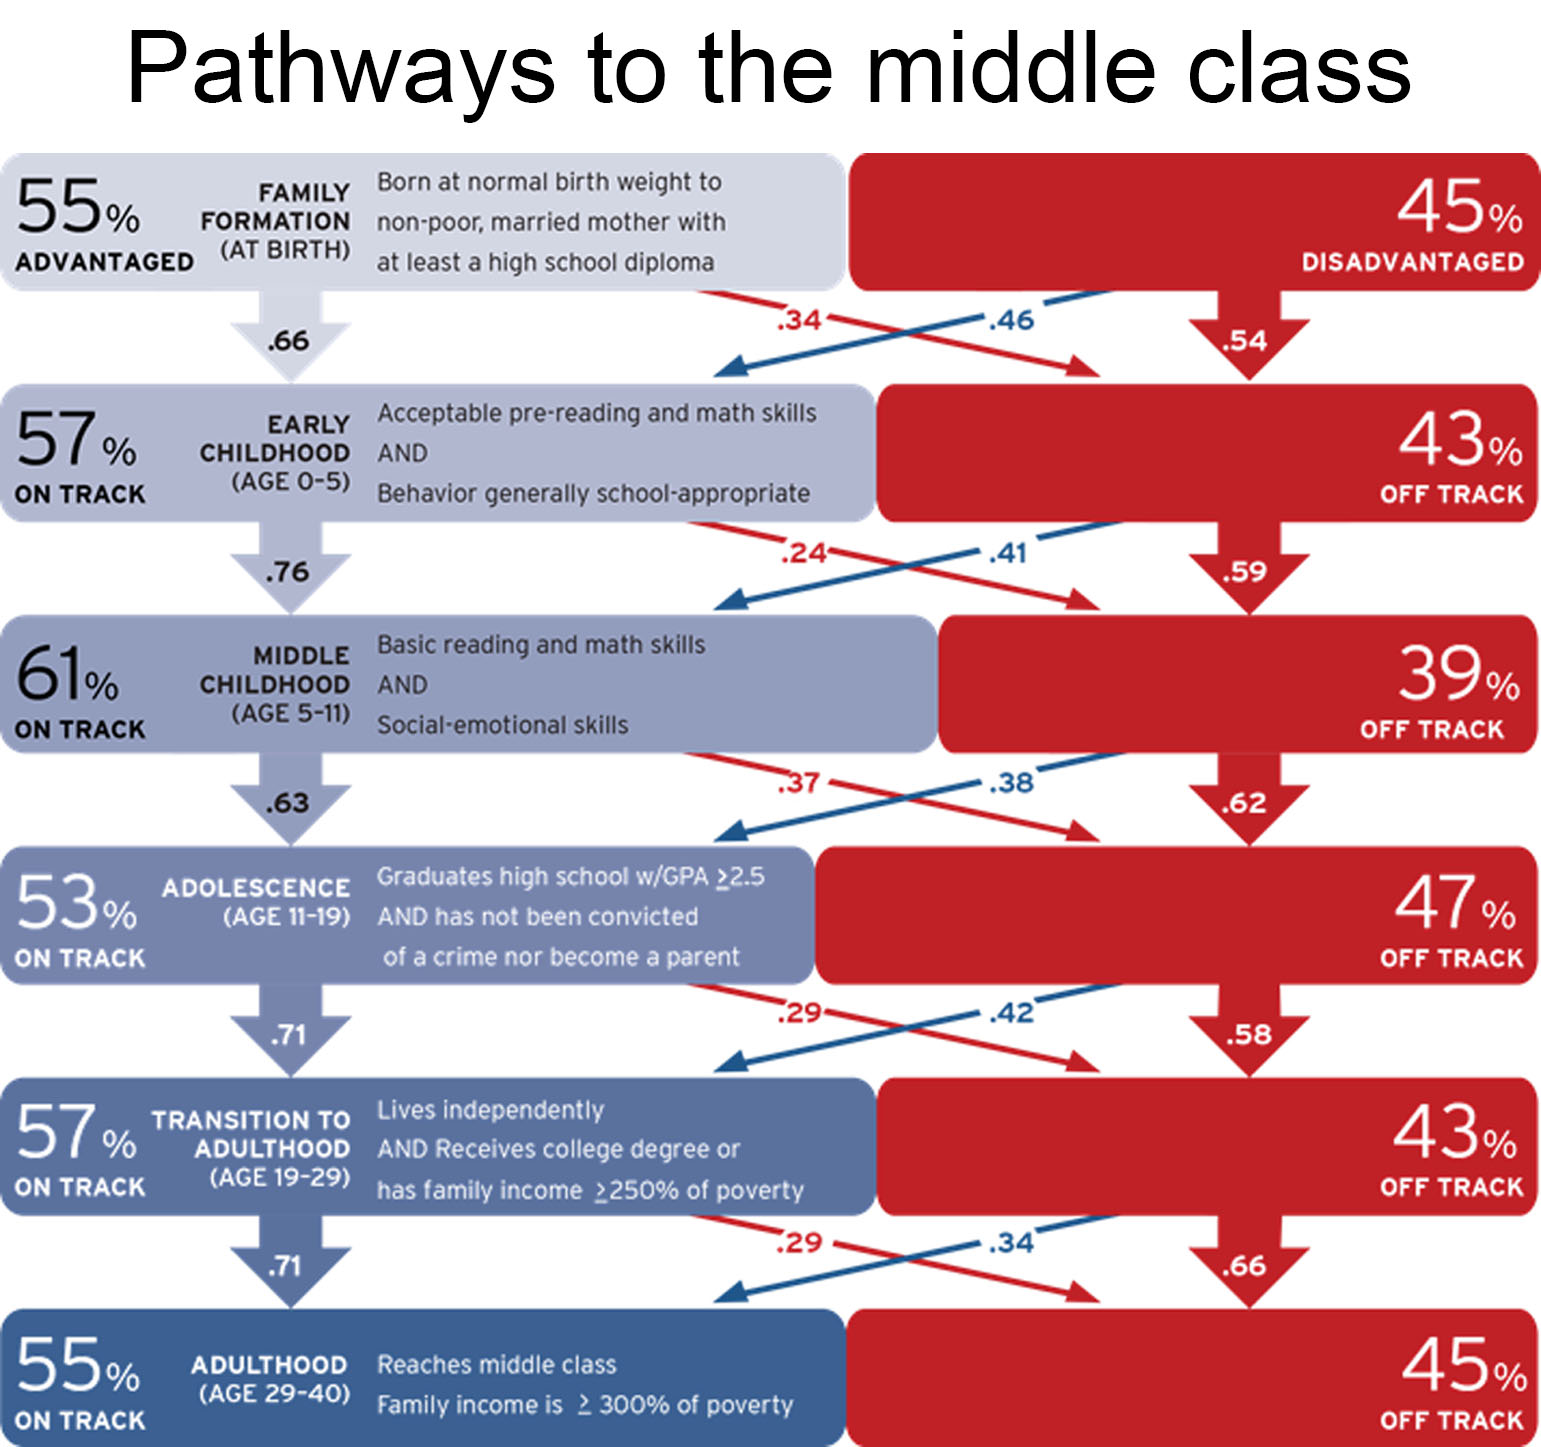
The Social Genome Model (SGM), developed by our Brookings colleague Isabel Sawhill and collaborators, provides a rich description of benchmarks at key life-stages that strongly predict the probability of reaching the middle-class (defined as having a family income at least three times the federal poverty level) by middle-age (40 years old).
Clearing each SGM life-stage ‘hurdle’ strongly predict success at a subsequent life stage
, and the achievement of the long-range goal of reaching the middle class. As the figure below shows, 55 percent of children get a ‘good start’ at the Family Formation stage, defined as being born at a healthy weight to a non-poor mother with at least a high school diploma. At the next stage, early childhood, 57 percent clear the hurdle. The figure also shows the odds of clearing one life stage conditional on clearing the previous one. Of those clearing the early childhood hurdle, 76 percent go on to succeed in middle childhood, compared to 41 percent of those who do not:
The raw material from which the SGM is built is data from the National Longitudinal Survey (NLS). The NLS sample is too small to permit analysis of populations of individual metropolitan areas. But most of the core concepts of the model can be replicated using other datasets. Taking metro-level variables that track as closely as possible to the SGM benchmarks, we can put together a database that draws on the SGM but generates sub-national data: in effect, a Metro Genome Model (MGM).
Modeling metro mobility: The theory
The task is not simply to impose SGM benchmarks on cities, however; it is to incorporate the SGM approach into a place-sensitive model that can be used to explain and/or predict upward mobility—including, but not restricted to, the goal of reaching the middle class by middle age. The figure below describes the simple model we have in mind:
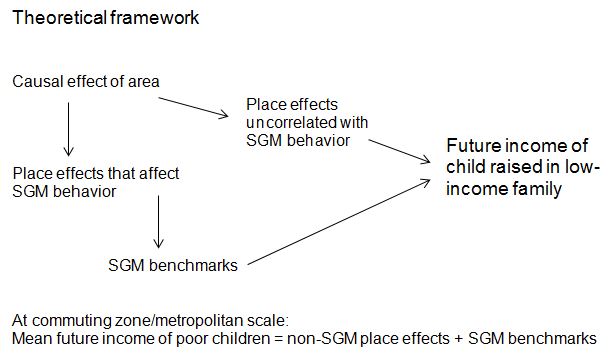
There are series of interconnected mobility pathways here:
- An individual clearing SGM hurdles or similar benchmarks is more likely to be upwardly mobile, regardless of where they live.
- Local factors will influence the odds of an individual clearing SGM or similar hurdles. Conditions at birth, high school completion and avoiding arrest and pregnancy, for example, are influenced by local economic, cultural, and environmental conditions.
- Places will also influence individual outcomes through mechanisms that are not captured by the SGM framework, which is not intended to be comprehensive. Examples include maternal and child health, parenting quality, or non-BA post-secondary qualifications.
- Finally, there will certainly be factors impacting on upward mobility that are not captured by the SGM or directly affected by places.
Modeling metro mobility: The data
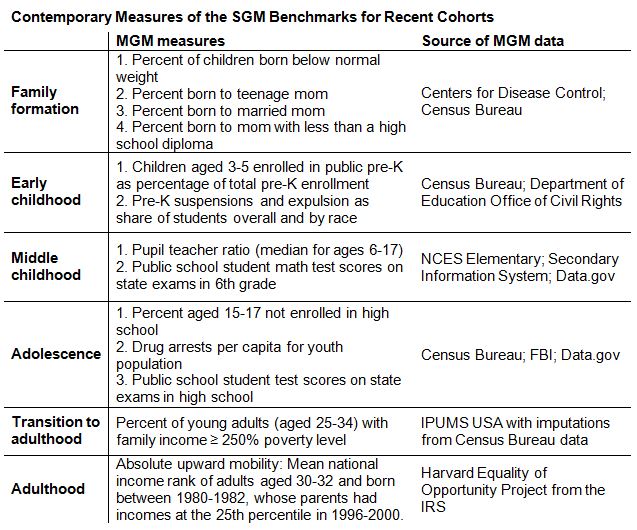
It is possible to find good-quality data at a metropolitan scale that matches fairly closely to the SGM benchmarks. The table below shows the SGM benchmarks, the proposed MGM parallel benchmark, as well as data sources:
One of the difficulties with studying intergenerational mobility is that it takes a generation for the data come in. So even if robust predictors of subsequent mobility can be discovered, it is possible that they will have ceased to so powerful by the time of the discovery. A high school diploma, for instance, may have been an important distinguishing feature of upwardly mobile people in the 1970s and 1980s. But it will surely less so today, given the overall rise in graduation rates.
We want to both look backwards, to see which MGM indicators are linked to later mobility patterns, and to look forwards, using updated SGM-inspired benchmarks for likely future success.
For the first goal, we proceed by linking MGM data for the cohort born around 1980 at each life stage, in order to link to the mobility data made available by Chetty and his team.
At the family formation stage, the MGM is very closely aligned both for recent years and historically. County-level data on birth weight—and maternal characteristics—are available from the Centers for Disease Control for large counties (population of 100,000 or more) and all counties from 1968-1988. For 2013, these data are available for at least one county in 237 metropolitan areas (technically commuting zones, of which there are 741). At the county level, CDC birth records are released for only 16 percent of U.S. counties, but those counties are home to 75 percent of total 2010 U.S. population. For more comprehensive coverage of maternal birth characteristics, we use the Census Bureau’s American Community Survey, which covers five percent of the U.S. population and allows us to measure the share of children born to mothers who are married and the share who have completed high school.
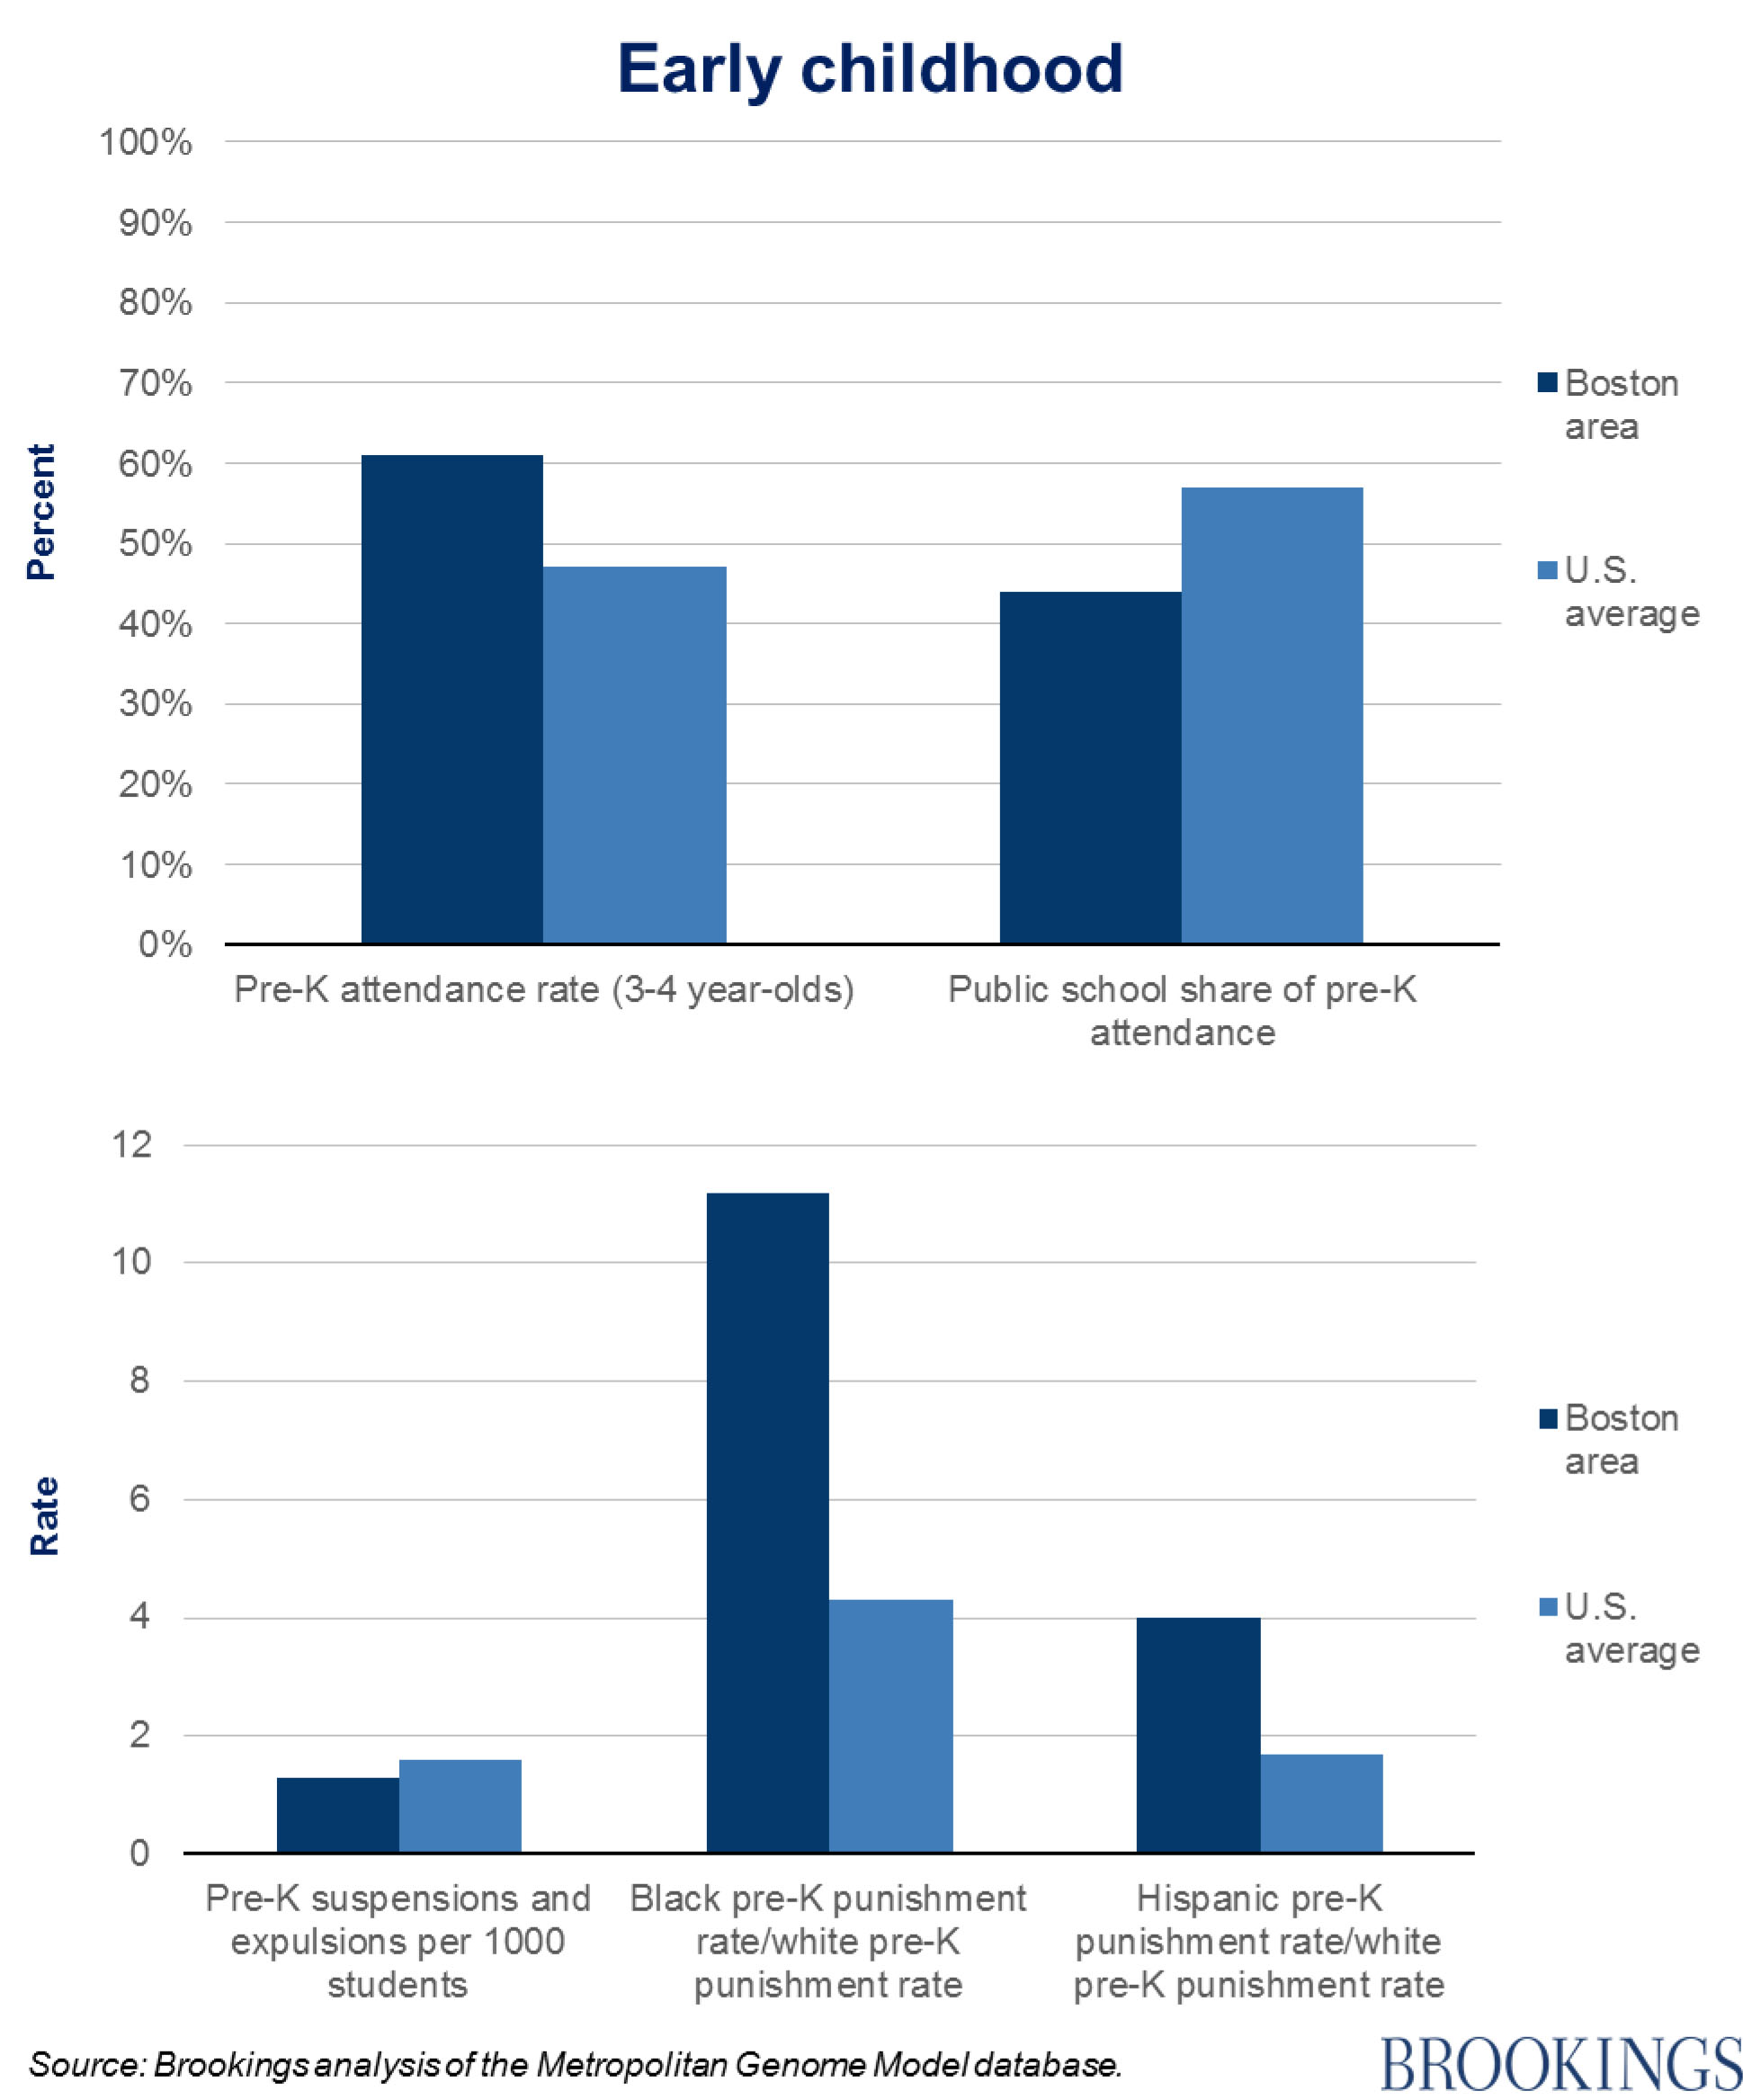
Data availability is weakest for the early childhood stage (ages 0 to 5). Test score data are only available starting in third grade, and there is no comprehensive database of behavioral problems. The closest approximation is the Office of Civil Rights database, which tracks expulsions and suspensions of pre-kindergarten students for specific public schools. We compiled these data and also included a measure of exposure to formal pre-kindergarten education, which is particularly relevant for children from low-income families, for which strong evidence suggests large benefits. For that reason, we used the public share of enrollment in pre-K enrollment to capture local policies to subsidize early childhood education for the group that needs it most. This was available for 1980 and recent years.
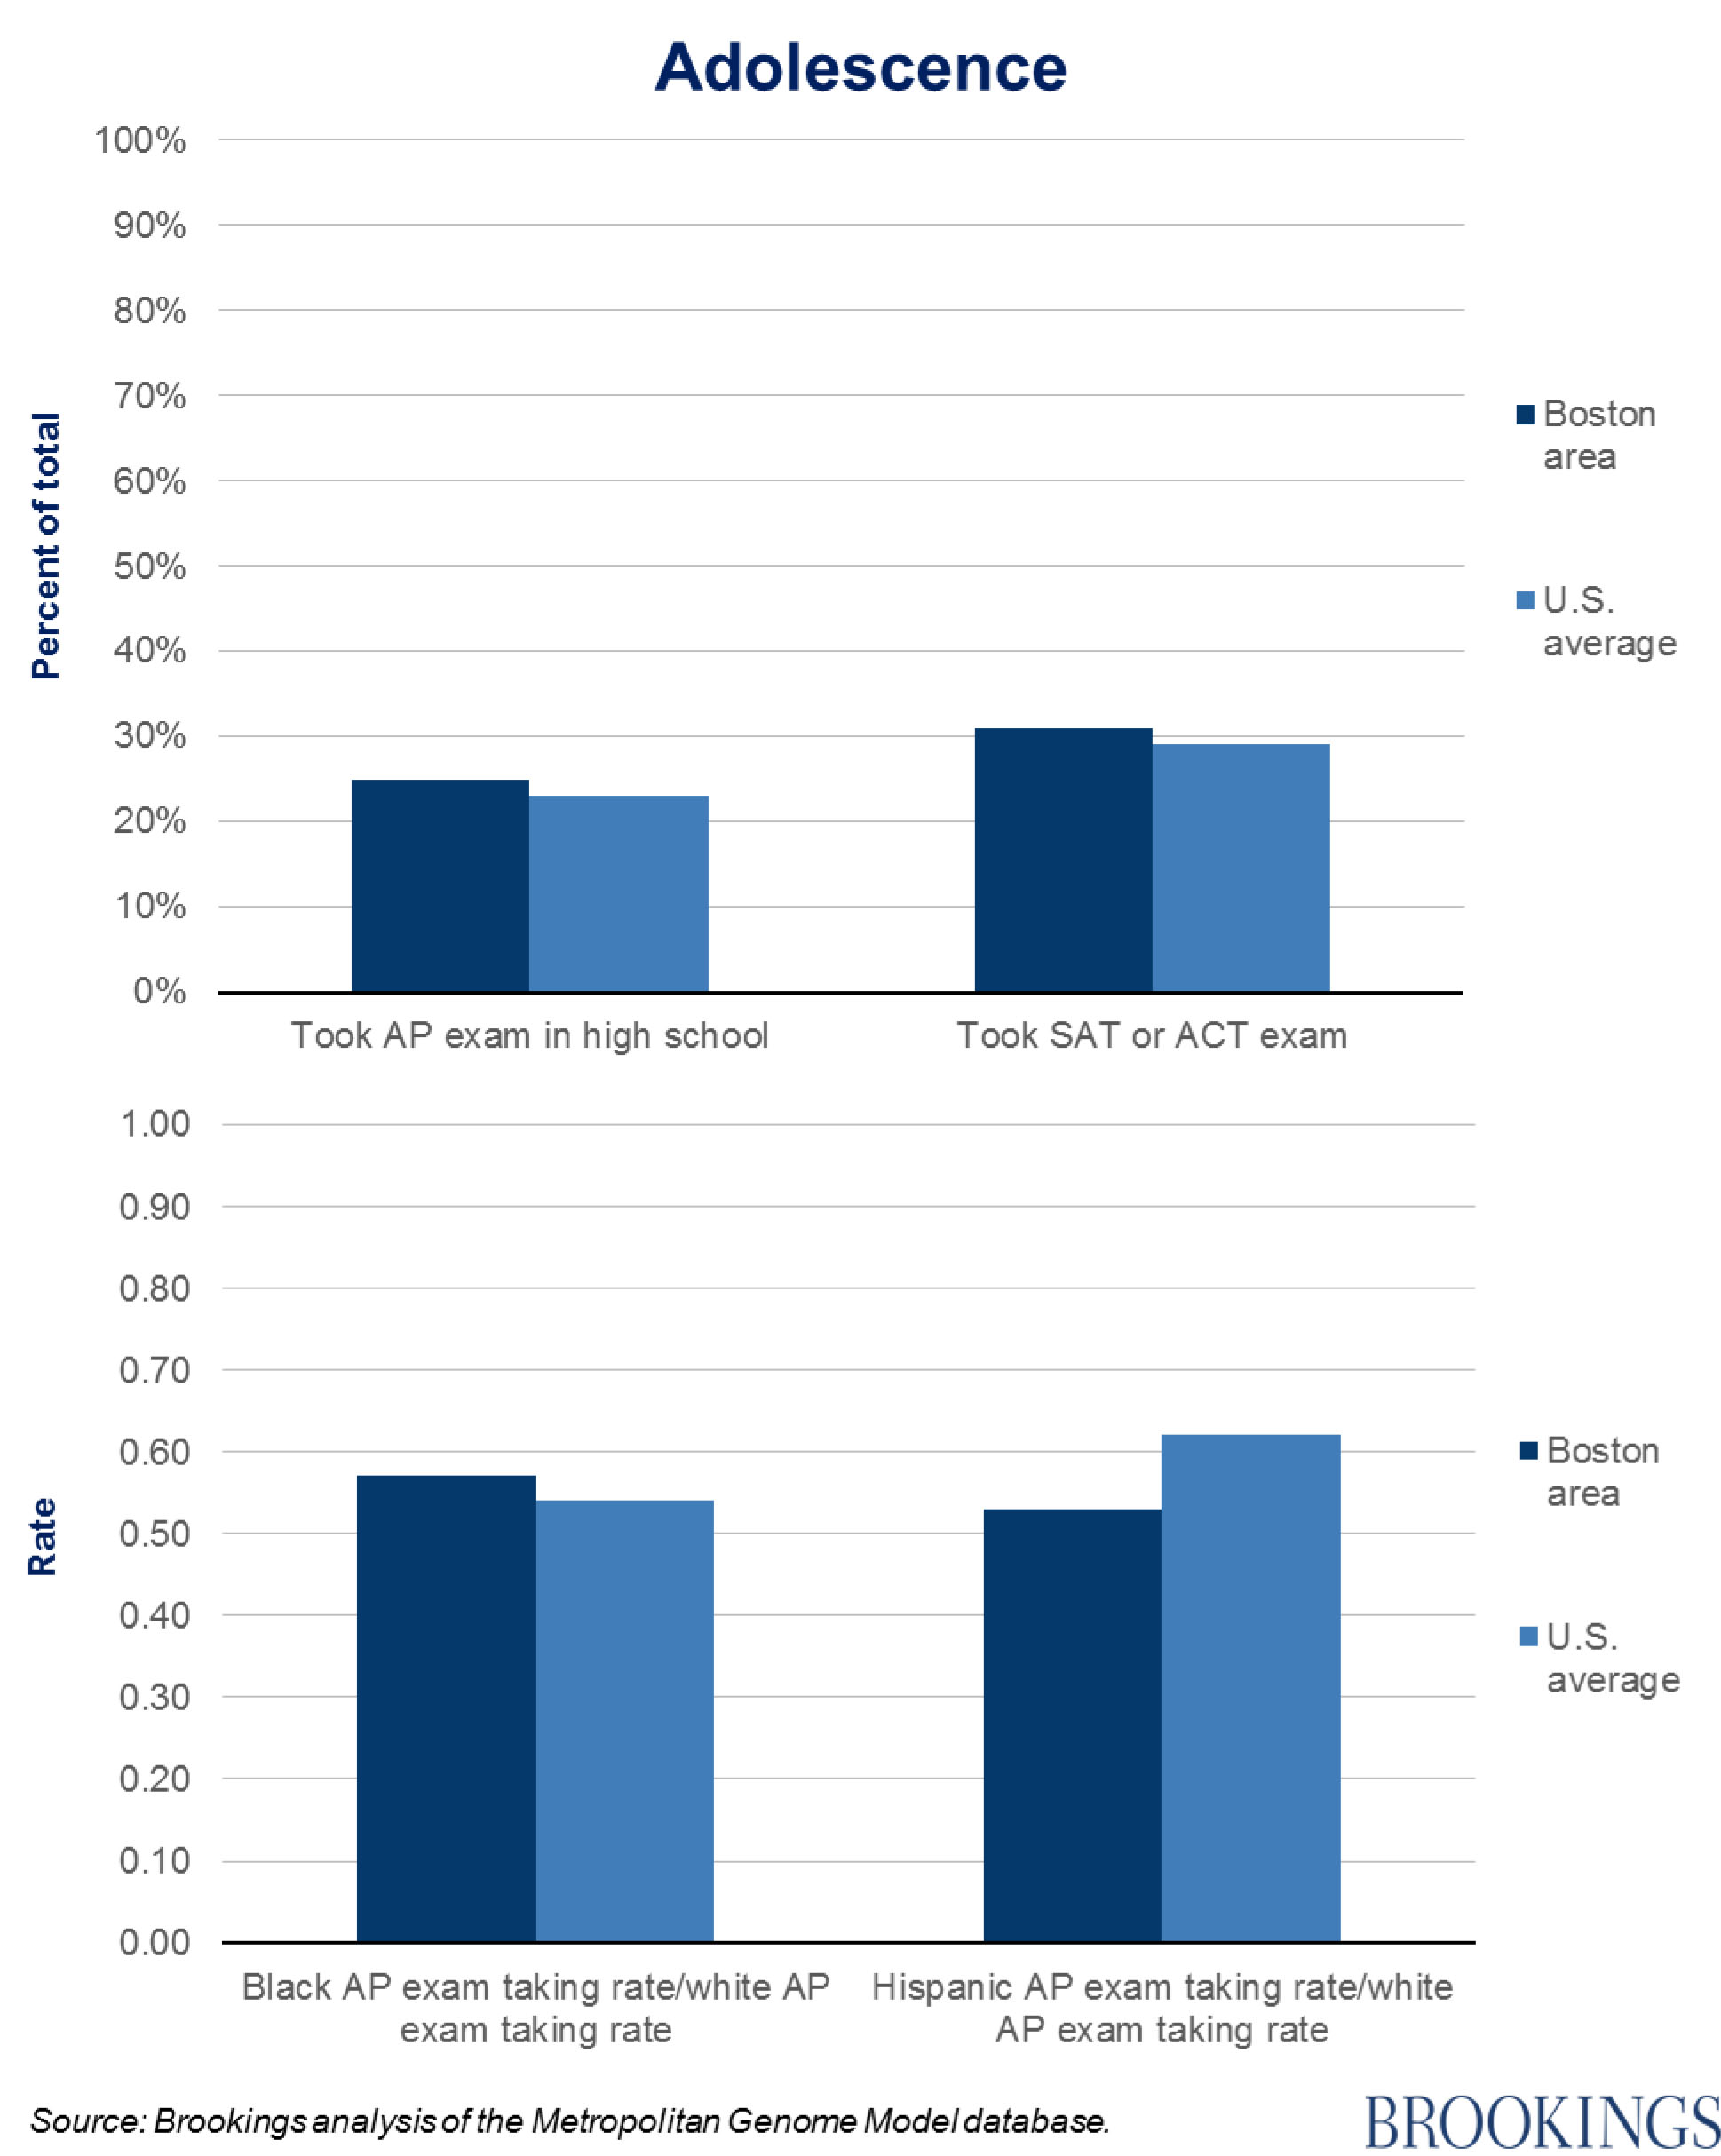
For middle and adolescent childhood stages, there is reasonable data availability for contemporary measures. The Department of Education compiles test score data for nearly every public elementary and secondary school, allowing for calculations of proficiency rates overall and by race. The chief problem is that every state administers its own exams, limiting comparability. We can also calculate arrest rates for crime, using FBI data, and high school completion rates from the Census Bureau.
Unfortunately, test score data during the 1980s and early 1990s is not available across a large number of places, so in our retrospective analysis, we are forced to rely upon pupil-teacher ratios as a frankly poor substitute: there is some broad empirical evidence suggesting that pupil-teacher ratios may affect test scores, but there is only a very weak correlation between the two using contemporary data (-.21).
Metro mobility and MGM benchmarks
Do the ‘backward-looking’ MGM measures bear upon upward mobility, as measured by Chetty et al.? To address this question, we regressed a measure of upward mobility for people born from 1980-1982 on each of the core MGM measures for all commuting zones. The upward mobility outcome is mean adult incomes (measured by national income rank on a 1-100 scale) for those whose family incomes growing up were at the 25th percentile of the national income distribution.
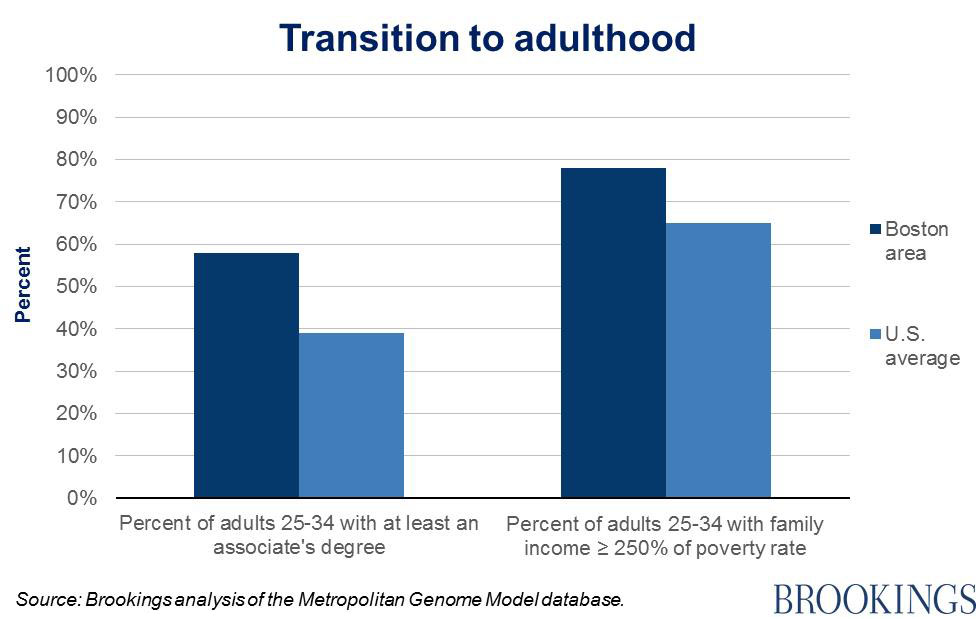
Nine MGM variables for the 1980-1982 birth cohort exhibit highly significant and robust correlations with upward mobility in the expected direction: share born below normal weight, share born to unmarried mothers, share born to mothers with less than a high school diploma, share born to teen mothers, the share of pre-kindergarten students enrolled in public schooling, the pupil-teacher ratio during middle school, the rate of drug arrests for teens, the high school enrollment rate for 15-17 year olds, and a measure of early adulthood self-sufficiency, defined as having at least some college education and an income above 200 percent of the federal poverty line. These relationships hold controlling for the racial and foreign-born composition of the population, and echo the general results of both SGM analyses and correlations calculated by the Chetty team.
To illustrate these relationships, the figures below show scatter plots for four of these nine measures with respect to upward mobility in commuting zones with at least 100,000 residents in 2010.
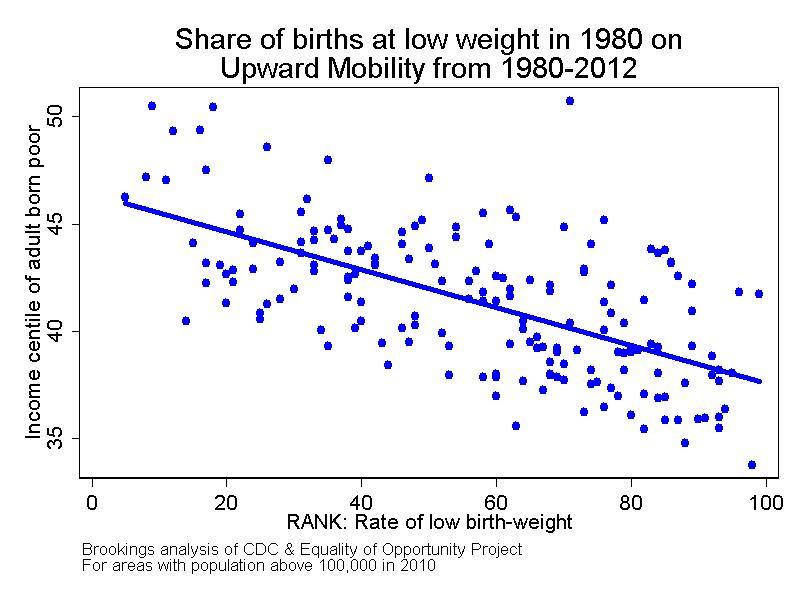
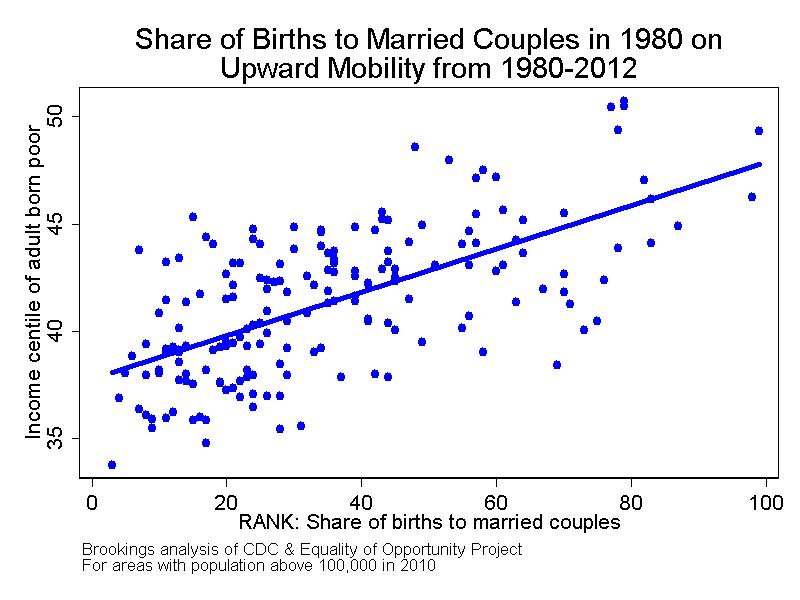
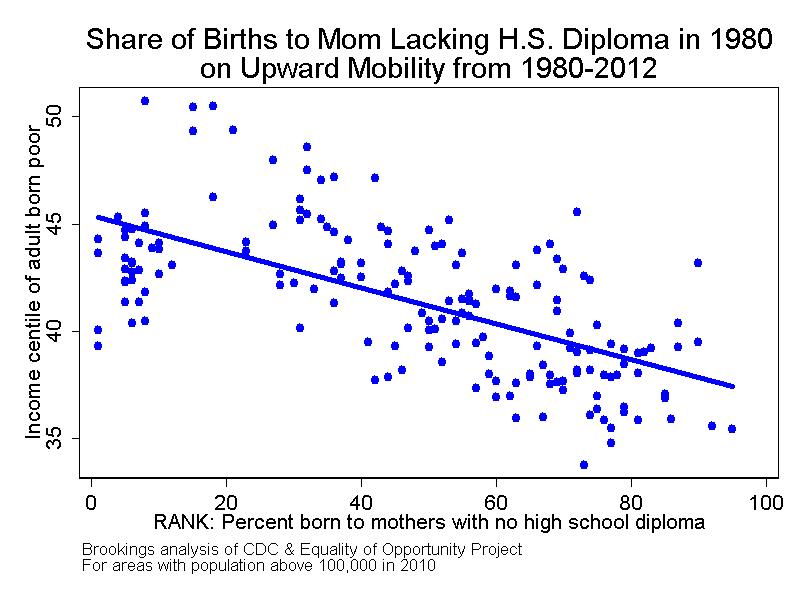
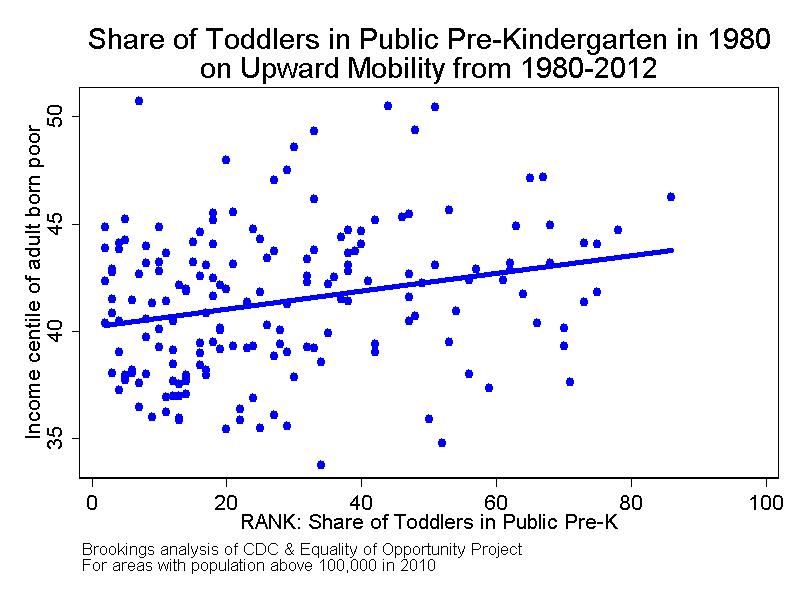
Of course, along with other researchers in the field, we emphasize that no causal conclusions can be drawn. The correlations, however, are suggestive.
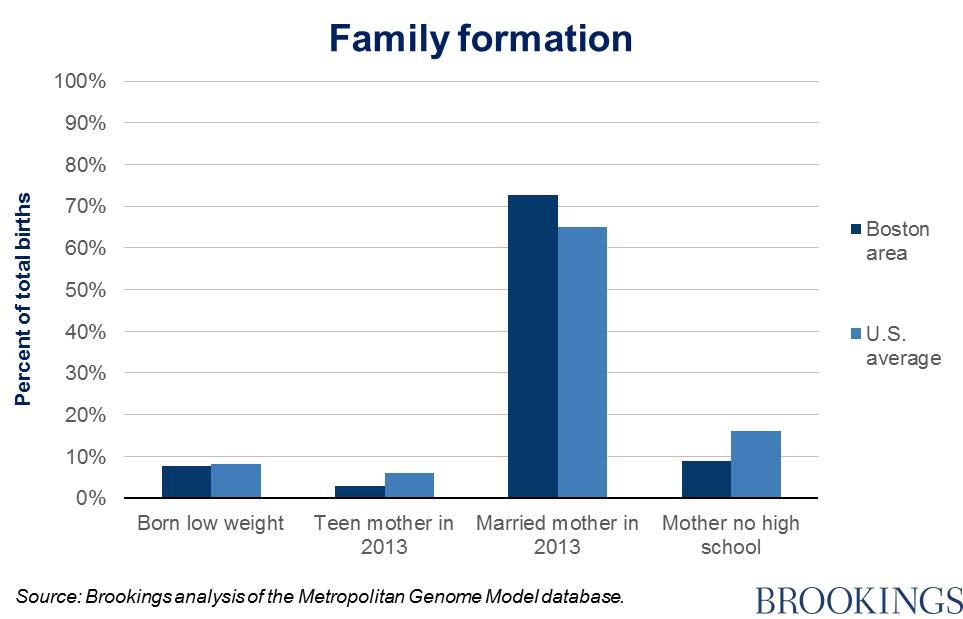
Metro mobility: Boston
Given that mobility is a metro issue, it will be important to look at patterns in different cities, and the similarities and differences between them. For illustration, we show in the figures how the Boston area (commuting zone, or CZ) compares against national data, at each life stage of the MGM. As expected, Boston scores quite highly on many of these—it was the 7th highest CZ in the Chetty rankings—but there are also areas of concern, especially in terms of race gaps:
Why Boston?
Boston was not an idly-chosen example. A convening of the U.S. Conference of Mayors is taking place there this week, focused specifically on the issue of promoting economic mobility. Mayor Setti Warren of Newton, Massachusetts, who led the meeting, has already adopted the SGM benchmarks to measure progress in his own town. The 15-year-old Boston Indicators Project, supported by The Boston Foundation, is now tightly focused on social mobility. Colorado has already launched an Opportunity Project, based on indicators at key life stages, and drawing on the social genome approach. Other cities, from New York to Charlotte to Chicago, are developing increasingly powerful life-stage based frameworks to guide policy and promote mobility.
What’s next?
Brookings will be digging deeper into the issues of place, race and opportunity in coming months and years. The next steps in the specific Metro Genome Model will be to further test the predictive potential of the selected metrics, and to make these metrics available for every area in the United States.
There are of course hundreds of frameworks and thousands of indicators already out there. We hope to provide a more precise focus on intergenerational mobility as the long-range goal towards which the shorter-range metrics should point. Clarity of the objective, the best-possible data, and a ruthless commitment to evidence-based policy: that is the combination required to move the needle towards greater mobility. And it is in our cities and states where most of the work needs to be done. The MGM is another step towards the creation of sub-national ‘opportunity dashboards’ helping policy-makers to focus resources in the most effective way. But it will take political imagination, too: not least in order to see how the American Dream now lives—or dies—in America’s cities.


Commentary
The American Dream in American cities: Exploring a ‘Metro Genome Model’ approach
October 9, 2015