Part 1 in a three-part series on inequalities in early childhood development.
Policy-makers have developed an obsession: early childhood. Obama is struggling to make pre-K education accessible to all. Governors around the country—Democrat and Republican alike—are investing in the 3- and 4-year-olds in their state. Despite some disappointing evaluations of the Head Start program, significant political and financial capital is being invested in preschool.
Why? Because of the mountain of evidence that gaps in ability open up long before kindergarten. That’s true for cognitive skills, like math and reading, and for non-cognitive skills, like application and self-control.
The link between income and the acquisition of cognitive skills—for which the best data exists—is strong, consistent, and clear. The graph below shows what percentage of children by family income are top performers on cognitive ability tests before starting school, when starting high school, and during adolescence. The three tests are the Peabody Picture Vocabulary Test (PPVT), the Peabody Individual Achievement Test (PIAT), and the Armed Forces Qualification Test (AFQT).
As you might expect, children from affluent homes—measured by income quintile (equal fifths of the distribution)—are much more likely to be scoring in the top third of the ability range.
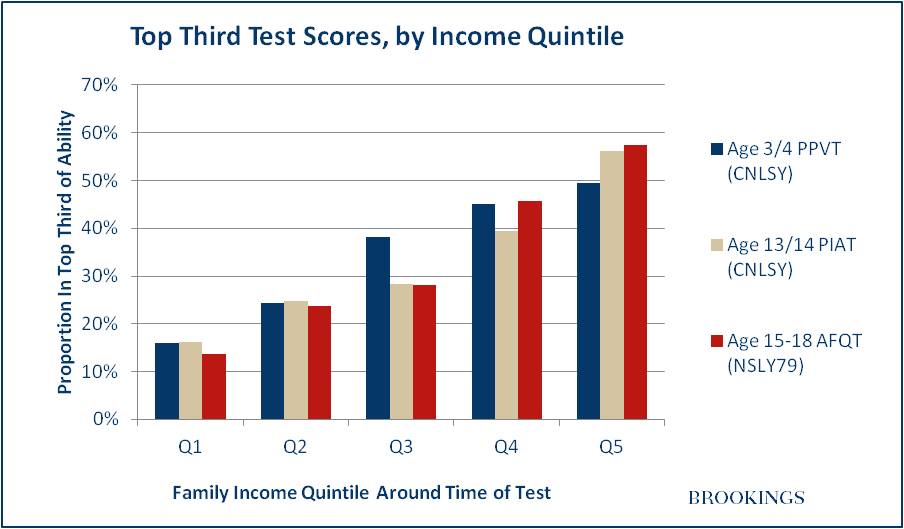
Two points:
- The gaps by income are big. Half of the children from the most affluent homes are in the top third of test scores, compared to just one in seven of those from the poorest families.
- More surprisingly, perhaps, there is essentially no change in the relationship between income and test scores at the different ages. The shape of the bar chart is in fact spookily similar for the three tests. (The adolescent scores are from a different survey to the early two scores: but if anything, this makes the similarity of the distributions even more startling.)
Children from more affluent backgrounds are the A-grade students before school even starts, and then simply maintain their position through the school years. Addressing the divide as early as possible looks necessary, and urgent.
Tomorrow, in Part 2, I’ll have a look at the distribution of the lowest test score results by income background. (Spoiler alert: try holding a mirror up against the graph above.)


Commentary
Early Childhood Achievement Gaps and Social Mobility (Part 1)
September 24, 2013