The Obama administration’s Clean Power Plan is an effort to reduce carbon emissions from power plants 32 percent below 2005 levels by 2030. Power plants are the largest source of greenhouse gases in the U.S., accounting for nearly one-third of all emissions. Meeting the carbon reduction targets will be left to the states, but Brookings Fellow Adie Tomer, Senior Fellow Robert Puentes, and Senior Research Assistant Joseph Kane argue that “metro areas should also be a big part of [the Clean Power Plan] discussion.”
Local electricity generation can vary substantially across different metro areas
Metro areas are home to more than 2,600 of the country’s 7,000-plus power plants. In a new Brookings interactive, Tomer, Puentes, and Kane break down the types of energy sources used for electricity generation within the top 100 metropolitan areas to show how dissimilar they can be throughout the country, and even at a local level. While many metro areas depend on power plants far outside their borders, these disparities in local energy production present policymakers with very different challenges and opportunities when considering investments in alternative sources of energy.
North Carolina is a clear example of how the power sources for electricity generation differ in individual markets across the same state. For instance, 97 percent of the electricity-generation capacity in Winston-Salem, NC comes from high emission coal plants, while only 100 miles east, Raleigh, NC generates nearly 99 percent of its electricity using low-emission nuclear energy. Raleigh is unique, however, particularly on the East Coast where electricity generation in many markets results in higher emissions due to the use of more coal and petroleum, as you can see in the following screenshot from the interactive.
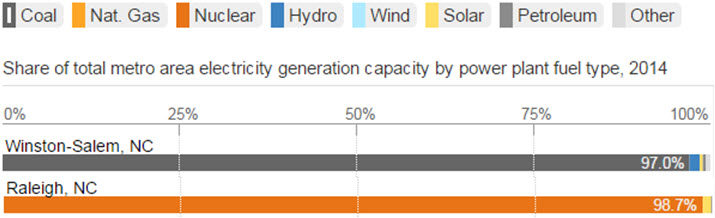
Source: Brookings analysis of U.S. Energy Information Administration (EIA) data. Note that total electricity generation capacity (in megawatts) is typically measured by the EIA in terms of net summer capacity. Since many power plants do not always operate at full capacity, however, the total capacity shown for each metro area may not necessarily correlate with the actual amount of electricity generated or fuel consumed.
On the other hand, several metro areas in the western United States tend to generate electricity using much cleaner forms of energy, as evident across California. For example, 99.7 percent of the electricity generation capacity within Oxnard-Thousand Oaks-Ventura comes from natural gas. Meanwhile, less than 110 miles away in Bakersfield, 54 percent of local generation capacity comes from natural gas and 38 percent from wind power. Finally, nearly 70 percent of Fresno’s local capacity is linked to hydro energy production, and none from wind power.
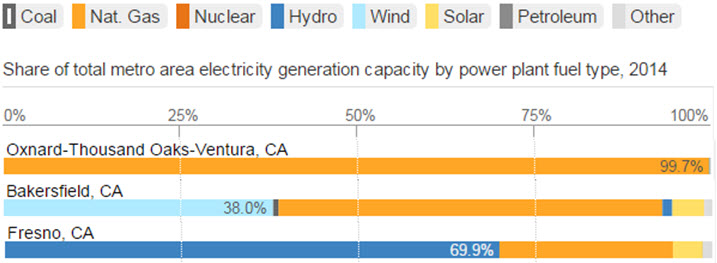
Source: Brookings analysis of U.S. Energy Information Administration (EIA) data.
In this way, the type of power plants present within individual metro areas can often influence the challenges and opportunities at a local level. Yet altering the supply of energy in these areas is not the only way to meet the Clean Power Plan’s emission reduction targets.
All metro areas can reduce energy demand to curb emissions
As the Clean Power Plan takes effect, metro areas with high carbon emissions can also drive innovations and investments in their existing energy infrastructure to reduce demand.
Brookings Fellow Adie Tomer points out in a recent blog post that metros can flexibly meet their carbon reduction targets through more efficient consumption. Metro areas can craft policies that encourage greater housing density in order to cut down on transportation emissions, and they can update building codes to increase efficiency. Reducing demand helps ease the challenge of changing the supply of electricity generation to lower emissions options in order to meet Clean Power Plan objectives.
For more information on these impacts at a local scale, view the interactive that shows the electricity generation breakdown for all top 100 metro areas.
Joseph Kane contributed to this post.
Commentary
How will the Obama administration’s Clean Power Plan affect Metro areas?
September 25, 2015