Global value chains (GVCs) have complicated both the reality and the analysis of international trade. On the one hand, they break up the production process so that different steps can be carried out in different countries, and in so doing have transformed the nature of trade. On the other, they’re complex, which makes it harder to understand trade and to formulate policies that allow workers, firms, and governments to capitalize on GVCs while mitigating negative side-effects.
To add to the challenge, today’s official statistical information systems were designed to measure economic activity in a pre-GVC world, and they have struggled to keep pace (with some notable exceptions). Conventional measures of trade—while still important—measure the gross value of transactions between partners. As such, they don’t reveal how foreign producers, upstream in the value chain, are connected to final consumers at the end of the value chain. For example, conventional statistics suggest that South Korea exports a lot to China. In fact, much of this is components that are ultimately destined for the European or U.S. market. So more accurately, South Korea exports a lot to advanced consumer markets.
The GVC phenomenon has prompted researchers to develop statistics and analysis based on the value added in trade. The phenomenon also demands that researchers analyze how the production process is divided into discrete tasks or phases. Thankfully, data on the value added traded among major economies is now available (for 1995-2014). The World Bank, World Trade Organization (WTO), and a group of research centers around the world have published a first “Global Value Chain Development Report” based on research using data on the value added in trade. The report highlights some new findings on the changing nature of international trade.
Many countries contribute along the “smile curve”
One important finding is that many value chains take the form of a “smile curve”; for example, the production chain for China’s exports of electrical and optical equipment in 2009 (see figure).

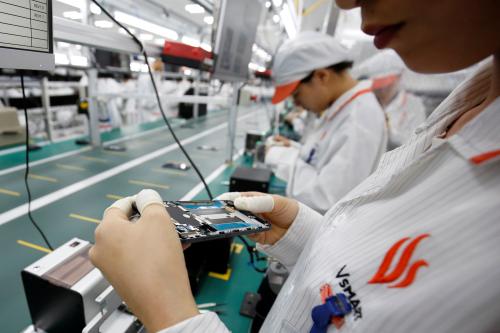
These are basically all of your electronic gadgets. The circles (in which the letter corresponds to a country and the number to a particular industry) indicate country-industries that contribute to production, and their size represents the absolute value-added gained by participating in the value chain (in millions of U.S. dollars, at constant prices). On the vertical axis is compensation per hour for the workers in the country-industry, indicating high- versus low value-added activities. On the horizontal axis is distance to the final consumer.
Here’s the logic of the smile shape: Early in the production process, there are research and design activities for critical components; these knowledge activities tend to be high value-added and in GVCs tend to be carried out in more advanced economies. The Chinese industry that manufactures the good called “Chinese-Electrical and Optical (CHN14),” is located at the bottom of the curve, meaning it’s assembly activity with low wages. Just upstream from China’s activity are contributions from the same manufacturing industry in the United States, Germany, Japan, Taiwan, and Korea. These are the more sophisticated parts that are then assembled in China. The activities closest to the consumer are marketing, logistics, and after-product servicing. These market-knowledge industries are also high-value-added (hence the upward-sloping part of the smile), and also tend to be carried out in advanced economies where the mass consumption products are eventually bought.
Interestingly, the figure captures anxieties felt by both rich and poor countries in thinking about trade today. People in rich countries worry that manufacturing is being hollowed out. That is, that semi-skilled production jobs have moved to the developing world, and—to the extent that such jobs still remain in advanced economies—have faced downward pressure on wages. Poor countries worry that they are trapped in low-value-added activities and are locked out of the higher value-added found in design, key technological inputs, and marketing.
Who wins and who loses?
The same changes in technology and global trade can be seen in overall statistics on factor use and income distribution in industries affected by GVCs in developed and developing countries. In the U.S. information communication technology manufacturing sector, for example, labor productivity grew an impressive 200 percent over the 15 years covered by the study. At the same time, there was a large shift in the kind of labor used: The share of high-skilled labor (with college education and above) increased sharply from about one-third to one-half (see figure).

And proportionally more of the compensation went to high-skilled workers (right panel). For low-skilled workers, it was flat, and for the medium-skilled it increased but in a smaller amount. These shifts match the overall transformation of the industry: from initially producing in the United States to primarily designing and providing supporting services, while still producing some high-tech inputs.
What about changes in China’s information communication technology industry?

The first thing to note is that labor productivity grew at a phenomenal rate: about 6-fold over just 15 years. During the period, labor’s share of value added in the industry dropped from over 40 percent to about 30 percent, while capital’s share increased from less than 60 percent to nearly 70 percent. Clearly, capital was able to reap much of the benefit of the productivity gain (as did consumers worldwide through lower prices). It should be emphasized that the real gains were won by capital deployed in China, including multinationals that play a critical role in managing GVCs.
There have been big wage increases in China as well, starting from a very low base. Most workers in China’s information communication technology industry were low- and middle- skilled, though this decreased over the period (from more than 95 percent of hours to about 90 percent). Very few workers are high-skilled, and the hours they work still amounted to less than 10 percent of total hours by the end of the period. As for workers’ pay (right panel), real wages for all workers increased, although the big proportional gain went to skilled labor (which nearly doubled). Compensation of medium-skilled workers, with high school degrees, also went up over the period, by about 80 percent. Even low-skilled workers in this industry saw their compensation increase more than 50 percent during the period.
Spreading the benefits
These findings—which illuminate how gains and losses in trade are distributed—shed some light on the growing protectionist sentiment in the United States and other advanced economies. They also help explain why globalization remains popular in developing countries that are deeply involved in GVCs, such as China, Mexico, and Vietnam.
The benefits from GVC-related trade have been distributed highly unevenly. On the U.S. side, the big winners appear to be high-skilled workers and multinational corporations. GVCs have enabled them to benefit from enormous productivity gains in developing countries such as China. Ordinary American workers have not seen much, if any, benefit. In China, ordinary workers have benefited. Even at the beginning of the process, factory wages in China were far ahead of rural incomes; and those wages rose significantly over 15 years. This is one of the driving factors behind the impressive decline of absolute poverty in China. However, relatively speaking, the really big benefits in China accrued to the small number of high-skilled workers and to the owners of capital, including foreign investors.
What does all this mean for policy?
- First, about two-thirds of world trade now is involved in value chains that cross borders during the production process. The United States is deeply involved in supply chains with Asia, as well as with NAFTA partners. It would be difficult and disruptive to undo these supply chains. A policy that sounds straight-forward—such as a 45 percent tariff on imports of “Chinese” products, as then-candidate Donald Trump proposed during his campaign—would hurt many firms and workers in the United States, as well as in allies such as Japan, Korea, and Taiwan.
- Second, we can get more benefits from GVCs by improving our infrastructure and strengthening education at all levels.
- Third, technological change and global trade will inevitably create economic dislocation and we need to do a better job with adjustment assistance and the safety net to help workers and communities deal with the changes.
My next post will focus on how developing countries can benefit more from GVCs.
Related Content


Authors


Commentary
Global value chains shed new light on trade
July 10, 2017