This post discusses my monthly update of the Barnichon-Nekarda model. For an introduction to the basic concepts used in this post, read my introductory post (Full details are available here.)
In September, the unemployment rate increased to 7.3%, 0.2 percentage points higher than the model had anticipated. However, because of the government shutdown in October and the unusual timing of the household survey, I don’t think we should put a lot of weight on the October unemployment report. Therefore, I do not put much weight on this month model’s forecast (Table 1) either and stick instead with last month’s forecast (here), which predicted a steady decline in unemployment going forward.
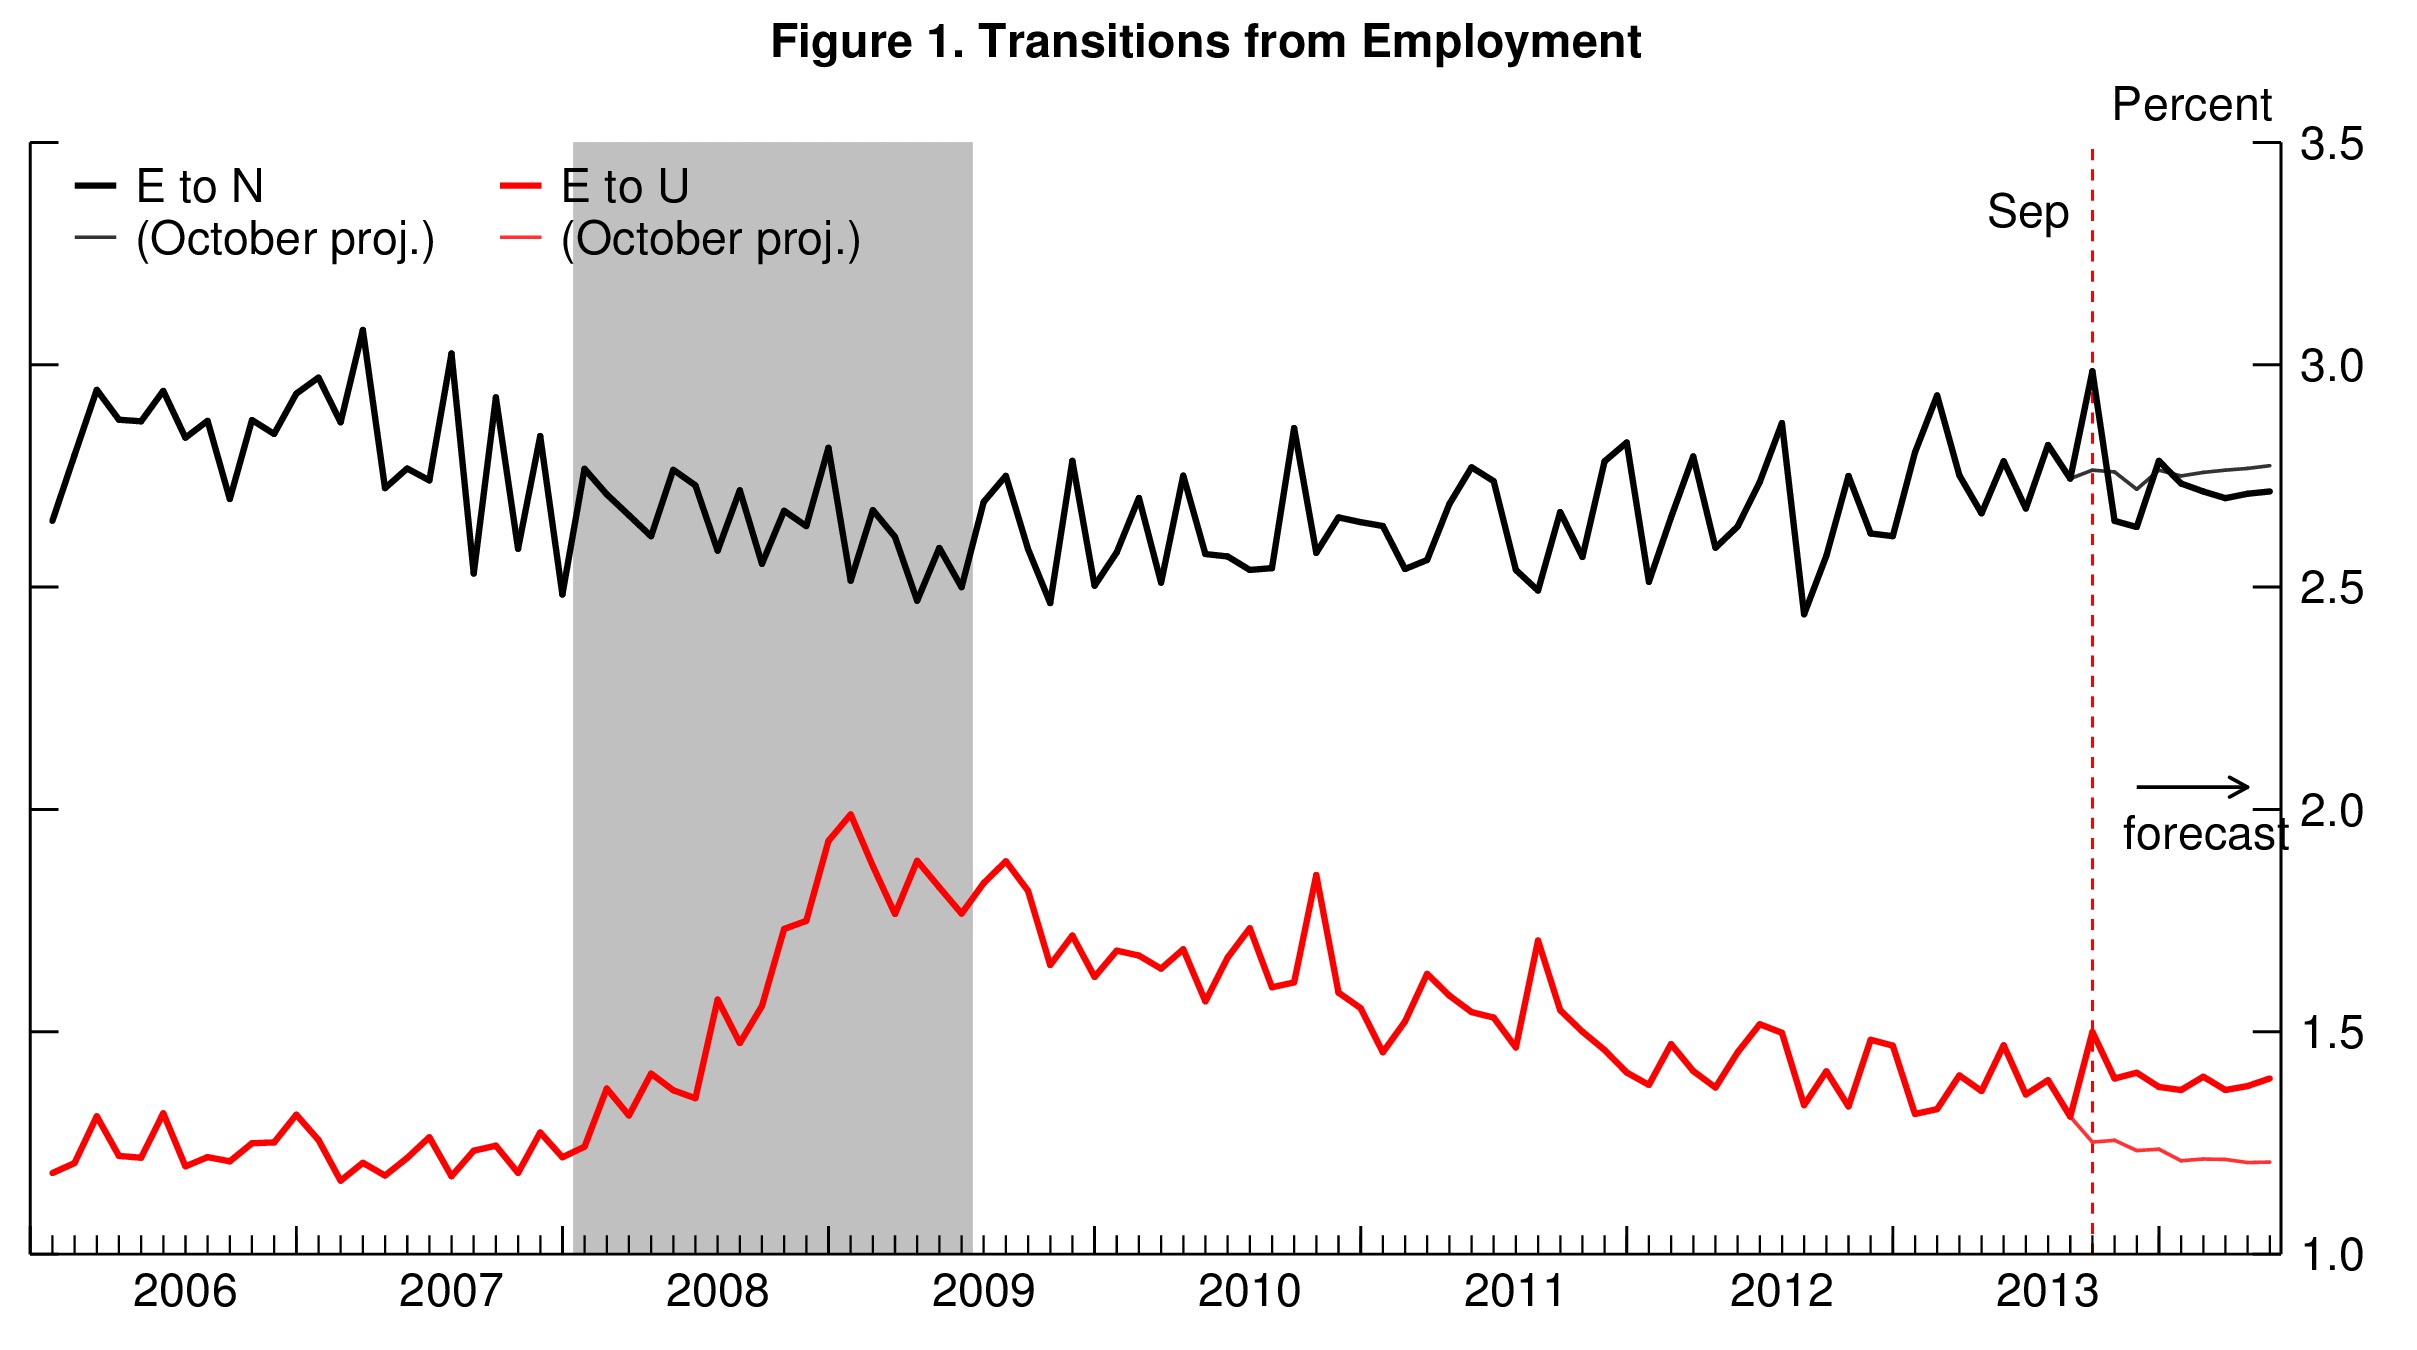
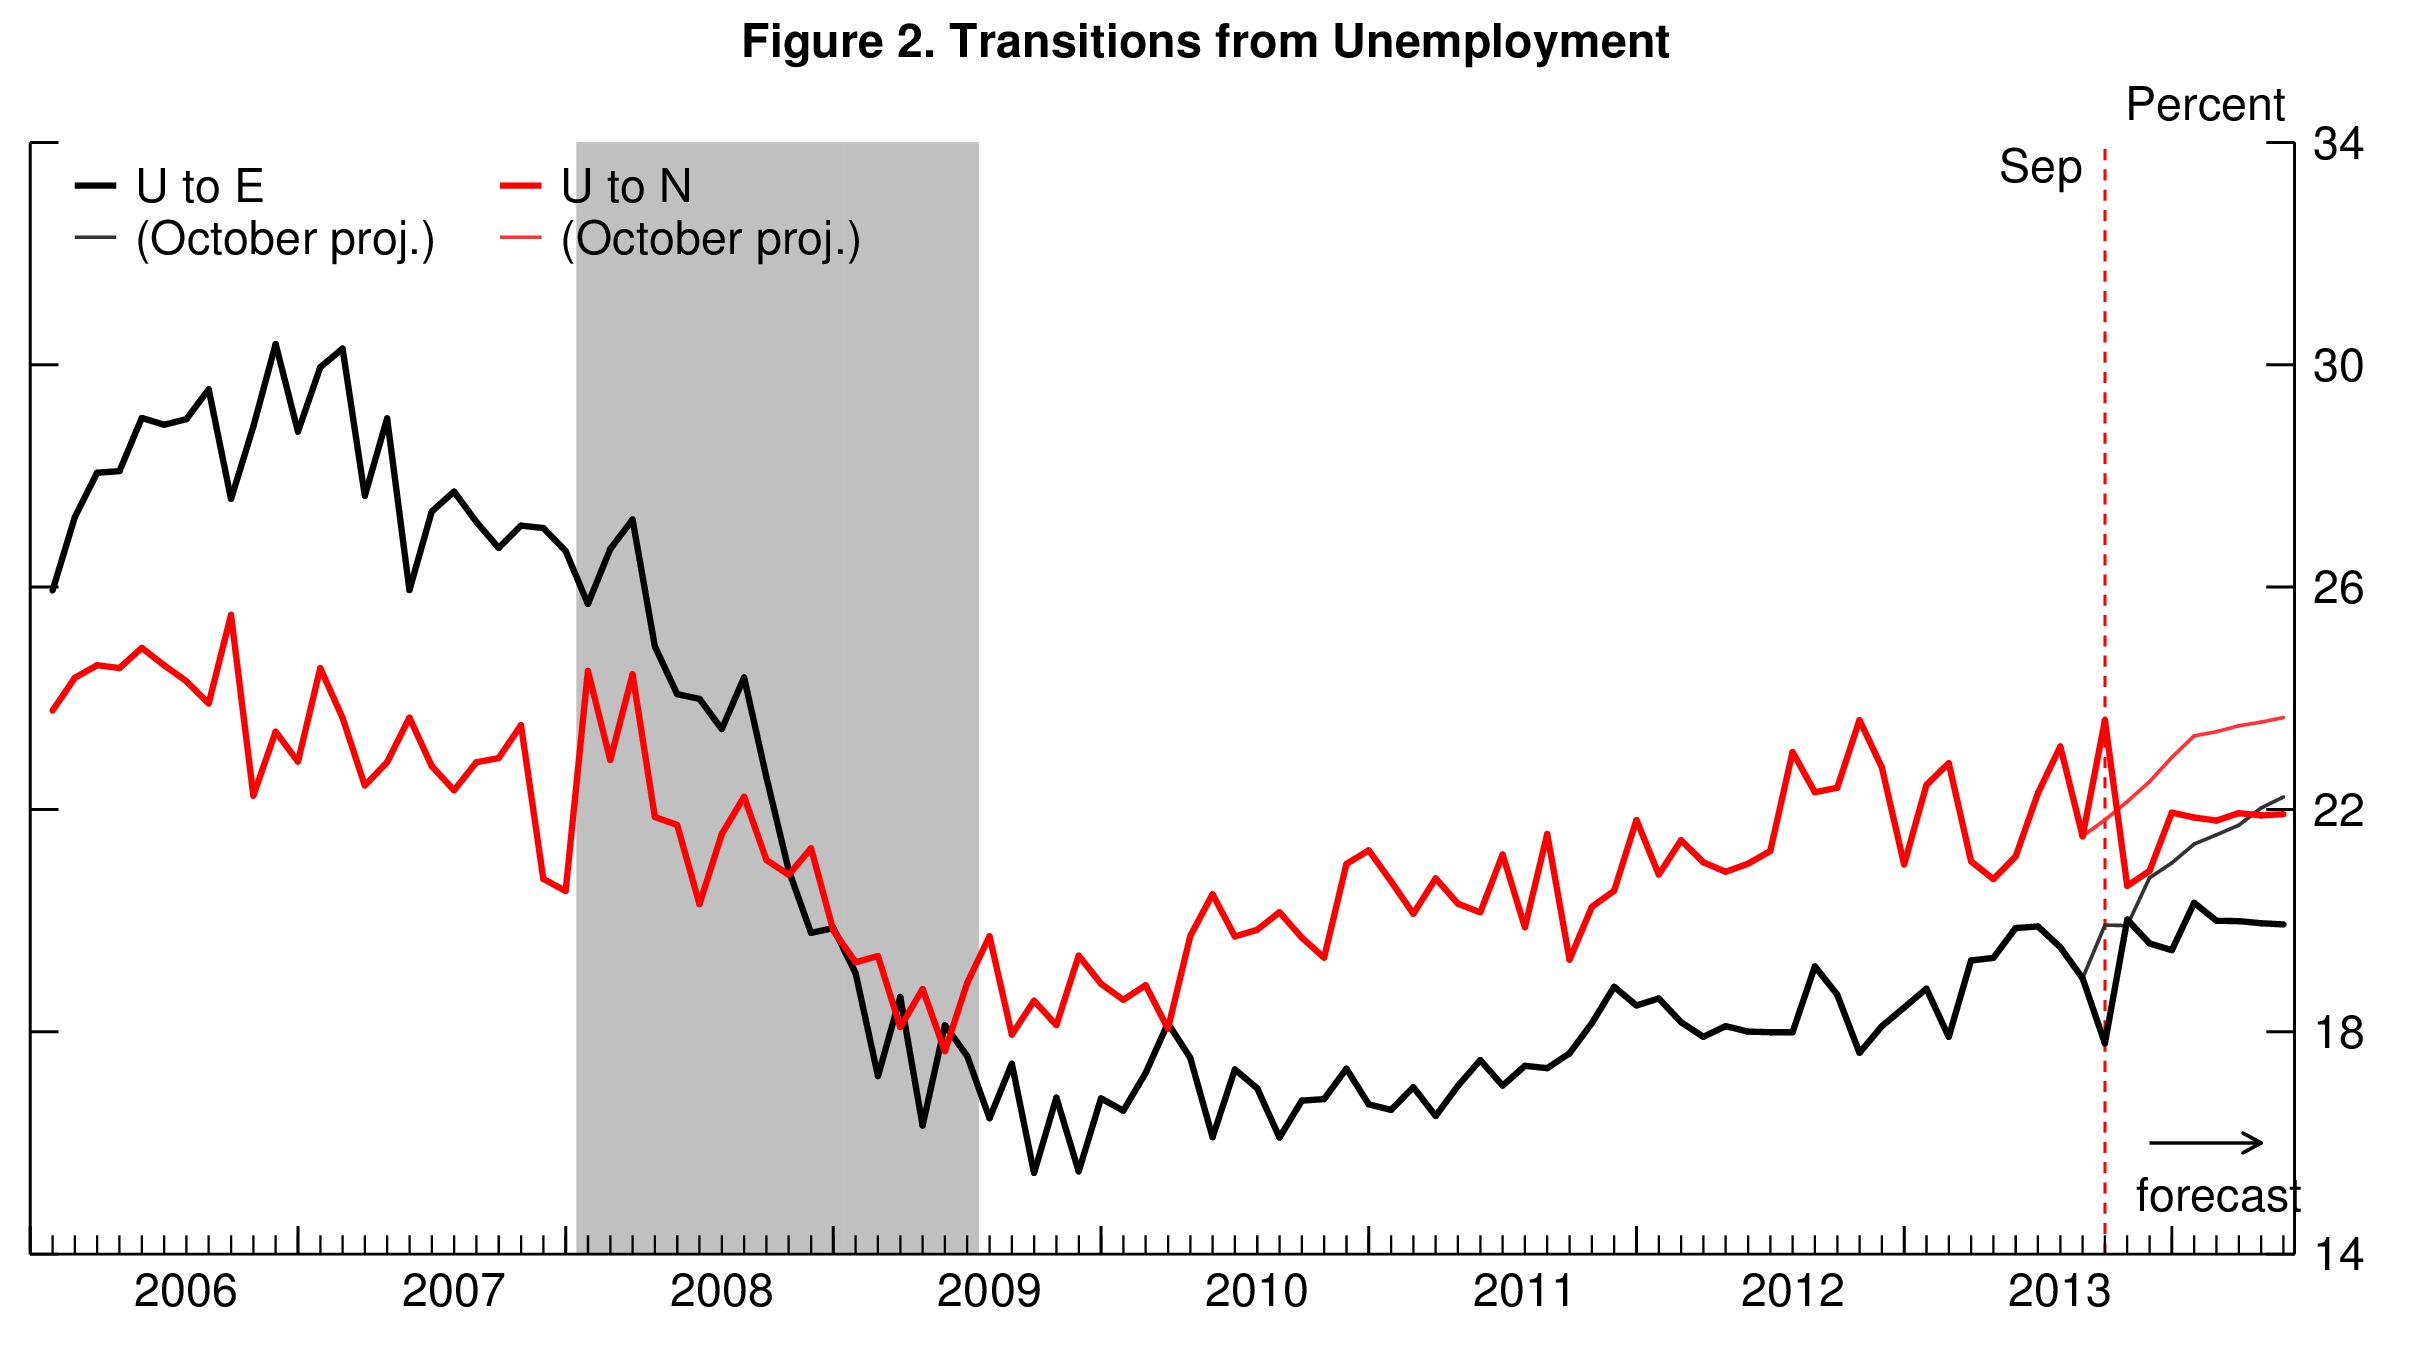
The worker flows out of unemployment and employment (Figures 1 and 2) display unusually large jumps in October, which suggests substantial measurement issues in the October unemployment report (and make this month’s forecast pretty uninformative).
This is not particularly surprising given the likely impact of the government shutdown on the “unemployment survey.”
First, the “unemployment survey” reference week overlapped with the government shutdown, which artificially bloated up the unemployment rate. Indeed, in the Current Population Survey (the household survey used to measure unemployment), individuals are classified as employed, unemployed, or not in the labor force based on their answers to a series of questions about their activities during the survey reference week –generally, the week that includes the 12th of the month. However, because the government shutdown overlapped with the reference week, some federal government agencies were closed or operating at reduced staffing levels during that period. Since the federal employees and contractors who work for those agencies may have been off work for all or part of the week, the shutdown may have bloated the number of unemployed workers, because workers who don’t work during the reference week are considered on “temporary layoffs” and classified as unemployed (more details here).
Second, the timing of the survey collection was unusual. While data collection for the survey typically begins the week following the reference period in October, the survey was delayed and only started a week later. This may be a problem, because we know (from previous experience) that the timing of data collection can dramatically influence the outcome of the survey and in particular the measurement of unemployment.
For these two reasons, I don’t think the October survey was very informative, and I would tend to stick with last month forecast (here) until the November employment report comes out.


To read more about the underlying model and the evidence that it outperforms other unemployment rate forecasts, see Barnichon and Nekarda (2012).


Commentary
Unemployment Likely to Continue to Decline; Don’t Read Much into October Employment Report
December 5, 2013