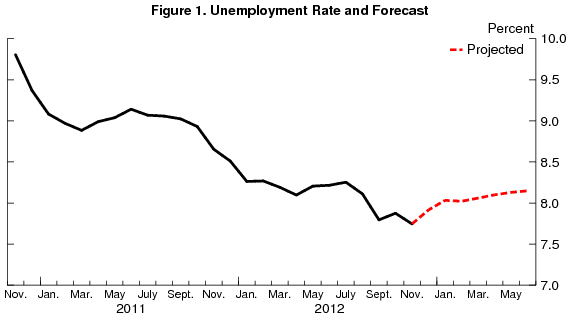
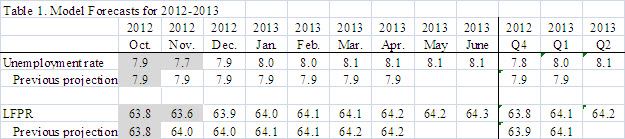
The November employment report showed unexpected declines in both the unemployment rate and in the labor force participation. A stock-flow analysis of the latest report shows that the labor market continues to show many signs of weakness, with no improvements in workers’ job finding rates and a stubbornly elevated rate of job separation. In fact, the unemployment rate mainly ticked down because an unexpectedly high, but likely transitory, number of unemployed left the labor force. Although this month’s forecast should be taken with caution given the possible effect of Hurricane Sandy on the labor market, I now forecast the unemployment rate to remain elevated and tick back up to 7.9% next month, with no improvement over the next six months.
This post discusses my monthly update of the Barnichon-Nekarda model. For an introduction to the basic concepts used in this post, read my introductory post (Full details are available here.)
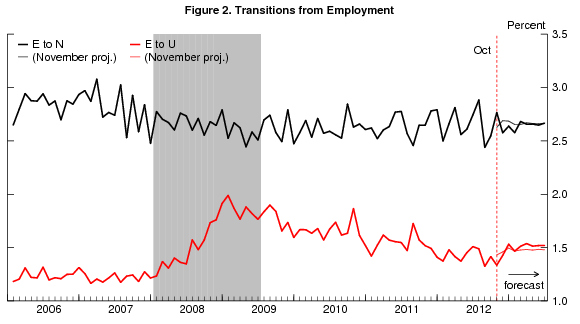
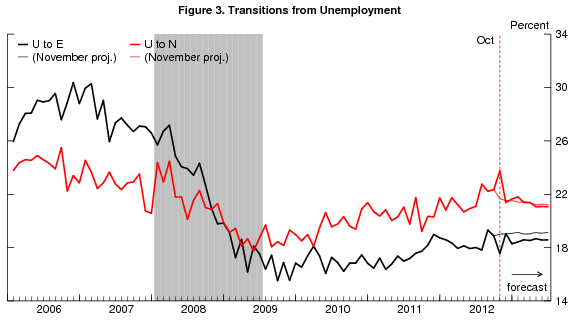
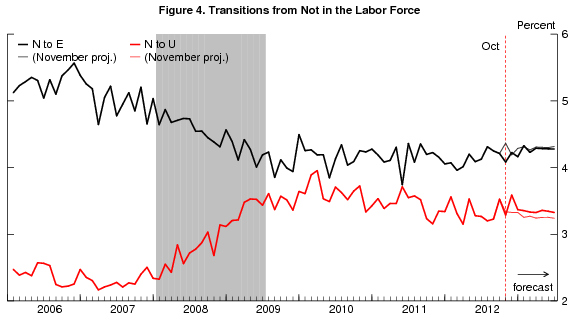
Both the unemployment rate and labor force participation rate declined by 0.2 percentage point between October and November. Digging into the underlying flows—shown in figures 2 through 4 (thick lines)—the improvement on the unemployment front reflects mainly an unexpected increase in the rate at which unemployed people leave the labor force (U-N transitions, figure 3). However, job creation remains very weak, and the job finding rate (U-E) unexpectedly ticked down. These unexpected movements are probably consequences of Hurricane Sandy: in affected areas, firms may have had to delay hiring, and unemployed individuals may have had to postpone any job search.
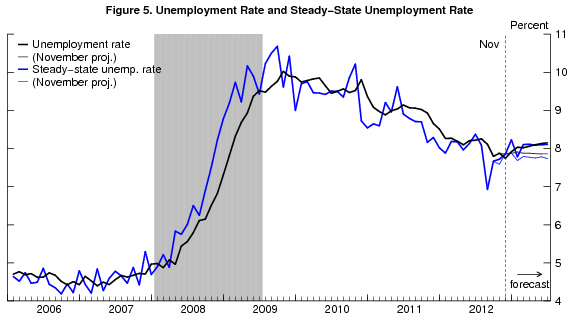
The “steady-state” unemployment rate, the rate of unemployment implied by the underlying labor force flows—the blue line in figure 5—is projected to increase and hover around 8 percent over the next 6 months. Our research shows that the actual unemployment rate converges toward this steady state. At the current level of 7.7 percent, the unemployment rate is below its projected steady-state rate. Thus, I anticipate the unemployment rate to slowly increase over the coming months.
More precisely, the model propagates forward its best estimate for how the flows between employment, unemployment and out-of-the labor force will evolve over time, and constructs the implications for the unemployment rate. However, given the possible effect of Hurricane Sandy on the labor market, the model’s reading of today’s report should be taken with caution. The model is not equipped to capture the effect of a onetime event such as Hurricane Sandy.
With that caveat in mind, the model sees the decline in the job finding rate and the increase in the U-N transition rate as transitory. However, job openings have declined almost continuously since last June (not shown), and the model foresees weaker and weaker recoveries in the job finding rate with each new employment report. In fact, the projection for the job finding rate is now virtually flat over the next six months. This pessimistic projection is all the more striking when one considers that the job finding rate is significantly below its pre-recession level (figure 3).
To read more about the underlying model and the evidence that it outperforms other unemployment rate forecasts, see Barnichon and Nekarda (2012).


Commentary
Labor Market Still Fragile, Unemployment Likely to Tick Back Up Next Month
December 7, 2012