Today’s release of September’s jobs numbers confirms what we all know – too many American workers remain unemployed. As the government reported, the U.S. economy lost 95,000 jobs in September as a decline in government employment outweighed modest private-sector gains. The unemployment rate was unchanged at 9.6 percent. In this month’s blog, we are highlighting how some communities face greater barriers to recovery than others, as well as updating our jobs gap numbers. We will also outline policy proposals for aiding economically distressed communities, which will be released at a Hamilton Project event on October 13.
Threatening the core of the American Dream, a rising number of communities across the nation confront the permanent loss of industries, a glut of empty homes, and high rates of unemployed but able workers. While history suggests that most communities will bounce back somewhat quickly from recessions and other economic shocks, some do not. The time necessary for a complete recovery may be measured in decades for these distressed communities.
To help illustrate this emerging challenge, and to show where new programs might be targeted, we have mapped the 20 percent of counties with the greatest increase in unemployment rates since the start of the Great Recession.
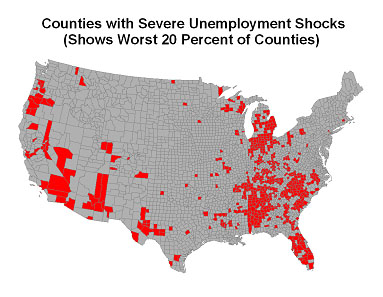
The result is not altogether surprising. Three regions of the country have suffered the most greatly in terms of unemployment: the Rust-Belt in the industrial Midwest (particularly Michigan, Northern Ohio and Indiana and Western Pennsylvania), the Deep South (including Florida), and part of the Western Region (including California, Nevada, Arizona). These areas have all suffered severe declines in manufacturing and/or the bursting of the housing bubble in states that saw the largest booms in housing prices.
Why should we be concerned about these pockets of unemployment? History tells us that concentrated economic distress can have lasting negative effects on residents and communities.
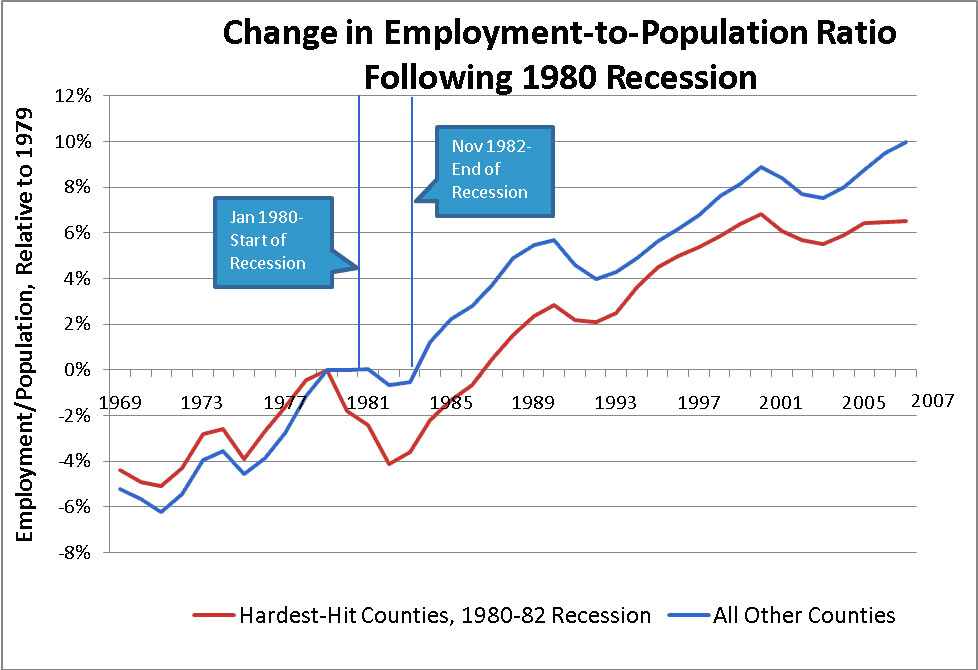
To illustrate this point, we need only to look at what happened to some of the hardest hit counties from the 1980-82 recession, which was the deepest recession in the last several decades. Even after the U.S. economy had recovered from that economic shock, the 20 percent of counties that were hit hardest by the recession (shown in red in the Figure above) experienced smaller increases in their employment-to-population ratios than the rest of the county (shown in blue) and slower growth in income per capita for decades to follow, underscoring the persistence of these employment problems.
The Hamilton Project argues that the nation needs an economic strategy to aid economically distressed communities – a point we will highlight through the release of papers and in a series of discussions during our upcoming event. Since there is no “one size fits all” solution for getting people back to work, we propose a three pronged strategy that aims to bring jobs to communities and workers, help mid-career workers find new skills and training, and match workers to new jobs, even if that means helping workers relocate to communities with job opportunities that better match their skills. We will also release three targeted discussion papers by worldwide experts that propose specific policies in each of these categories. We don’t believe that any one policy will be the solution for our nation’s ailing communities, but do assert that without a new focus on policy for distressed communities, we risk history repeating itself.
THE JOB GAP
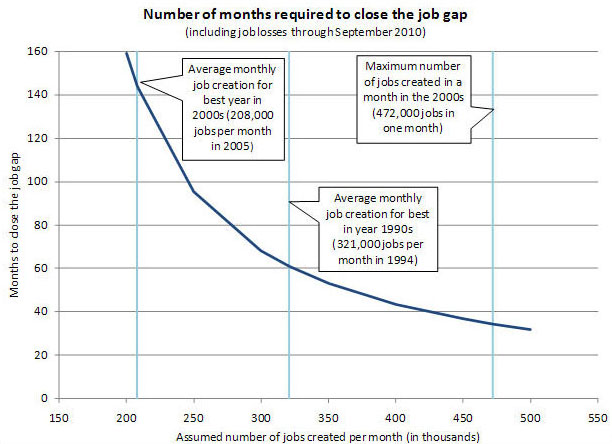
Stepping back to look at the big picture of our nation’s recovery, we once again explore the “job gap” that The Hamilton Project has tracked for each of the past several months. The job gap is the number of jobs that needs to be created for the economy to return to pre-recession employment levels and to absorb the 125,000 new entrants to the labor force each month. Based on the September unemployment numbers, the job gap grew to 11.9 million jobs, widening for the fourth month in a row.
The graph below shows how long it will take to fill the job gap at different rates of job creation. If the economy adds about 208,000 jobs per month (the average monthly rate for the best year of job creation in the 2000s) then it will take almost 12 years to close the job gap. At a more optimistic rate of 321,000 jobs per month (the average monthly rate for the best year of the 1990s) the economy will reach pre-recession employment levels only after five years.
Clearly, our economy is still far from a full recovery. This is especially true for a new generation of communities in economic distress that may require more targeted forms of support in order to join the rest of the country in a path toward economic renewal. The papers proposing new policy ideas on this topic will be available from The Hamilton Project website on October 13.


Commentary
New Challenges for a Nationwide Recovery
October 8, 2010