Note: This post originally appeared in a February 18, 2015 Health Affairs Blog.
In April 2014, the Centers for Medicare and Medicaid (CMS) released millions of lines of Medicare Part B physician payment data, that led many researchers, analysts, journalists, and the general public to use the data to answer a number of pressing health care questions. And while the dataset does not include patient-level information, it does offer provider identifiers, which can facilitate data aggregation, highlight practice patterns, and cost trends (i.e. specialties with disproportionately higher payments and individual providers as “outliers”).
Our goal here, like many before us, is to highlight striking disparities in this dataset (despite its limitations); attempt to understand why they occur; and provide opportunities to address them.
We examine three major issues: geographic variation; individual provider variation; and variation across care settings. Finally, we outline recommendations for future data releases to encourage more practical analyses.
Geographic Variation in Practice Patterns
A popular example highlighted by the CMS data was the rate of use of Lucentis–a drug prescribed for patients with age-related macular degeneration (AMD). Although a clinical study demonstrated similar outcomes for Lucentis ($2,000 per dose) versus Avastin ($50 per dose), the CMS data revealed total Lucentis spending of $1 billion. Reports also highlighted several ophthalmologists whose Lucentis billings were so high that they can only be described as “outliers.”
We analyzed the geographic pattern of Lucentis use by looking at the proportion of unique beneficiaries who received Lucentis by state (Exhibit 1).1 The states showing the highest proportion of Lucentis administration were Connecticut (82 percent), New York (67 percent), Iowa (66 percent), and Kansas (64 percent).
On the other hand, no beneficiaries received Lucentis in Alaska and Wyoming, and in South Carolina, Montana, and Idaho less than 10 percent of beneficiaries received Lucentis.
Exhibit 1: Percentage of Medicare Part B Beneficiaries that Were Prescribed Lucentis by Ophthalmologists by State, Year 2012
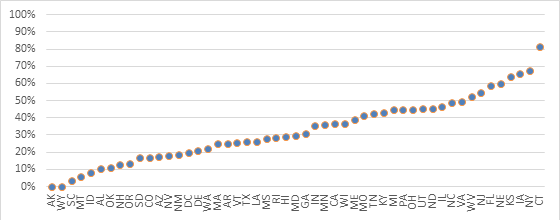
Source: Author’s calculations using CMS’ Medicare Provider Utilization and Payment Data
We also looked at the mix of Lucentis and Avastin usage by calculating the percentage of providers within a state administering only Lucentis (Exhibit 2). In 15 states, over 25 percent of ophthalmologists administered only Lucentis. This was highest in Connecticut, where over 24 of the 32 providers followed this pattern.
However, in the majority of states, most providers administered a mix of the two drugs, indicating that they potentially took patient circumstances and costs into account, even though Avastin is considered an off-label drug for AMD. When the Office of the Inspector General (OIG) conducted a study about the incentives of physicians to provide Avastin over Lucentis, 70 percent of physicians responded that cost was the primary factor, 45 percent reported that effectiveness was a reason, and 40 percent gave patient insurance coverage as a reason.
Articles have criticized high Lucentis users, but the number of providers administering Avastin instead of Lucentis (or a mix of both)—even though economic incentives encourage Lucentis, and Avastin is considered off-label for this particular condition—shows that many providers are willing to think not just of patient outcomes, but of costs as well.
Exhibit 2: Percentage of Ophthalmologists Prescribing Only Lucentis to Medicare Part B Beneficiaries by State, Year 2012
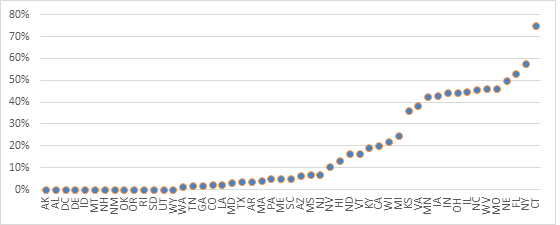
Source: Author’s calculations using CMS’ Medicare Provider Utilization and Payment Data
Variation Across Sites of Care
Medicare reimburses for procedures and services differently depending on where they are provided. The justification is to offset the higher overhead costs of certain facilities (e.g. hospitals and surgical centers compared to physician offices).
However, this reimbursement mechanism can incentivize providers to conduct services in higher-paying settings when unnecessary, as well as to fraudulently bill for such settings even when services are delivered in lower-paying sites. For example, an OIG study found that in a sample of 100 services, providers incorrectly attribute the site of service, resulting in overpayments.
We examined sites of service for non-complex office visits across gastroenterology, cardiology, and oncology — three specialties that tend to deliver care across a range of sites. Medicare reimbursement is higher for hospital visits as compared to those in a physician office.
Overall, we found that most doctors bill regular, level 3 evaluation and management visits in non-hospital settings. Oncologists have the highest percentage billed in hospital-type facilities –15 percent of non-complex office visits. In this case, we were limited in our analysis because the dataset does not include the additional amount that is paid in hospital settings.
Over and Under-Utilization of Procedures and Services
Improper utilization of procedures can often be indicators of medical inefficiency or fraud. One analysis of possible overutilization pulled from this dataset has been conducted by the investigative reporting nonprofit ProPublica.
Since Medicare codes patient visits on a scale of complexity, one being the least complex and five being the most complex, ProPublica highlighted providers billing for mostly complex, expensive visits at seemingly unexplainably high rates.
Their analysis spurred conversations around Medicare billing practices for outpatient visits — in general, it was considered unlikely that providers should only be billing at the highest complexity levels; patient-level data on outcomes or risk adjustment—not included in the data release—would unlikely justify such a pattern.
Recommendations for Future Data Releases
Integrate Data Sources to Identify Harmful Financial Incentives. As more health care data sources are released into the public domain, these can be integrated to conduct deeper analyses and achieve a fuller view of a provider’s practice. For example, in September 2014, Medicare released the Open Payments dataset, which contains information on the financial relationships between providers and pharmaceutical and medical device companies.
Though this dataset is currently quite limited in its usefulness to researchers, if later versions are improved, they could be linked to the Medicare Part B physician data to uncover whether providers delivering unusually high concentrations of specific services, such as outpatient prescription drugs or durable medical equipment, are receiving payments from pharmaceutical and medical device companies for their provision.
To gain a better understanding of a provider’s quality of care, quality reporting data should also be integrated in future datasets. For example, information could be included from the Physician Quality Reporting System (PQRS) – a program that provides physicians with payment incentives and adjustments to adequately report quality data.
Develop a Continual Data Verification System. Physician advocates have voiced concern that the data included in the Medicare physician payment data could be erroneous and thus misleading. For example, because clinicians working under a physician’s supervision can bill under their name (or National Provider Identifier), in the current dataset it may appear as though a single physician has provided more services than they actually have.
Specialty societies have therefore suggested that, in future data releases, physicians should have the ability to review and correct potential mistakes before the data are published. Physicians were in fact afforded the ability to review and dispute the Open Payments data before its release, through the use of a government website. However, physician advocates still criticized the review process as too rushed and cumbersome.
This process must therefore be better streamlined and physicians should be allowed to review and update their information (e.g. changes of address) on a continual basis, as needed.
Render Health Care Data More Accessible to All Researchers. Researcher access to Medicare health care datasets is often limited due to excessive costs for their use and substantial delays in gaining access. Currently, to gain access to a multitude of useful Medicare provider data, researchers must pay a fee that can exceed $100,000.
Moreover, the data files themselves are often unwieldy, requiring the use of expensive statistical programs for their analysis. Both the cost and complexity of these datasets means that their use by independent researchers and analysts is hampered. To propel greater analysis of this information, CMS should change its data sharing policies to render datasets less expensive and more accessible to a wider range of researchers.
Include Facility Cost Data. As outlined in sections above, inclusion of facility cost information could help better identify those providers who deliver services in higher-paying hospital settings, when they could be delivered in lower cost community or physician office settings. The inclusion of facility cost data could also allow deeper analyses on specific subspecialties and procedures, and create further evidence on the need for facility payment methodologies that are site neutral.
In fact, CMS and the Medicare Payment Advisory Commission (MedPAC) have both proposed plans to implement site-neutral payments, but further research by a wider range of organizations must be lead to help determine suitable subspecialties and procedure codes where payment differences are particularly egregious.
Include Patient-level Data. The current dataset lacks patient information such as age or diagnosis, information that is necessary to determine whether a service provided is indeed low-value to a specific type of patient. Taking the case of prostate cancer screenings—which are deemed unnecessary for men over the age 75—a service might only be low-value for patients of certain ages, as well as with certain health care conditions.
As many recommendations are based on a patient’s age, if releasing individual patient-level age data poses a problem, such as privacy, CMS should consider grouping patients into five-year cohorts (i.e. 60-65, 66-70, etc.). In general, the inclusion of patient information, even if it were aggregated to the individual provider level, would be useful to ensure that findings can be risk-adjusted and that providers serving higher-risk and more complex patient populations are not criticized for higher spending patterns that result.
Include Geographic Benchmarks. Research has shown that health care utilization varies based on geography. Therefore, geographic benchmarks, perhaps by hospital referral region, based on local demographics, must be included in future datasets to enhance geographic comparisons of utilizations rates for individual providers and health systems, as well as procedures, tests, and prescriptions.
Include Time-series Data. The 2014 dataset only includes information from 2012. In future releases, we not only recommend that the data be up-to-date, but we also suggest that more historical data be provided so as to allow deeper analyses of provider utilization and cost trends over time.
Though the release of the Medicare physician payment dataset signified a historically large step toward transparency, there is still a long way to go before these data can be considered useful for analysis. Yet, even once datasets are improved upon, and the information provided is cleaned and perfected, the achievement of “meaningful” transparency will require further steps.
That is, we will then have to explore how this useful information can be translated adequately to the consumer so as to ensure its use when choosing a provider. Only then—when consumers are able to be “smart” shoppers—can this information potentially lead to provider competition on price and quality, and ultimately propel overall health system improvement.
[1]Avastin can sometimes get billed as ‘unclassified biologics’ or ‘drugs unclassified injection.’ Based on conversations with ophthalmologists we found that it was unlikely for any other drugs in these categories to fall within Avastin’s price range. We included HCPCS codes billed by ophthalmologists between $40 and $62 (the maximum allowable in 2012 and three standard deviations below that number) at the risk of including drugs that were not Avastin.


Commentary
How open data can reveal–and correct– the faults in our health system
February 18, 2015