Attempting to quantify governance would be rather complicated if not futile. And in any case, national governance changes very slowly, taking generations. Besides, economic policies drive economic development outcomes.
Such views were common 25 years ago when Aart Kraay and I embarked on a research initiative to define and measure governance, which led to the Worldwide Governance Indicators (WGI). We just released the annual update of the WGI, a series that now goes back a quarter century (1996-2020). Based on the twin premises that governance is a rather generic notion that requires unbundling into its specific components, and that these could be rigorously measured, we developed the WGI as a set of composite indicators covering six dimensions of governance for over 200 countries: (1) Voice and Accountability, (2) Political Stability and Absence of Violence/Terrorism, (3) Government Effectiveness, (4) Regulatory Quality, (5) Rule of Law, and (6) Control of Corruption.
The WGI bring together information from over 30 different data sources, capturing the de facto experiences and feedback of thousands of experts and survey respondents, including well-known surveys of households and firms, as well as a variety of expert assessments produced by the private sector, nongovernmental organizations, and public sector agencies. The WGI website provides interactive access to the latest data on the six aggregate indicators for each country in alphabetical order, the data sources on which they are based, and complete documentation of the methodology.
From the outset, the WGI approach and methodology—which has remained the same throughout, permitting comparisons over time—was advised by academics and was subject to academic journal review. Further, a clear separation was made between those responsible for generating the WGI through its methodology—we—and the myriad of diverse sources from around the world providing the individual data used as inputs to the WGI composites we constructed. In addition to providing a methodology that would estimate how countries scored on the various governance dimensions, we ensured that the methodology and its use of the data would also permit us to be fully transparent and precise about the extent of imprecision in the indicators. Even if margins of error are rarely disclosed in official or other data releases, they are inherently present in any economic, social, and governance-related data or indicator. And this matters for making careful inferences and policy analysis.
The WGI have contributed to informing and quantifying the growing consensus that good governance is a vital ingredient to standards of living for citizens, to security, and to attracting investment. This has led to their use by many agencies, including risk rating and donors. This is consistent with our original tenet that views governance as the process by which governments are selected and replaced; about the policy choices they make and implement; and about the respect of citizens and the state for the laws and traditions that govern their interactions. These matter for development, so it is not surprising that rich countries on average rank higher in the WGI than poor countries do. But that is only an average outcome; for a particular country, this association is not set in stone.
Today’s reality: Diverse governance challenges in rich countries and beyond
Countering the common tendency to generalize about the quality of governance across income groups and regions, the data points to significant variation across countries within an income group or a region, as well as across governance dimensions in the same country or region.
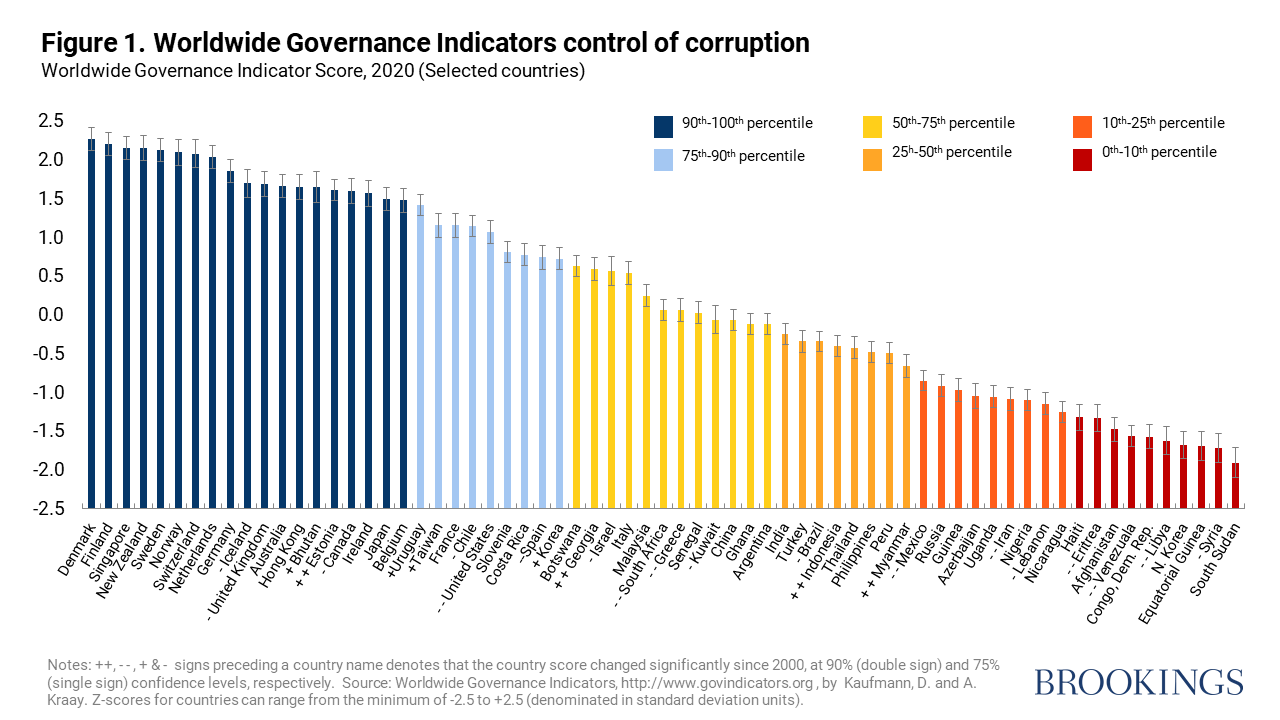
High variance among rich countries. While rich countries exhibit higher standards of governance on average, the variance across countries in this –and any other—group is considerable. In the Control of Corruption indicator, for instance, while the Nordics, New Zealand, and Singapore consistently score very highly on this dimension, that is far from the case today for other rich countries, such as the U.K., Italy, or the U.S., the latter being surpassed by over 35 countries, including Estonia, Taiwan, Uruguay, and Chile (the latter by a small margin, implying a statistical tie). As seen in Figure 1, a bit further down in the scale Costa Rica surpasses Spain, and further down Botswana and Georgia surpass Italy, and, by a long stretch, Greece.
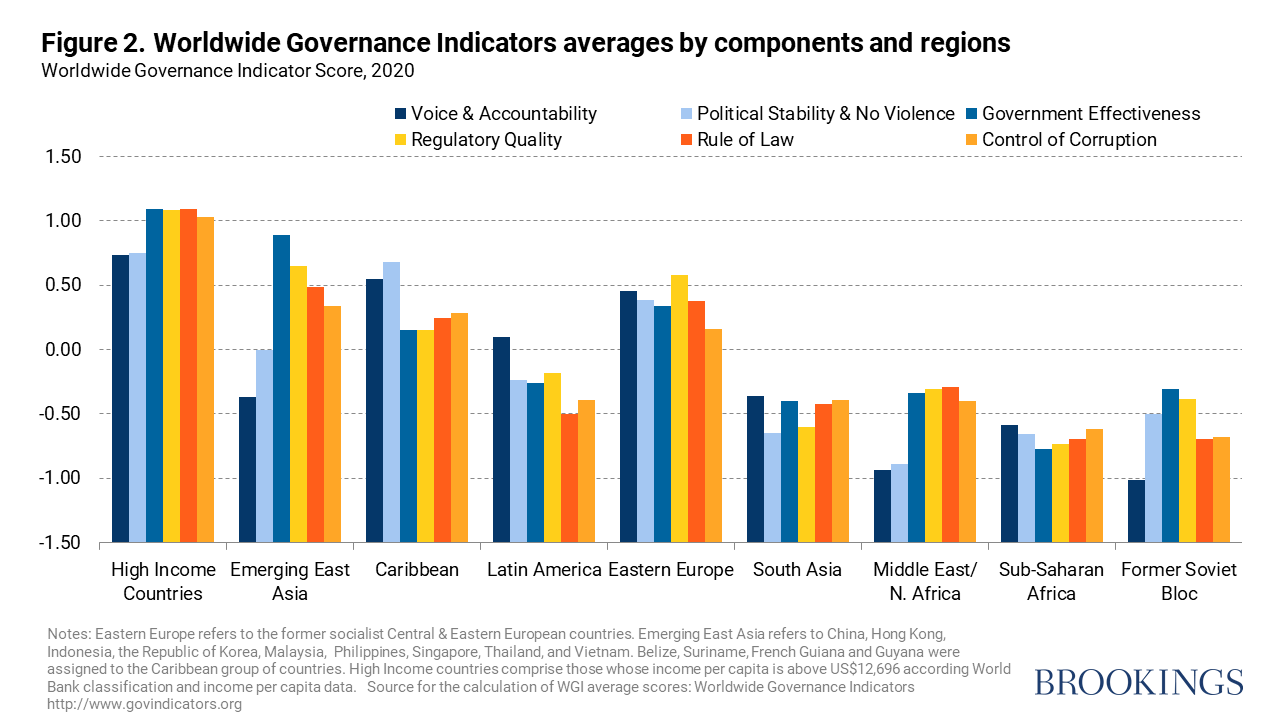
The governance deficit in high-income countries. Such high variation among rich countries is prevalent across the various indicators and explains why the average score for the high-income group is far from stellar for any of the governance indicators, even if they tend to surpass the average of other groups of countries. As seen in Figure 2, it is noteworthy that for instance for Voice & Accountability, as well as for Political Stability and Absence of Violence, some of the regional groups comprising many emerging countries come close to the performance of the rich countries on average, such as the former socialist countries from Central & Eastern Europe and the Caribbean.
The practical relevance of unbundling governance: The governance deficit is not uniform within a region or country. Further, as also depicted in Figure 2, the evidence from the WGI suggests that governance standards vary substantially across the various governance dimensions within some regions. For instance, Emerging East Asia performs well in Government Effectiveness, yet it exhibits a major governance deficit in Voice & Accountability (as is also the case in the Middle East/North Africa and in the Former Soviet bloc countries). This contrasts Latin America which does relatively well on Voice & Accountability, but not so on Government Effectiveness. At the same time, these regions do share the challenge of relatively low standards in Political Stability and Absence of Violence, as well as in controlling corruption, although regional averaging masks substantial variance across countries in a region. For instance, Latin America includes countries scoring highly such as Uruguay; rating poorly like Mexico, and then failing scores near the very bottom worldwide, such as Nicaragua and Venezuela (Figure 1).
Does governance evolve over time?
The WGI time series provides insights on how invariant governance is over time, of which a couple are highlighted in this space.
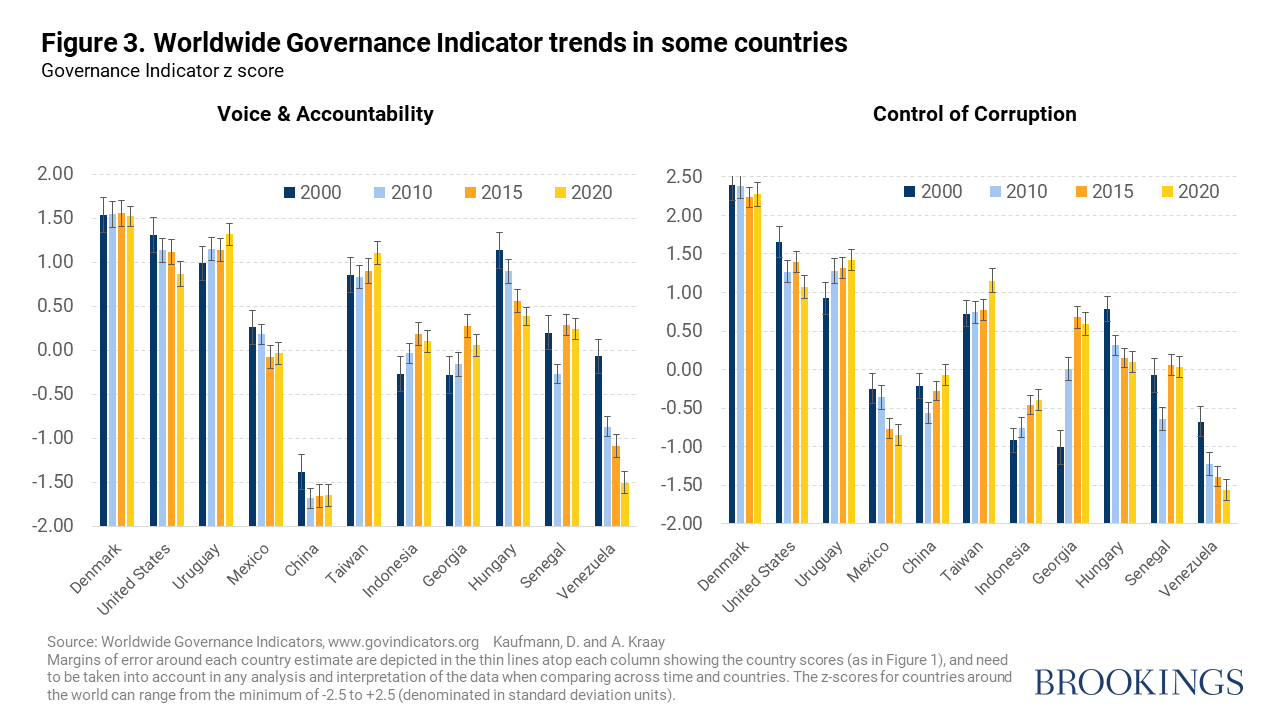
Substantial changes in governance take place. First, even within a decade, and certainly over two decades, significant changes do take place. While over the decades many countries muddle through or stay relatively stable at a high or low level of governance, a substantial minority exhibit large changes, many of which are highly significant in statistical terms. Such meaningful changes take place in both directions. Illustrating some country cases in Figure 3 for two governance dimensions, namely Voice & Accountability and Corruption Control, we note that while countries such as Denmark (like other Nordics and New Zealand as well) have been world benchmarks across governance dimensions, substantial changes have taken place in other countries. And as illustrated by the trends in Voice & Accountability, for instance, the opposing “directions of travel” for different pairs of countries is also noteworthy, whether we contrast in the Americas the upward trend in Uruguay against the governance deterioration in the United States, or the upward trend of Taiwan or Indonesia against the reverse trend in China in Asia, or Georgia against Hungary among post-socialist economies.
But often governance evolutions are nonlinear. In fact, following years of unchanged standards of governance, meaningful changes in country governance standards can take place rapidly over five years in either direction, even if not the norm. Further, over a decade or two, countries can also experience “reversals of fortune” in either direction (e.g., U-shaped or inverted). Different types of such nonlinearities can be seen in Figure 3, where the case of Senegal is illustrative, showcasing a “positive” U-shaped reversal over time on both of the featured governance indicators.
Questions ahead
One salient corollary of unbundling governance to its diverse and specific set of components, and embarking in their measurement over time, is the empirical observation that there are many countries (and some regions) exhibiting rather “uneven” standards across these different governance dimensions.
First, since these governance dimensions interact with each other—such as voice and accountability being an important ingredient to control corruption—a question for further inquiry is whether the laggard governance dimension will drag or reverse governance and development progress in a country. This is currently relevant since many countries—such as most in the Persian Gulf, as well as China, Russia, Azerbaijan, Rwanda, Hungary, and Turkey—have experienced very challenging and/or sharply declining standards of voice and accountability, but without a similar decline in some other governance dimensions.
Second, questions for global security and development arise from observing that the countries that are models of good governance are not the same as the most powerful. When coupling China’s uneven governance standards with the far from stellar and declining standards (by the end of 2020) in the other global power—the U.S.—the geopolitical challenge may be particularly acute: Is the likelihood of costly mismanagement of the tensions and differing interests higher than in the past, unless governance in both countries improves?
Related Books

Further, the governance standards of the U.S. and China, each with its own faults and challenges, likely will matter for determining how both countries evolve in their foreign policy and aid, and whether they will draw sobering governance lessons from decades of being involved in many settings in Africa and Afghanistan, for instance. The poignant lessons of the political debacle and human suffering in Afghanistan need to be supplemented by a hard look at the evidence, including governance: The fact that the WGI indicates that Afghanistan stayed near the bottom for decades is also a lesson on foreign intervention and aid.
Such lessons from the evidence on the evolution of governance standards in aid-dependent countries are not merely for the U.S. or China, but also for other bilateral aid donors and for the international financial institutions (IFIs). While some aid has supported development progress in countries improving governance, billions have also been wasted by pouring funds into countries where governance and corruption control has not progressed, or worse. Coupled with a renewed (post-COVID-19) recommitment to better strategies to help address corruption, considering a fresh approach to aid effectiveness in governance-challenged settings may be called for.
Yet not all is doom and gloom. The trajectory of some countries shows that attaining good governance standards in less than a generation is possible, while others have managed to maintain high standards for decades in many parts of the world. While much has been aptly written recently about the growing democratic governance deficit in many countries, learning from the evidence of those countries that have been improving—contrasting the failures—is also critical, and is a more sound research strategy. Rigorous collection and use of relevant data will continue to help inform this type of question.
The WGI do not reflect the official views of the Brookings Institution, the World Bank, its Executive Directors, or the countries they represent. The WGI are not used by the World Bank Group to allocate resources. For more information on data access and terms of use, visit www.govindicators.org. The author of this blog is solely responsible for the views here and appreciates the research assistance of Saba Yifredew.
Related Content


Authors


Commentary
It’s complicated: Lessons from 25 years of measuring governance
September 30, 2021