Emerging markets (EMs) produce a large and growing share of world GDP. Taken together, EMs constitute the largest block in the world economy and contribute the most to global growth. About half of advanced economies’ (AEs) imports are sourced from EMs, which in turn have become important destinations for AE exports. EMs taken together are the world’s largest consumer of commodities, including metals and energy.
Hence EMs should be a large source of (cyclical) spillovers to the rest the world. But little is known about these spillovers. Indeed, the literature has focused mostly on spillovers from AEs (see Österholm and others 2007; Utlaut and others 2010; Erten 2012). While AEs were arguably the most important source of spillovers for most of the second half of the 20th century, the changing nature of spillovers from EMs to the rest of the global economy will undoubtedly be the main drivers behind commodity and financial markets as well as for trade in goods and services for the remainder of the 21st century. It is thus high time to gain a better understanding of the EM block, not only as a destination, but also as a source of spillovers.
Some have attempted to study spillovers from EMs, but focused on individual EMs, mostly China (Hsieh and Ossa 2016). This blog is based on Arezki and Liu (forthcoming), which takes a broader perspective on spillovers from EMs to AEs.
The changing asymmetry of spillovers
The main contribution is to document empirically that global spillovers are asymmetrical. Based on a two-block setup and covering the past 25 years, we show:
- The size of the spillovers from EMs to AEs is about one-fifth of those from AEs to EMs.
- Spillovers from EMs to AEs increased during the second half of the sample period.
A casual look at data on the evolving structure of trade and financial interdependence suggests that global spillover may indeed be asymmetrical and changing:
- The EM block depends relatively more on external demand, suggesting that spillovers from AEs to EMs would be expected to be large.
- AE’s dependence on external demand is increasing, suggesting that spillovers from EMs may be increasing.
- The EM block depends more on capital inflows, suggesting that spillovers from AEs should be large.
- AE’s dependence on capital flows is increasing, suggesting spillovers from EMs should increase.
Using state-of-the-art vector autoregressive (VAR) techniques, we systematically document the asymmetrical nature of global spillovers stemming from growth shocks (Figure 1). We construct an “elasticity” of the spillover as the ratio between the cumulative impulse response and the shock over a one-year horizon.
- The elasticity of the spillover from EMs to AEs is 0.11, less than one-fifth of the elasticity of the spillover in the other direction (0.78). That is, a 1 percent increase in EM growth leads to a 0.11 percent increase in AE growth, etc.
- The elasticity associated with spillovers from EMs to AEs is growing. It jumps from 0.06 in subperiod 1 (1991 to 2002) to 0.37 in subperiod 2 (2003 to 2015). The elasticity in the other direction is relatively high in both subperiods (0.82 and 0.95).
Figure 1. Impulse response functions using our benchmark specification
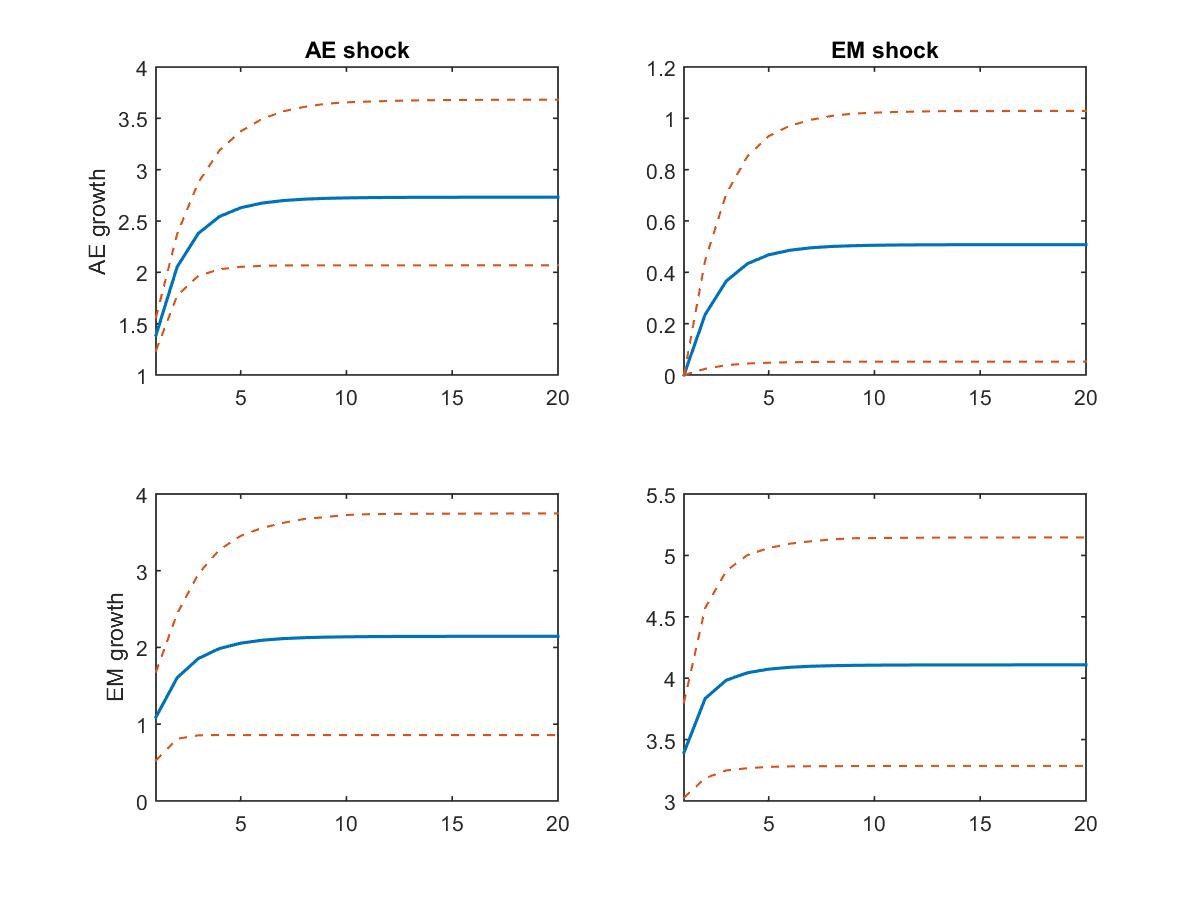
Source: Authors’ computations and International Monetary Fund data.
Note: The sample period is 1991Q1-2015Q4. The impulse response functions are based on a bivariate VAR with AEs and EMs growth. Dash lines show the 90-percent Bayesian credible interval.
Identification strategies
The initial shocks are of course not exogenous and may themselves be the result of spillovers from earlier shocks. Choosing an identification strategy is a challenge in documenting spillovers between EMs and AEs. In our benchmark VAR model, we assume that AE shocks spill over to EMs virtually contemporaneously—that is, within a quarter—but that EM shocks take longer to spill over to AEs. Relying on that timing assumption results in a finding that a large part of co-movement between growth in EMs and AEs is due to AE shocks. In turn, this could lead to overestimating the magnitude of the spillovers to EMs that originate from AEs. We thus also explore different avenues including exogenous variables to test whether our results are sensitive to the choice of decomposition. Specifically, we exploit the arguably exogenous shock that stems from damage caused by large natural disasters—assuming, we think sensibly, that the timing of a natural disaster cannot be endogenous (Figure 2). We explore the spillovers from monetary and fiscal policies and geopolitical shocks—the latter is an attempt to capture political contagion discussed below. The results are similar: Spillovers from AEs to EMs are asymmetrical.
Figure 2. Impulse response functions using an augmented specification with damages from natural disasters over the two subsample periods
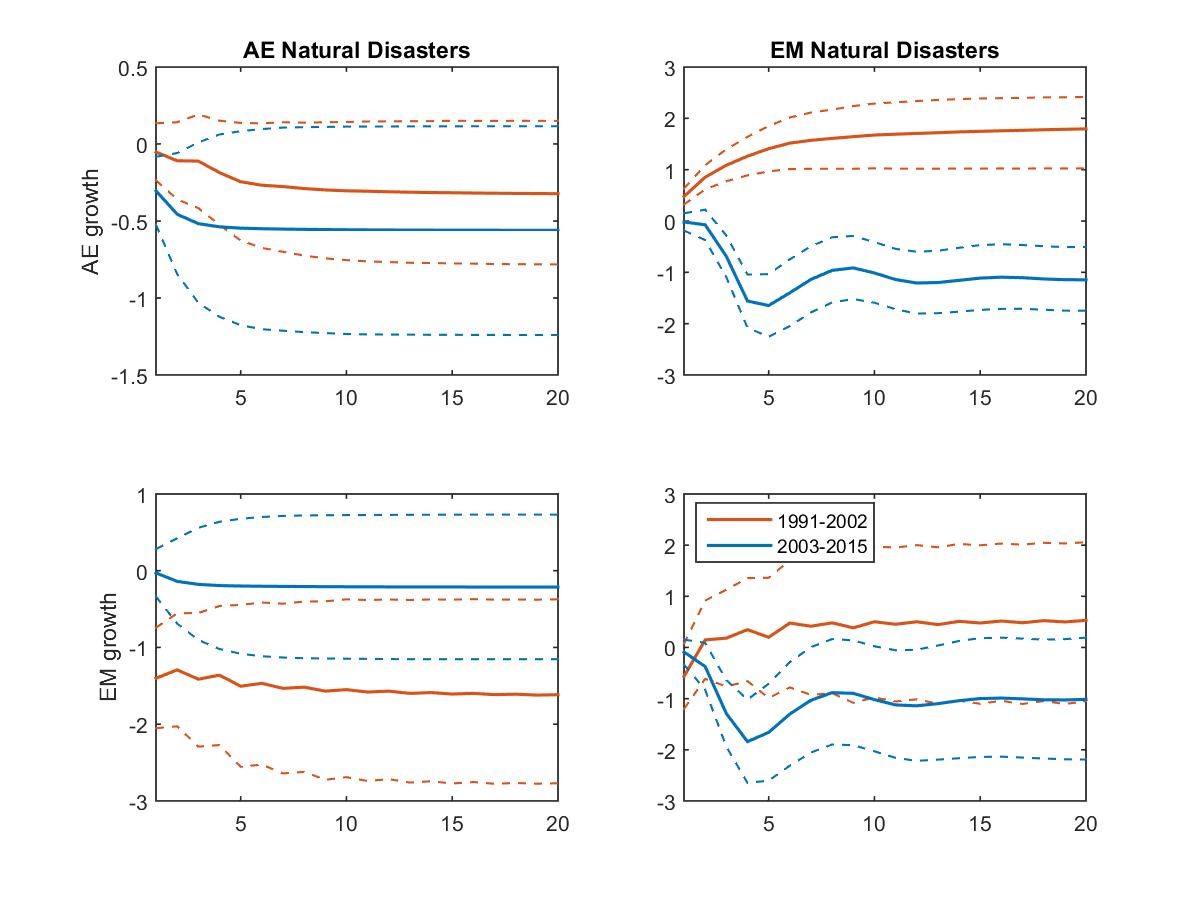
Sources: Authors’ computations and International Monetary Fund data.
Notes: The impulse response functions are based on a bivariate VAR with AEs and EMs growth. Dash lines show the 90-percent Bayesian credible interval.
What are the origins of spillovers?
Theoretical literature identifies three potential explanations for the origins of spillovers: the “fundamental,” the “financial,” and “coordination failure” (see survey by Rigobón, 2018).
The fundamental explanation of spillovers between countries relies on real channels such as bilateral trade, trade of similar goods with a common market, monetary policy coordination, and macro similarities. The financial explanation relies on the constraints and inefficiencies in banking sectors and international equity markets. Existing theories for the third, coordination failure, include explanations where spillovers are due to multiple equilibria, herding, learning, and political contagion.
Related Books

To explore the relative importance of these channels in explaining the transmission of spillovers, we conduct a variance decomposition to “distribute” the spillovers. We find that the relative shares of the trade, commodity, and finance channels—with the first two relating to the “fundamental” channels and finance relating to the “financial” channels laid out by Rigobon— in total spillovers stemming from AEs to EMs are, respectively, 21.8 percent, 66.6 percent, and 62.3 percent. Trade, finance, and commodities account respectively for 22.2 percent, 50.8 percent, and 40.8 percent of the spillovers from EMs to AEs. Results suggest that finance and commodities are the more important channels of shocks between AEs and EMs. These results are consistent with the work of Rey (2013) on the existence of a global financial cycle in asset prices, capital flows, and credit growth—over and above the influence of domestic macroeconomic conditions.
Related Content


Authors


Commentary
On the changing asymmetry of global spillovers
June 19, 2020