President Donald Trump’s recent budget proposal called for major U.S. cuts to United Nations programs. Although many people think of “the U.N.” as a single monolithic entity, it is actually a broad system comprised of more than 30 organizations, each with its own mandate, ranging from peacekeeping to civil aviation coordination to child health and humanitarian food relief. (A full list of U.N. organizations is listed in Table 1 at bottom.)
The U.S. remains the largest funder of the U.N. system as a whole, but its support is not spread evenly across all the organizations. To consider the implications of potential changes in U.S. funding, two complementary questions need to be assessed:
- First, from a U.S. budget perspective, how big are American contributions to each U.N. organization?
- Second, from the perspective of each U.N. organization, how important are U.S. contributions?
We considered these questions by examining U.N. system budget data for 2014, the most recent year with full information available. For simplicity, we define U.S. “allocations” as the sum of both voluntary and assessed contributions, the latter being those that are required through membership in each organization.
How important is each U.N. organization from a U.S. budgetary perspective?
Figure 1 shows that five entities accounted for nearly three-quarters of the U.S.’s nearly $10 billion in allocations to the U.N. system in 2014. The top recipient, at 23 percent of U.S. allocations, is the World Food Program (WFP), an organization that many Americans might not even know to be part of the formal U.N. system. WFP is the world’s leading provider of humanitarian emergency food relief and in 2014 it received nearly $2.3 billion of American support. U.N. peacekeeping operations received slightly less, closer to $2.2 billion. The third-largest U.S. allocation was to the U.N. High Commissioner for Refugees (UNHCR), at more than $1.2 billion, or 13 percent of overall U.S. contributions. This was followed by $942 million for UNICEF, equivalent to 9 percent of U.S. allocations.
Figure 1: The distribution of U.S. funding allocations across U.N. organizations
 Note: Budget data are for 2014. “24 other U.N. orgs” include, in descending order of U.S. funding: UNDP; WHO; UNRWA; IOM; IAEA; FAO; ILO; PAHO; UNAIDS; UNFPA; UNEP; UNODC; IFAD; WTO; ICAO; WMO; UN-Women; ITU; UN-Habitat; UPU; IMO; WIPO; ITC; UNIDO. The U.S. was assessed $80 million for UNESCO in 2014 but suspended payment in 2011.
Rounding out the top five was the U.N.’s core organizational budget, which funds the secretariat—including things like the General Assembly operations and the secretary-general’s office—and also disburses funds to other U.N. bodies. Many people might be surprised to learn that this “core U.N.” budget line represents only around 7 percent of U.S. contributions to the U.N. system. The remaining $2.6 billion is spread across 24 specialized organizations, including technical bodies like the World Health Organization, the International Atomic Energy Agency, and the International Civil Aviation Organization. The U.S. did not support five U.N. bodies financially as of 2014, including UNESCO, UNOPS, UNU, UNITAR, and UNWTO (see description of acronyms in Table 1 at bottom).
How important is the U.S. to each UN organization’s budget?
American funding is more important to some U.N. organizations than to others. Figure 2 indicates the share of each U.N. body’s resources that U.S. allocations accounted for in 2014, recognizing that each body has a different sized underlying budget. The vertical bars are color-coded to highlight three general categories of U.N. organizations: those focused mainly on humanitarian or development purposes, denoted in red; those focused on collective security and core U.N. operations, denoted in blue; and those focused on technical issues, such as meteorology or telecommunications, captured in green. The boundaries between these categories are of course imprecise. For example, the World Health Organization (WHO) serves on the front line of global security efforts for the control of pandemic disease outbreaks like Ebola; plays a key role in advancing health efforts in developing countries; and is the world’s leader for coordinating health protocols on universal issues like aging and heart disease. For the purposes of this analysis, we include WHO in the green basket of technical agencies.
Figure 2: The share of U.N. organizations’ funding provided by the U.S.
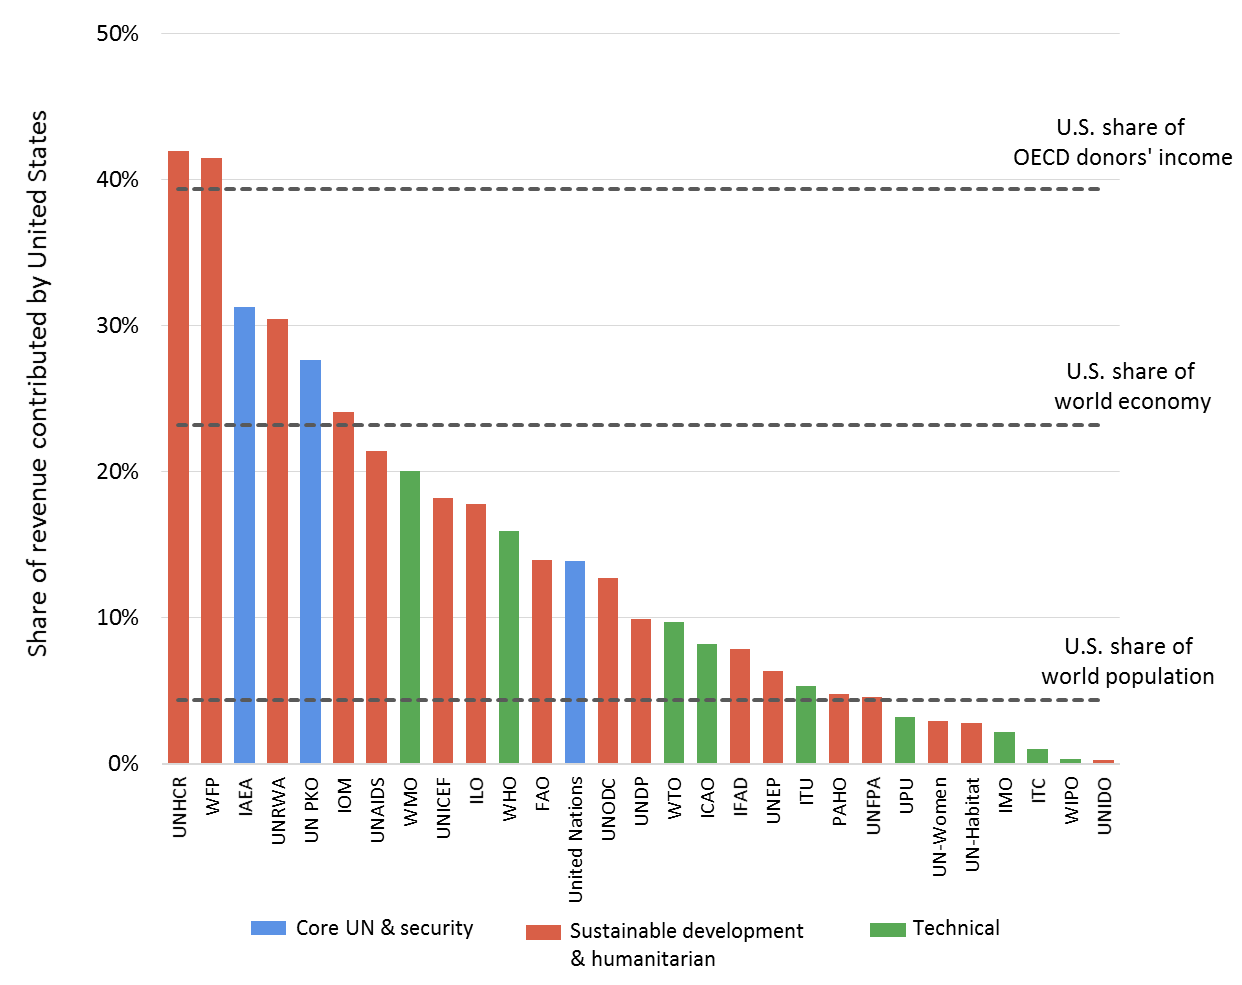
Note: Budget data are for 2014. See glossary of acronyms in Table 1 below.
The dotted horizontal lines indicate three potential benchmarks for considering U.S. responsibilities toward different organizations: the U.S. share of aggregate income across 29 official Organization for Economic Cooperation and Development donor countries, at approximately 39 percent in 2015; the U.S. share of the global economic activity, around 23 percent; and the U.S. share of world population, around 4 percent.
The left side of Figure 2 shows that the U.S. provides more than 40 percent of the funding received by both WFP and the UNHCR. U.S. contributions are clearly crucial to these organizations, and it is perhaps unsurprising that the leader of WFP has been an American since 1992. Meanwhile the U.S. contributes a vital 31 percent of funding to the International Atomic Energy Agency, although that body has a budget of only around $625 million, so it accounts for less than 2 percent of American allocations to the U.N. system. This is a key example where, from an absolute dollars perspective, the U.S. would not save much money from cutting funding to IAEA, but IAEA would suffer considerably from U.S. cuts.
Another five organizations receive 20 percent or more of their funding from the U.S. Meanwhile American taxpayers contribute 10 to 20 percent of the funding to six other organizations. The latter group prominently includes UNICEF, which has itself always been led by an American. It also includes the U.N.’s core budget, only 14 percent of which came from the U.S. in 2014. Note that this figure includes both voluntary and assessed (required) contributions and compares to the more commonly cited statistic of the U.S. providing 22 percent of assessed contributions alone. For the remaining 15 organizations, including the gender equality-focused U.N.-Women, the U.S. accounted for less than 10 percent of total funding. Complete underlying data tables for Figures 1 and 2 are also available here.
What next
The consequences of potential declines in U.S. contributions to the U.N. are specific to each organization. At the top of the list, a major cut in WFP funding would have rapid humanitarian and potentially geopolitical consequences. Other traditional donor countries might struggle to fill the budget gap, unless an emerging power like China decided to step up and replace the U.S. as the lead funder. At the other end of the spectrum, even eliminating U.S. funding to an organization like U.N.-Women might result in a lost seat at an important international policy table, but other countries could potentially fill the resulting budget gap more easily. Ultimately, in confronting scenarios like these, the U.S. needs to ask itself one foremost question: amid a period of rapid and unpredictable global change, how much responsibility does it want to take on in shaping the world’s new normal?
Table 1: List of all 34 U.N. organizations
 Source: As listed in UN Chief Executives Board for Coordination Financial Statistics Database
Note: A previous version of this post indicated that the leader of WFP has always been an American. It has since been corrected to clarify that this has only been the case since 1992.
UPDATE: Figures 1 and 2 have now also been replicated for 2015 UN budget data and are available here.
Related Content


Authors


Commentary
What would US cuts to the UN look like?
May 1, 2017