In 2000, the first set of Millennium Development Goals pledged to halve the proportion of people living in poverty as well as those living with hunger by 2015. This was less ambitious than the goal adopted by the World Food Summit in 1996, which aimed to cut the number of hungry by half.
The World Bank and the Food and Agricultural Organization (FAO) respectively monitor these poverty and hunger targets. The World Bank declared victory in poverty reduction in 2010, well before the target date of 2015. But with regards to hunger, the latest FAO report noted that globally about 795 million people are still undernourished—about 216 million less than in 1990, but a slow decline from the nearly 991 million hungry who lived in developing countries in 1990, the domain of the MDGs. The MDG’s hunger target of proportional decline was missed by only a small margin. Yet meeting the World Food Summit goal would have required bringing this number down to about 515 million, some 265 million fewer than the latest 2014-2016 estimate.
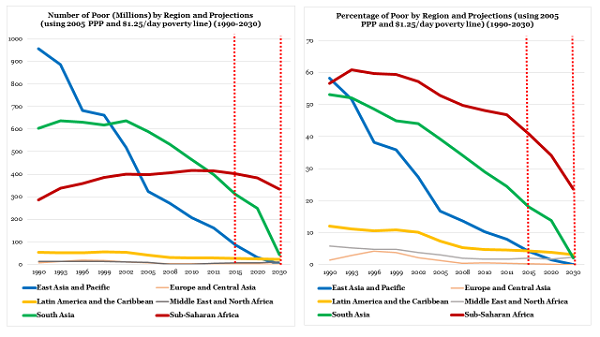
The achievement on hunger reduction seems underwhelming relative to the reported absolute levels and rates of decline in poverty. An estimated 1.9 billion lived below $1.25 in 1990-1992, nearly a billion more than the 990.7 million hungry estimated by the FAO in 1990. The decline in hungry of 216 million by 2015 was only about a quarter of the estimated decline in the number of poor at 835.5 million in 2015. The biggest decline has occurred in China and Southeast Asia. Chandy and Kharas have questioned the Chinese numbers that describe the country’s progress against poverty. Most of the remaining poverty as well as hunger is in South Asia and sub-Saharan Africa. In 2015, sub-Saharan Africa contained 403.2 million poor and 220 million hungry. In South Asia the corresponding numbers, respectively, are 310.6 million and 281.4 million. Both the World Bank and FAO have also predicted the likely numbers of poor and hungry through 2030 (Figures 1 and 2). Again the World Bank projects poverty to decline more rapidly, with most of the remaining 334.6 million poor out of total projected poor of 411.8 million being in sub-Saharan Africa. In South Asia, the projected 42.5 million would be only 10.3 percent of the global poor by 2030.
Figure 1. Poverty reduction: Performance and projections by region, 1990-2030 (millions of people)
Source:
http://www.worldbank.org/en/publication/global-monitoring-report
and
http://iresearch.worldbank.org/PovcalNet/index.htm
.
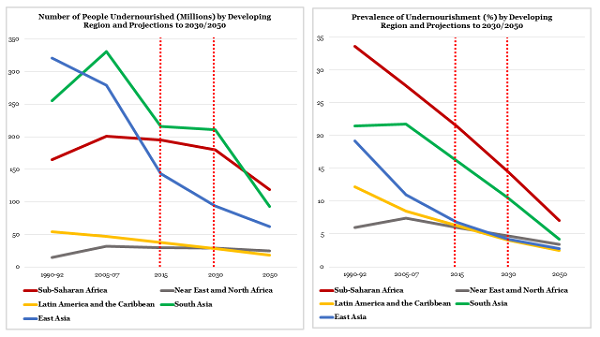
Figure 2. Hunger reduction: Performance and projections by region, 1990-2050 (millions of people)
Source:
http://www.fao.org/docrep/016/ap106e/ap106e.pdf
In contrast, the FAO projects a slower decline with hunger prevalence more evenly spread between South Asia and sub-Saharan Africa in 2030. Again, India dominates the South Asian picture and the Indian numbers are expected to be high notwithstanding some of the largest programs of safety nets in the world in place, including food distribution, employment guarantee schemes, and school feeding programs, among others.
Exploring the poverty-hunger relationship is overdue. Politically, every secretary-general of the United Nations, every World Bank president since Robert McNamara and every FAO director-general since its establishment have asserted that poverty and food insecurity are inexorably linked. Technically, the poor spend a larger share of their income on food and have higher income and price elasticities of demand than the well off. Even a small increase in food prices pulls people down into poverty; an estimated 46 million fell through the poverty line during the 2007-2008 food and financial crisis. Importantly, lessons from goal setting and their measurement under MDGs should influence adoption of the upcoming set of Sustainable Development Goals and their measurement. SDGs being developed will replace the expiring MDGs and run through 2030.
A part of the difference in performance of the two indicators is explained by how they are measured. The World Bank’s poverty measure PovcalNet is derived from Household Budget Surveys or Income and Expenditure surveys. The FAO measures the prevalence of undernourishment (PoU) at national, regional, and global levels, using dietary energy supply derived from the Food Balance Sheets using official national food statistics provided by member governments adjusted for distribution of income using a parametric procedure. Four dimensions of food security—availability, access, utilization, and stability—are updated annually. Available for nearly all countries, the PoU is the most widely quoted estimate of undernourishment.
In response to criticism, the FAO has refined its aggregate measure and increasingly used food consumption data from National Household Surveys to compute a set of food security statistics at national and sub-national levels (including gender disaggregated data) to derive coefficients on the distribution of food consumption within the population (coefficients of variation and skewness).There is a growing demand on the FAO to publish estimates of household food consumption going beyond calories to diet diversity measures. But some of the frequently measured indicators do not offer easy solutions to the PoU deficiencies.
It is more difficult to measure household and individual food intake than measuring income or expenditures. Household surveys used to estimate poverty have often proved inadequate for computing the level of caloric intake and even more inadequate for measuring diet diversity and micro-nutrient intake. In principle household survey data can be used to estimate the distribution of calories across population groups and income quintiles, but there are at least three challenges.
- the quantification of calories derived from food that is eaten away from home
- understanding intra-household access to food, particularly by women and children
- the widespread absence of data for national or global estimations
Even for poverty measurement, over 70 countries do not meet the criteria of two surveys in a 10-year period at a five-year interval. The data gap is much larger for food/caloric consumption. Some data-rich countries like India do not exploit data adequately for policy purposes. Hence, the difficulty in abandoning the PoU for a household-survey based measure to estimate national and global hunger. But the push for more consumption-based surveys is growing, including effort to repurpose existing surveys in light of their many uses, irrespective of whether these surveys will ultimately replace the PoU. The existing surveys unambiguously show the need for better food consumption data. The World Bank and FAO are beginning to pursue this effort jointly, but if the world is serious about the SDGs and global monitoring it will need to spend far more resources than the two institutions currently deploy and support complementary national capacity development to obtain global estimates.
This research is part of Uma Lele’s forthcoming book, Food for All: International Institutions and the Transformation of Agriculture.


Commentary
Measuring poverty and hunger can raise more questions than answers
June 15, 2015