The author would like to thank research analyst Andy Cerda, for his contributions to the Primaries Project.
It is difficult to understand American politics without understanding party primaries. Primaries determine the choices (or lack of choices) voters will have in November, but beyond that, they define the major differences between parties and the all-important major differences within parties. Those differences tell us a great deal about the constraints under which party leaders will operate in the coming years and can signal small to significant shifts in party orthodoxy. Here at Brookings, we have studied congressional primaries in four separate elections: 2014, 2016, 2018, and 2022. (We did not conduct the study in 2020 given the pandemic-related uncertainties that surrounded politics, especially in the primary season, that year.) In each year of the Primaries Project, we have taken a systematic look at every single candidate who got on the ballot to run for the House and Senate in those years. We have recorded basic demographic information on the candidates, their positions on the issues of the day, and their overall ideological positions within their party. Because, in American politics, for the last two generations, the vast majority of congressional districts are safe for one party or the other, the only race where many members of Congress feel vulnerable is their primary.
Hence, the issues and divisions that appear in party primaries shape outcomes in American politics as much as the issues and divisions that differentiate the two parties. American party primaries present a paradox. Most congressional primaries are not competitive, and when they are, incumbents win an overwhelming amount of the time. And yet, members of Congress adjust their behavior to protect themselves against primary challenges. In a 2018 paper I wrote with James Wallner, we found, based on literature reviews and interviews with incumbents in both parties, that:
- Incumbents worry about a primary threat;
- Incumbents believe contested primaries hurt their chances in the general election;
- Incumbents exaggerate successful primary challenges; and
- Incumbents believe that changes in their behavior help defer or defeat primary challengers.
This blog post is the first of three reports on the candidates that ran in the 2022 primaries for House and Senate. Part I will focus on the kind of people who decide to run for Congress using basic demographic information. Part II will focus on the political factions within each party along which candidates align. Part III will focus on the issues that create the starkest divisions between the parties and within each party.
Who Runs?
In 2022 there were 2,362 candidates who ran in party primaries and the non-partisan primaries of California, Washington, Alaska, and Nebraska. This was a small increase (82 candidates) over the number of people who ran in 2018. In contrast to the 2018 primaries, there were more Republican candidates in 2022 (1,397 or 59 percent of the total); while in 2018, there were more Democratic candidates than Republicans, which was to be expected since 2018 was predicted to be a good year for Democrats and 2022, for Republicans.
In 2022, 162 incumbent members of Congress ran for re-election without facing a primary challenger. Thus, 284 incumbents or 64% of the seats where incumbents were up for election faced one or more primary challengers. The trend seems to be that incumbents are getting challenged in primaries more often. In 2004, for instance, only 25 percent of Democratic House incumbents and 20 percent of Republican House incumbents had a primary challenge. In that first decade of the 21st century, the Tea Party and then the MAGA forces did not exist and the Bernie Sanders movement in the Democratic Party had not gained the strength it had a decade later.
Those numbers remained largely stable until 2010 when nearly 50 percent of Republican House incumbents faced a challenger. From 2010 on, the number of incumbents facing a challenge has remained high. This trend is testament to the increasing polarization of our politics, the increasing strength of factions within each political party, and the realization that contesting primaries was a very cost-effective way of changing political parties. Today we see far right, Trump Republicans seeking to remake the Republican party from within and more progressive Democrats doing the same in their party.
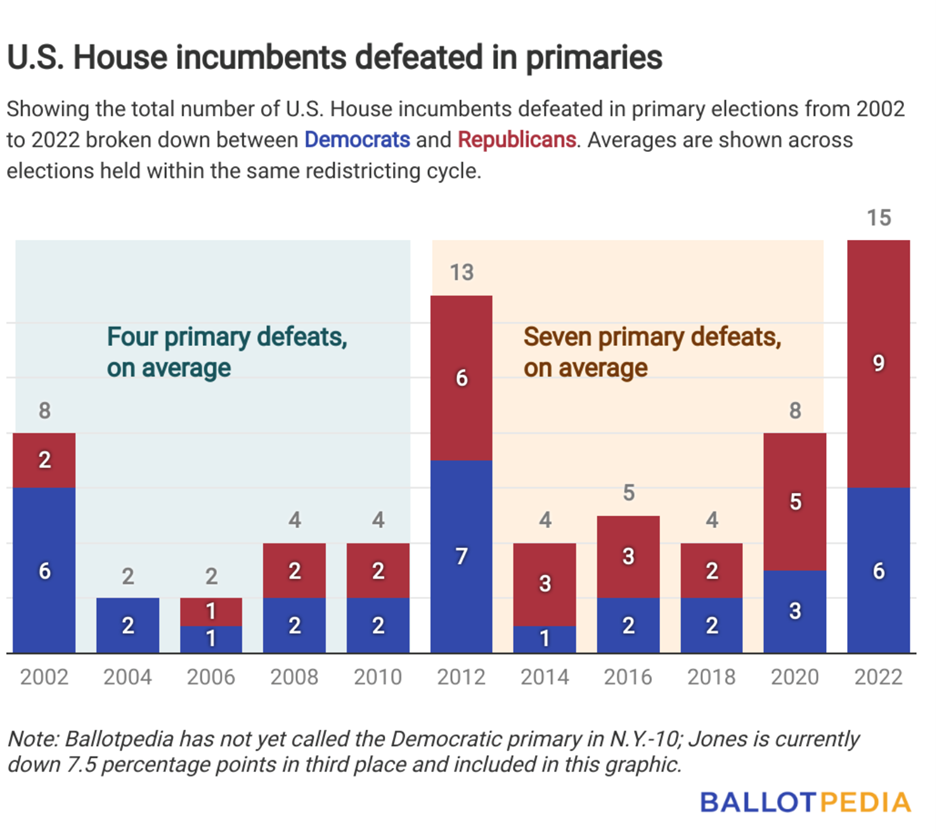
The increase in the number of challengers, however, does not change the basic fact that incumbents almost always win their primaries. Thus far in 2022, only 15 incumbents have lost their primaries. Although this is higher than the eight incumbents who lost in 2020, and higher than the incumbents who lost in 2014, 2016 and 2018, nearly half of those who have lost thus far were in redistricted seats where they were running against another incumbent, meaning an incumbent was required to lose. The last time incumbents lost more than 10 races was in 2012, which was the post-2010 census redistricting year when incumbents found themselves in new districts and/or running against other incumbents.
So, who has the time, expenses, and capacity for disruption in their lives to run for Congress in the first place?
Most of the people who run for Congress are middle-aged, white, male, and married. Not surprisingly, the Democratic candidates are more diverse. Seventy-two percent of Republican candidates are white and 48 percent of Democratic candidates are white. There are many more African American candidates among the Democrats; 25 percent of all Democratic candidates are African American, compared to seven percent of all the Republican candidates. Among Latinos the gap is not as large; 11 percent of the Democratic candidates are Latino and eight percent of the Republicans are.
In 2022, 27 percent of all candidates for Congress were women–and 73 percent were men. Thirty-four percent of the Democrats were women in contrast to 22 percent of Republicans. The number of women running in 2022 (630) is slightly bigger than the number who ran in 2018 (528 or 23 percent). Moreover, in 2018, as in 2022, more of these candidates were Democrats than Republicans. A sign of changing times–five candidates, all Democrats, identified as transgender/non-binary.
Exactly 50 percent of all candidates in 2022 were married, and for the vast majority of the remainder, marital status could not be identified. More Republicans than Democrats identified themselves as married. Only 1.6 percent of candidates identified themselves as gay, lesbian, or bisexual, and almost all of these were Democrats.
Candidates for Congress also tend to be fairly well educated. The vast majority of candidates (71 percent) have a college degree or a post-graduate degree. A larger proportion of Democrats than Republicans have a graduate degree. However, there is a large number who list no educational information at all which means that the number without college degrees is likely larger.
Finally, we looked to see if candidates had military service. In total, 404 candidates had served in the military, and most displayed their military service with great pride. This is about the same number of active duty servicepeople/veterans who ran in 2018. As in 2018, most with military service (72 percent) were Republicans.
By and large, electoral politics is still largely dominated by white men with high levels of education. There are some exceptions. In the Democratic Party, African Americans are quite dominant. Although they constitute 12 percent of the population, African Americans participate heavily in Democratic politics–fully 25 percent of the Democratic candidates in 2022 were African American. On the other hand, Latinos constitute 19 percent of the population but participate in running for office in far smaller numbers: only 11 percent of Democratic candidates are Hispanic and 8 percent of Republican candidates. This may be because the Latino population is more geographically compressed or because they are a younger population, and running for office, especially Congress, requires more years of experience. That is a topic for further study.
Next, we will look at the ideological make-up of the 2022 primary candidates…
Related Content
Authors


Commentary
Lessons from the 2022 Primaries–what do they tell us about America’s political parties and the midterm elections?
Part I - Who runs?
September 7, 2022